Application Platform Market Analysis North America, Europe, APAC, South America, Middle East and Africa - US, China, Australia, Germany, UK - Size and Forecast 2024-2028

Application Platform Market Analysis North America, Europe, APAC, South America, Middle East and Africa - US, China, Australia, Germany, UK - Size and Forecast 2024-2028

Published: Mar 2024 174 Pages SKU: IRTNTR40161

Market Overview at a Glance

$5.67 B
Market Opportunity
6.34%
CAGR
5.85
YoY growth 2023-2024(%)

Application Platform Market Size 2024-2028 

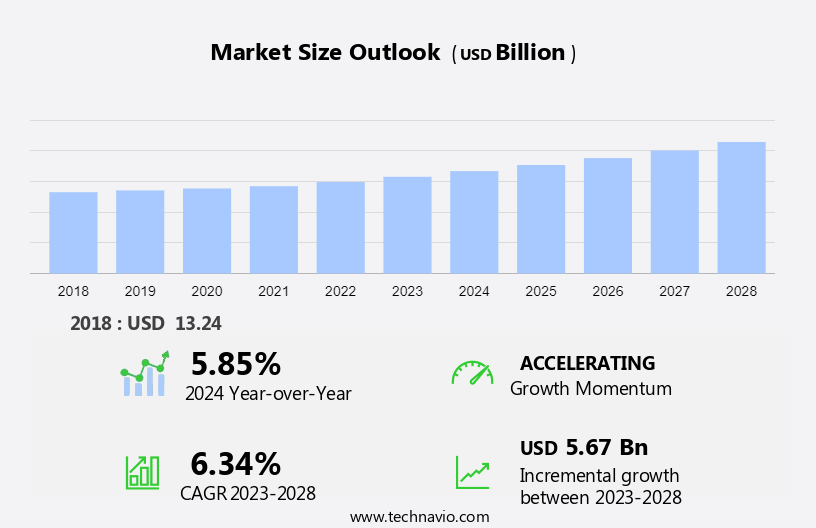
The application platform market size is forecast to increase by USD 5.67 billion at a CAGR of 6.34% between 2023 and 2028. The market is experiencing significant growth, driven by the increasing adoption of cloud services and the emergence of low-code application platforms. These trends enable organizations to streamline application codes release processes, ensuring superior infrastructure performances for their customized business applications. The use of paid software and open-source software, in conjunction with load balancers, auto-scaling orchestrators, and automated deployment tools, is becoming increasingly prevalent. This trend is driven by the increasing use of smartphones and wearable devices, leading to mobile app development. 

However, challenges persist, such as the potential for company lock-in, which may limit the flexibility of organizations in choosing the best solution for their needs. Application Platform-as-a-Service (aPaaS) offerings continue to gain traction, providing businesses with cost-effective and efficient solutions to build, deploy, and manage their applications.

Market Analysis

Application Platform Market Size

 Request Free Sample

The market is witnessing significant growth due to the increasing adoption of DevOps practices and cloud-based services. Cloud-based application platforms are becoming increasingly popular among developers as they offer easier deployment, scalability, and flexibility. These platforms provide development tools that run on various operating systems, including cloud solutions and CICS, enabling developers to create, test, and deploy application codes efficiently. Cloud computing technology plays a crucial role in the market, providing execution services, data services, and infrastructure performances. Application platform software offers diverse hardware support and integration with database management systems, making it an essential component of IT infrastructure.

Moreover, the market engineering process involves statistics and data triangulation to analyze market trends and forecast future growth. Application release processes are streamlined with managed services, ensuring seamless deployment and support and maintenance of applications. Overall, the market is expected to grow steadfastly, driven by the need for efficient development, deployment, and management of application codes in the IT industry.

Market Segmentation

The market research report provides comprehensive data (region-wise segment analysis), with forecasts and estimates in "USD billion" for the period 2024-2028, as well as historical data from 2018-2022 for the following segments.
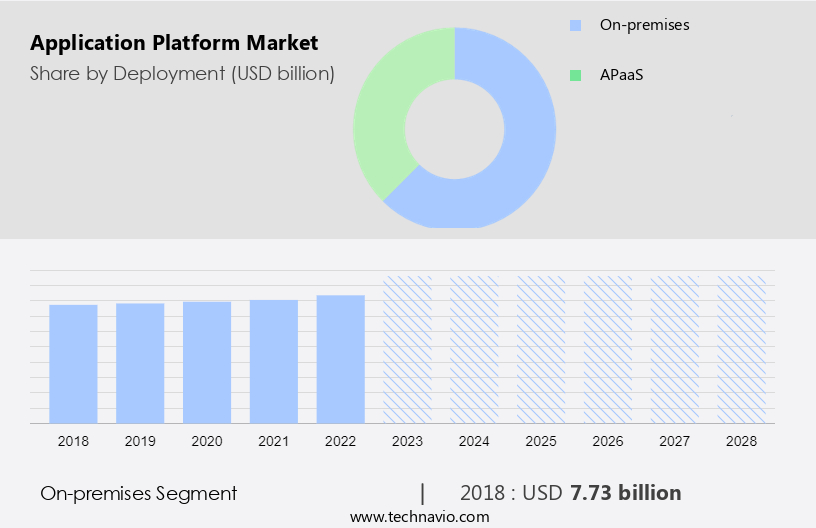
  • Deployment
    • On-premises
    • aPaaS
  • End-user
    • Large enterprises
    • SMEs
  • Geography
    • North America
      • US
    • Europe
      • Germany
      • UK
    • APAC
      • China
    • South America
    • Middle East and Africa

By Deployment Insights

The on-premises segment is estimated to witness significant growth during the forecast period. The market encompasses various deployment models, including Application Platform-as-Service (aPaaS) and on-premises. While aPaaS offers benefits such as easier application release processes and improved infrastructure performances through cloud services, on-premises deployment remains popular among large enterprises due to its enhanced security features. In the on-premises model, application codes are run on dedicated servers, providing greater control and security over data storage. This is in contrast to aPaaS, where data is spread across multiple servers, increasing potential vulnerabilities. The on-premises model's security advantages include physical access controls and customized security protocols, making it a preferred choice for businesses dealing with sensitive information.

Moreover, automated deployment tools, load balancers, and auto-scaling orchestrators further enhance the functionality of on-premises application platforms. Both paid software and open-source software options are available in the market to cater to diverse business needs.

Application Platform Market Size

Get a glance at the market share of various segments Request Free Sample

The on-premises segment was valued at USD 7.73 billion in 2018 and showed a gradual increase during the forecast period.

Regional Insights

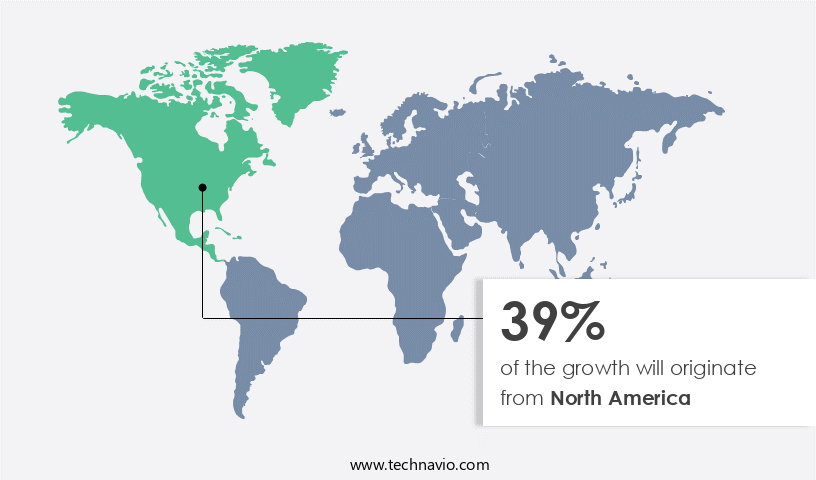
North America is estimated to contribute 39% to the growth of the global market during the forecast period. Technavio's analysts have elaborately explained the regional trends and drivers that shape the market during the forecast period.

Application Platform Market Share by Geography

For more insights on the market share of various regions Request Free Sample

North America's Early Adoption and Key Trends North America is currently leading the market due to the early adoption of application platform software, particularly in enterprise environments. Enterprises are leveraging Application Platform-as-a-Service (aPaaS) solutions and cloud services to build, test, and deploy applications quickly. Major companies, including SAP SE and International Business Machines Corp (IBM), offer mobile app development platforms, enabling businesses to customize applications to meet their unique requirements. Infrastructure performances, such as load balancers and auto-scaling orchestrators, are essential components of these platforms, ensuring optimal application release processes and user experiences.

Moreover, the market is segmented into paid software and open-source software. Paid software offers advanced features and support, while open-source software provides flexibility and cost savings. Regardless of the chosen option, automated deployment tools streamline the development process, ensuring efficient application codes deployment. In summary, the market in North America is thriving due to the early adoption of mobile technologies and the need for customized business applications. companies are offering innovative solutions to cater to the evolving demands of businesses, ensuring optimal application performance and user experiences.

Market Dynamics

Our researchers analyzed the data with 2023 as the base year, along with the key drivers, trends, and challenges. A holistic analysis of drivers will help companies refine their marketing strategies to gain a competitive advantage.

Market Driver

The growing popularity of cloud-based services is the key driver of the market. In today's business landscape, globally, enterprises are shifting towards Application Platform as a Service (aPaaS) solutions to minimize their capital expenditures (CAPEX) and reduce the complexities and expenses associated with building and maintaining on-premises applications. Traditional on-premises applications necessitate significant investments in hardware, operating systems (OS), databases, middleware, servers, and other software. Small and medium-sized enterprises (SMEs) are particularly drawn to aPaaS offerings as they offer on-demand access to hardware, middleware, OS, software, and resources. Cloud platforms, including those for iOS, Windows, and other operating systems, provide numerous benefits to organizations. By moving to the cloud, businesses can transition from CAPEX to operational expenditures (OPEX), significantly reducing the upfront costs for servers and network equipment.

Moreover, this cost shift is particularly advantageous for industries such as transportation and logistics, media and entertainment, and those requiring email, network, and web security. Furthermore, aPaaS solutions offer managed services and support and maintenance, enabling organizations to focus on their core competencies while ensuring the reliability and security of their applications.

Market Trends

The emergence of low-code application platforms is the upcoming trend in the market. Low-code application platforms have become essential tools for businesses seeking to quickly develop and deploy applications in response to evolving market demands and customer needs. These platforms offer visual interfaces, drag-and-drop components, and pre-built templates, enabling developers to create applications with minimal coding. This significantly reduces development time and accelerates time-to-market for new products and features. The use of low-code application platforms extends to various industries, including transportation and logistics, media and entertainment, and email and network security for IOS and Windows platforms. In the context of email and network security, these platforms can facilitate the development of applications that ensure data triangulation and enhance web and transport security. Moreover, low-code application platforms provide support and maintenance services, as well as managed services, ensuring that applications remain up-to-date and functioning optimally. This is crucial for businesses that require continuous application availability and performance.

Market Challenge

Issues associated with company lock-in is a key challenge affecting the market growth. The market: company lock-ins are a challenge in the rapidly evolving technology landscape, particularly in the realm of Application Platform as a Service (aPaaS). IOS and Windows users may find it difficult to switch aPaaS providers after developing applications using specific platform software and tools. This dependency arises due to the lack of compatibility with other companies' programming languages, APIs, architectures, libraries, or operating systems. Integration of various systems and technologies from diverse companies is a common requirement in application development, encompassing sectors like transportation and logistics, media and entertainment, and email and network security. Web security and data triangulation are additional critical aspects. However, the companies and solution providers offer support and maintenance, as well as managed services, to cater to these needs.

Exclusive Customer Landscape

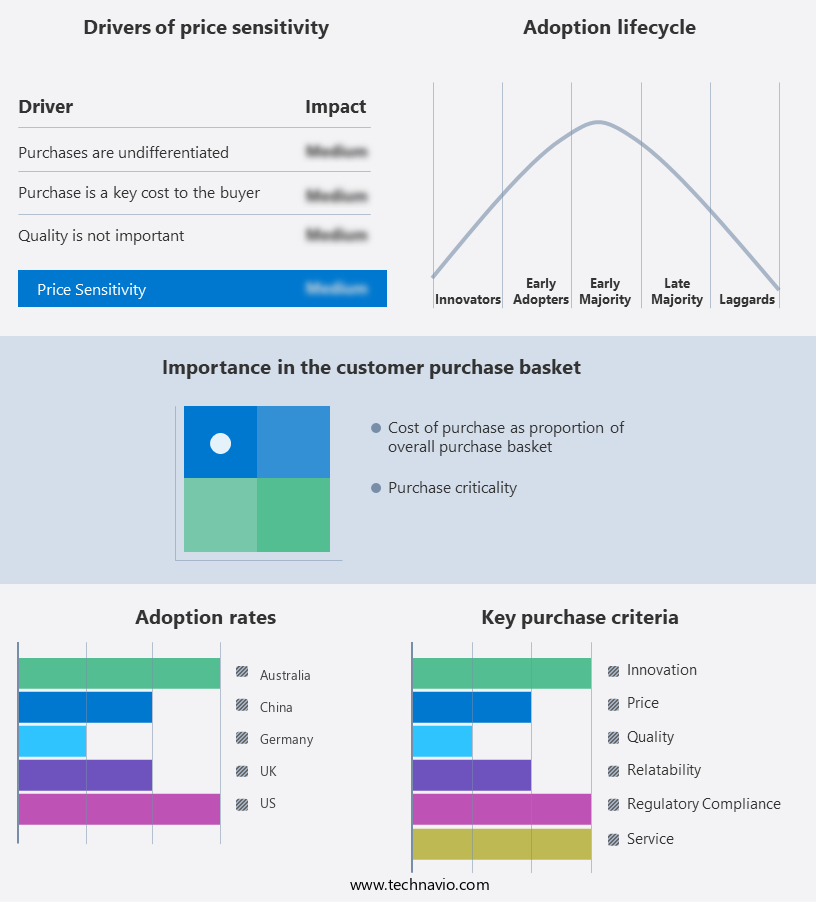
The market forecasting report includes the adoption lifecycle of the market, covering from the innovator's stage to the laggard's stage. It focuses on adoption rates in different regions based on penetration. Furthermore, the report also includes key purchase criteria and drivers of price sensitivity to help companies evaluate and develop their market growth analysis strategies.

Application Platform Market Share by Geography

 Customer Landscape

Key Companies & Market Insights

Companies are implementing various strategies, such as strategic alliances, partnerships, mergers and acquisitions, geographical expansion, and product/service launches, to enhance their presence in the market.

Alphabet Inc.: The company offers application platform such as Akamai Intelligent Edge Platform, which provide cloud services for delivering and securing digital experiences across web and mobile applications, content delivery, and cybersecurity solutions.

The market research and growth report includes detailed analyses of the competitive landscape of the market and information about key companies, including:

  • Alphabet Inc.
  • Amazon.com Inc.
  • Appian Corp.
  • Betty Blocks BV
  • BMC Software Inc.
  • Caucho Technology Inc
  • Cisco Systems Inc.
  • GigaSpaces
  • Hewlett Packard Enterprise Co.
  • Hitachi Ltd.
  • International Business Machines Corp.
  • Microsoft Corp.
  • Open Text Corp.
  • Oracle Corp.
  • Salesforce Inc.
  • SAP SE
  • Siemens AG
  • VANTIQ Inc.
  • Wipro Ltd.
  • Zerone Consulting Pvt. Ltd.
  • Akamai Technologies Inc.

Qualitative and quantitative analysis of companies has been conducted to help clients understand the wider business environment as well as the strengths and weaknesses of key market players. Data is qualitatively analyzed to categorize companies as pure play, category-focused, industry-focused, and diversified; it is quantitatively analyzed to categorize companies as dominant, leading, strong, tentative, and weak.

Research Analyst Overview

The market is a significant segment of the information technology industry, driven by the increasing adoption of cloud-based services and the shift towards cloud-native applications. Application platform software includes development tools, execution services, data services, and cloud solutions that enable developers to build, deploy, and manage applications. Cloud-based application platforms are becoming increasingly popular due to their flexibility, scalability, and cost savings. These platforms offer a range of features such as automation, artificial intelligence, and integration with diverse hardware and operating systems including Android, iOS, and Windows. The market caters to various industries such as transportation and logistics, media and entertainment, and software services.

Moreover, the security services including email, network, and web security are essential components of application platforms. Platform-as-a-Service (PaaS) and Application Platform-as-a-Service (APaaS) are popular models in the market. APaaS platforms offer managed services, drag-and-drop interfaces, hot reloading, and 3rd party integrations. Infrastructure performances, customized business applications, database management, and microservices are key areas of focus for application platform companies. The market is segmented into software segment, deployment & integration, support & maintenance, and infrastructure performances. The market is characterized by a multi-cloud strategy, with organizations using a mix of paid software and open-source software. Load balancers, auto-scaling orchestrators, and automated deployment tools are essential components of application platforms. The market is expected to grow significantly due to the increasing demand for cloud services, the need for efficient deployment and integration, and the requirement for enhanced security features.

Market Scope

Report Coverage

Details

Page number

174

Base year

2023

Historic period

2018-2022

Forecast period

2024-2028

Growth momentum & CAGR

Accelerate at a CAGR of 6.34%

Market growth 2024-2028

USD 5.67 billion

Market structure

Fragmented

YoY growth 2023-2024(%)

5.85

Regional analysis

North America, Europe, APAC, South America, and Middle East and Africa

Performing market contribution

North America at 39%

Key countries

US, China, Australia, Germany, and UK

Competitive landscape

Leading Companies, Market Positioning of Companies, Competitive Strategies, and Industry Risks

Key companies profiled

Adobe Inc., Alphabet Inc., Amazon.com Inc., Appian Corp., Betty Blocks BV, BMC Software Inc., Caucho Technology Inc, Cisco Systems Inc., GigaSpaces, Hewlett Packard Enterprise Co., Hitachi Ltd., International Business Machines Corp., Microsoft Corp., Open Text Corp., Oracle Corp., Salesforce Inc., SAP SE, Siemens AG, VANTIQ Inc., Wipro Ltd., Zerone Consulting Pvt. Ltd., and Akamai Technologies Inc.

Market dynamics

Parent market analysis, market growth inducers and obstacles, market forecast, fast-growing and slow-growing segment analysis, COVID-19 impact and recovery analysis and future consumer dynamics, market condition analysis for the forecast period

Customization purview

If our market report has not included the data that you are looking for, you can reach out to our analysts and get segments customized.

Request Free Sample

What are the Key Data Covered in this Market Research and Growth Report?

  • CAGR of the market during the forecast period
  • Detailed information on factors that will drive the market growth and forecasting between 2024 and 2028
  • Precise estimation of the size of the market  and its contribution of the market in focus to the parent market
  • Accurate predictions about upcoming market growth and trends and changes in consumer behaviour
  • Growth of the market across North America, Europe, APAC, South America, and Middle East and Africa
  • Thorough analysis of the market's competitive landscape and detailed information about companies
  • Comprehensive analysis of factors that will challenge the growth of market companies

We can help! Our analysts can customize this market research report to meet your requirements. Get in touch

1 Executive Summary

  • 1.1 Market overview
    • Exhibit 01: Executive Summary – Chart on Market Overview
    • Exhibit 02: Executive Summary – Data Table on Market Overview
    • Exhibit 03: Executive Summary – Chart on Global Market Characteristics
    • Exhibit 04: Executive Summary – Chart on Market by Geography
    • Exhibit 05: Executive Summary – Chart on Market Segmentation by Deployment
    • Exhibit 06: Executive Summary – Chart on Market Segmentation by End-user
    • Exhibit 07: Executive Summary – Chart on Incremental Growth
    • Exhibit 08: Executive Summary – Data Table on Incremental Growth
    • Exhibit 09: Executive Summary – Chart on Vendor Market Positioning

2 Market Landscape

  • 2.1 Market ecosystem
    • Exhibit 10: Parent market
    • Exhibit 11: Market Characteristics

3 Market Sizing

  • 3.1 Market definition
    • Exhibit 12: Offerings of vendors included in the market definition
  • 3.2 Market segment analysis
    • Exhibit 13: Market segments
  • 3.3 Market size 2023
    • 3.4 Market outlook: Forecast for 2023-2028
      • Exhibit 14: Chart on Global - Market size and forecast 2023-2028 ($ billion)
      • Exhibit 15: Data Table on Global - Market size and forecast 2023-2028 ($ billion)
      • Exhibit 16: Chart on Global Market: Year-over-year growth 2023-2028 (%)
      • Exhibit 17: Data Table on Global Market: Year-over-year growth 2023-2028 (%)

    4 Historic Market Size

    • 4.1 Global Application Platform market 2018 - 2022
      • Exhibit 18: Historic Market Size – Data Table on global application platform market 2018 - 2022 ($ billion)
    • 4.2 Deployment Segment Analysis 2018 - 2022
      • Exhibit 19: Historic Market Size – Deployment Segment 2018 - 2022 ($ billion)
    • 4.3 End-user Segment Analysis 2018 - 2022
      • Exhibit 20: Historic Market Size – End-user Segment 2018 - 2022 ($ billion)
    • 4.4 Geography Segment Analysis 2018 - 2022
      • Exhibit 21: Historic Market Size – Geography Segment 2018 - 2022 ($ billion)
    • 4.5 Country Segment Analysis 2018 - 2022
      • Exhibit 22: Historic Market Size – Country Segment 2018 - 2022 ($ billion)

    5 Five Forces Analysis

    • 5.1 Five forces summary
      • Exhibit 23: Five forces analysis - Comparison between 2023 and 2028
    • 5.2 Bargaining power of buyers
      • Exhibit 24: Chart on Bargaining power of buyers – Impact of key factors 2023 and 2028
    • 5.3 Bargaining power of suppliers
      • Exhibit 25: Bargaining power of suppliers – Impact of key factors in 2023 and 2028
    • 5.4 Threat of new entrants
      • Exhibit 26: Threat of new entrants – Impact of key factors in 2023 and 2028
    • 5.5 Threat of substitutes
      • Exhibit 27: Threat of substitutes – Impact of key factors in 2023 and 2028
    • 5.6 Threat of rivalry
      • Exhibit 28: Threat of rivalry – Impact of key factors in 2023 and 2028
    • 5.7 Market condition
      • Exhibit 29: Chart on Market condition - Five forces 2023 and 2028

    6 Market Segmentation by Deployment

    • 6.1 Market segments
      • Exhibit 30: Chart on Deployment - Market share 2023-2028 (%)
      • Exhibit 31: Data Table on Deployment - Market share 2023-2028 (%)
    • 6.2 Comparison by Deployment
      • Exhibit 32: Chart on Comparison by Deployment
      • Exhibit 33: Data Table on Comparison by Deployment
    • 6.3 On-premises - Market size and forecast 2023-2028
      • Exhibit 34: Chart on On-premises - Market size and forecast 2023-2028 ($ billion)
      • Exhibit 35: Data Table on On-premises - Market size and forecast 2023-2028 ($ billion)
      • Exhibit 36: Chart on On-premises - Year-over-year growth 2023-2028 (%)
      • Exhibit 37: Data Table on On-premises - Year-over-year growth 2023-2028 (%)
    • 6.4 aPaaS - Market size and forecast 2023-2028
      • Exhibit 38: Chart on aPaaS - Market size and forecast 2023-2028 ($ billion)
      • Exhibit 39: Data Table on aPaaS - Market size and forecast 2023-2028 ($ billion)
      • Exhibit 40: Chart on aPaaS - Year-over-year growth 2023-2028 (%)
      • Exhibit 41: Data Table on aPaaS - Year-over-year growth 2023-2028 (%)
    • 6.5 Market opportunity by Deployment
      • Exhibit 42: Market opportunity by Deployment ($ billion)
      • Exhibit 43: Data Table on Market opportunity by Deployment ($ billion)

    7 Market Segmentation by End-user

    • 7.1 Market segments
      • Exhibit 44: Chart on End-user - Market share 2023-2028 (%)
      • Exhibit 45: Data Table on End-user - Market share 2023-2028 (%)
    • 7.2 Comparison by End-user
      • Exhibit 46: Chart on Comparison by End-user
      • Exhibit 47: Data Table on Comparison by End-user
    • 7.3 Large enterprises - Market size and forecast 2023-2028
      • Exhibit 48: Chart on Large enterprises - Market size and forecast 2023-2028 ($ billion)
      • Exhibit 49: Data Table on Large enterprises - Market size and forecast 2023-2028 ($ billion)
      • Exhibit 50: Chart on Large enterprises - Year-over-year growth 2023-2028 (%)
      • Exhibit 51: Data Table on Large enterprises - Year-over-year growth 2023-2028 (%)
    • 7.4 SMEs - Market size and forecast 2023-2028
      • Exhibit 52: Chart on SMEs - Market size and forecast 2023-2028 ($ billion)
      • Exhibit 53: Data Table on SMEs - Market size and forecast 2023-2028 ($ billion)
      • Exhibit 54: Chart on SMEs - Year-over-year growth 2023-2028 (%)
      • Exhibit 55: Data Table on SMEs - Year-over-year growth 2023-2028 (%)
    • 7.5 Market opportunity by End-user
      • Exhibit 56: Market opportunity by End-user ($ billion)
      • Exhibit 57: Data Table on Market opportunity by End-user ($ billion)

    8 Customer Landscape

    • 8.1 Customer landscape overview
      • Exhibit 58: Analysis of price sensitivity, lifecycle, customer purchase basket, adoption rates, and purchase criteria

    9 Geographic Landscape

    • 9.1 Geographic segmentation
      • Exhibit 59: Chart on Market share by geography 2023-2028 (%)
      • Exhibit 60: Data Table on Market share by geography 2023-2028 (%)
    • 9.2 Geographic comparison
      • Exhibit 61: Chart on Geographic comparison
      • Exhibit 62: Data Table on Geographic comparison
    • 9.3 North America - Market size and forecast 2023-2028
      • Exhibit 63: Chart on North America - Market size and forecast 2023-2028 ($ billion)
      • Exhibit 64: Data Table on North America - Market size and forecast 2023-2028 ($ billion)
      • Exhibit 65: Chart on North America - Year-over-year growth 2023-2028 (%)
      • Exhibit 66: Data Table on North America - Year-over-year growth 2023-2028 (%)
    • 9.4 Europe - Market size and forecast 2023-2028
      • Exhibit 67: Chart on Europe - Market size and forecast 2023-2028 ($ billion)
      • Exhibit 68: Data Table on Europe - Market size and forecast 2023-2028 ($ billion)
      • Exhibit 69: Chart on Europe - Year-over-year growth 2023-2028 (%)
      • Exhibit 70: Data Table on Europe - Year-over-year growth 2023-2028 (%)
    • 9.5 APAC - Market size and forecast 2023-2028
      • Exhibit 71: Chart on APAC - Market size and forecast 2023-2028 ($ billion)
      • Exhibit 72: Data Table on APAC - Market size and forecast 2023-2028 ($ billion)
      • Exhibit 73: Chart on APAC - Year-over-year growth 2023-2028 (%)
      • Exhibit 74: Data Table on APAC - Year-over-year growth 2023-2028 (%)
    • 9.6 South America - Market size and forecast 2023-2028
      • Exhibit 75: Chart on South America - Market size and forecast 2023-2028 ($ billion)
      • Exhibit 76: Data Table on South America - Market size and forecast 2023-2028 ($ billion)
      • Exhibit 77: Chart on South America - Year-over-year growth 2023-2028 (%)
      • Exhibit 78: Data Table on South America - Year-over-year growth 2023-2028 (%)
    • 9.7 Middle East and Africa - Market size and forecast 2023-2028
      • Exhibit 79: Chart on Middle East and Africa - Market size and forecast 2023-2028 ($ billion)
      • Exhibit 80: Data Table on Middle East and Africa - Market size and forecast 2023-2028 ($ billion)
      • Exhibit 81: Chart on Middle East and Africa - Year-over-year growth 2023-2028 (%)
      • Exhibit 82: Data Table on Middle East and Africa - Year-over-year growth 2023-2028 (%)
    • 9.8 US - Market size and forecast 2023-2028
      • Exhibit 83: Chart on US - Market size and forecast 2023-2028 ($ billion)
      • Exhibit 84: Data Table on US - Market size and forecast 2023-2028 ($ billion)
      • Exhibit 85: Chart on US - Year-over-year growth 2023-2028 (%)
      • Exhibit 86: Data Table on US - Year-over-year growth 2023-2028 (%)
    • 9.9 Germany - Market size and forecast 2023-2028
      • Exhibit 87: Chart on Germany - Market size and forecast 2023-2028 ($ billion)
      • Exhibit 88: Data Table on Germany - Market size and forecast 2023-2028 ($ billion)
      • Exhibit 89: Chart on Germany - Year-over-year growth 2023-2028 (%)
      • Exhibit 90: Data Table on Germany - Year-over-year growth 2023-2028 (%)
    • 9.10 China - Market size and forecast 2023-2028
      • Exhibit 91: Chart on China - Market size and forecast 2023-2028 ($ billion)
      • Exhibit 92: Data Table on China - Market size and forecast 2023-2028 ($ billion)
      • Exhibit 93: Chart on China - Year-over-year growth 2023-2028 (%)
      • Exhibit 94: Data Table on China - Year-over-year growth 2023-2028 (%)
    • 9.11 UK - Market size and forecast 2023-2028
      • Exhibit 95: Chart on UK - Market size and forecast 2023-2028 ($ billion)
      • Exhibit 96: Data Table on UK - Market size and forecast 2023-2028 ($ billion)
      • Exhibit 97: Chart on UK - Year-over-year growth 2023-2028 (%)
      • Exhibit 98: Data Table on UK - Year-over-year growth 2023-2028 (%)
    • 9.12 Australia - Market size and forecast 2023-2028
      • Exhibit 99: Chart on Australia - Market size and forecast 2023-2028 ($ billion)
      • Exhibit 100: Data Table on Australia - Market size and forecast 2023-2028 ($ billion)
      • Exhibit 101: Chart on Australia - Year-over-year growth 2023-2028 (%)
      • Exhibit 102: Data Table on Australia - Year-over-year growth 2023-2028 (%)
    • 9.13 Market opportunity by geography
      • Exhibit 103: Market opportunity by geography ($ billion)
      • Exhibit 104: Data Tables on Market opportunity by geography ($ billion)

    10 Drivers, Challenges, and Trends

    • 10.1 Market drivers
      • 10.2 Market challenges
        • 10.3 Impact of drivers and challenges
          • Exhibit 105: Impact of drivers and challenges in 2023 and 2028
        • 10.4 Market trends

          11 Vendor Landscape

          • 11.1 Overview
            • 11.2 Vendor landscape
              • Exhibit 106: Overview on Criticality of inputs and Factors of differentiation
            • 11.3 Landscape disruption
              • Exhibit 107: Overview on factors of disruption
            • 11.4 Industry risks
              • Exhibit 108: Impact of key risks on business

            12 Vendor Analysis

            • 12.1 Vendors covered
              • Exhibit 109: Vendors covered
            • 12.2 Market positioning of vendors
              • Exhibit 110: Matrix on vendor position and classification
            • 12.3 Adobe Inc.
              • Exhibit 111: Adobe Inc. - Overview
              • Exhibit 112: Adobe Inc. - Business segments
              • Exhibit 113: Adobe Inc. - Key offerings
              • Exhibit 114: Adobe Inc. - Segment focus
            • 12.4 Akamai Technologies Inc.
              • Exhibit 115: Akamai Technologies Inc. - Overview
              • Exhibit 116: Akamai Technologies Inc. - Business segments
              • Exhibit 117: Akamai Technologies Inc. - Key news
              • Exhibit 118: Akamai Technologies Inc. - Key offerings
              • Exhibit 119: Akamai Technologies Inc. - Segment focus
            • 12.5 Alphabet Inc.
              • Exhibit 120: Alphabet Inc. - Overview
              • Exhibit 121: Alphabet Inc. - Business segments
              • Exhibit 122: Alphabet Inc. - Key news
              • Exhibit 123: Alphabet Inc. - Key offerings
              • Exhibit 124: Alphabet Inc. - Segment focus
            • 12.6 Appian Corp.
              • Exhibit 125: Appian Corp. - Overview
              • Exhibit 126: Appian Corp. - Product / Service
              • Exhibit 127: Appian Corp. - Key news
              • Exhibit 128: Appian Corp. - Key offerings
            • 12.7 Betty Blocks BV
              • Exhibit 129: Betty Blocks BV - Overview
              • Exhibit 130: Betty Blocks BV - Product / Service
              • Exhibit 131: Betty Blocks BV - Key offerings
            • 12.8 BMC Software Inc.
              • Exhibit 132: BMC Software Inc. - Overview
              • Exhibit 133: BMC Software Inc. - Product / Service
              • Exhibit 134: BMC Software Inc. - Key offerings
            • 12.9 Cisco Systems Inc.
              • Exhibit 135: Cisco Systems Inc. - Overview
              • Exhibit 136: Cisco Systems Inc. - Business segments
              • Exhibit 137: Cisco Systems Inc. - Key news
              • Exhibit 138: Cisco Systems Inc. - Key offerings
              • Exhibit 139: Cisco Systems Inc. - Segment focus
            • 12.10 GigaSpaces
              • Exhibit 140: GigaSpaces - Overview
              • Exhibit 141: GigaSpaces - Product / Service
              • Exhibit 142: GigaSpaces - Key offerings
            • 12.11 International Business Machines Corp.
              • Exhibit 143: International Business Machines Corp. - Overview
              • Exhibit 144: International Business Machines Corp. - Business segments
              • Exhibit 145: International Business Machines Corp. - Key news
              • Exhibit 146: International Business Machines Corp. - Key offerings
              • Exhibit 147: International Business Machines Corp. - Segment focus
            • 12.12 Microsoft Corp.
              • Exhibit 148: Microsoft Corp. - Overview
              • Exhibit 149: Microsoft Corp. - Business segments
              • Exhibit 150: Microsoft Corp. - Key news
              • Exhibit 151: Microsoft Corp. - Key offerings
              • Exhibit 152: Microsoft Corp. - Segment focus
            • 12.13 Open Text Corp.
              • Exhibit 153: Open Text Corp. - Overview
              • Exhibit 154: Open Text Corp. - Product / Service
              • Exhibit 155: Open Text Corp. - Key news
              • Exhibit 156: Open Text Corp. - Key offerings
            • 12.14 Oracle Corp.
              • Exhibit 157: Oracle Corp. - Overview
              • Exhibit 158: Oracle Corp. - Business segments
              • Exhibit 159: Oracle Corp. - Key news
              • Exhibit 160: Oracle Corp. - Key offerings
              • Exhibit 161: Oracle Corp. - Segment focus
            • 12.15 Salesforce Inc.
              • Exhibit 162: Salesforce Inc. - Overview
              • Exhibit 163: Salesforce Inc. - Product / Service
              • Exhibit 164: Salesforce Inc. - Key news
              • Exhibit 165: Salesforce Inc. - Key offerings
            • 12.16 SAP SE
              • Exhibit 166: SAP SE - Overview
              • Exhibit 167: SAP SE - Business segments
              • Exhibit 168: SAP SE - Key news
              • Exhibit 169: SAP SE - Key offerings
              • Exhibit 170: SAP SE - Segment focus
            • 12.17 Siemens AG
              • Exhibit 171: Siemens AG - Overview
              • Exhibit 172: Siemens AG - Business segments
              • Exhibit 173: Siemens AG - Key news
              • Exhibit 174: Siemens AG - Key offerings
              • Exhibit 175: Siemens AG - Segment focus

            13 Appendix

            • 13.1 Scope of the report
              • 13.2 Inclusions and exclusions checklist
                • Exhibit 176: Inclusions checklist
                • Exhibit 177: Exclusions checklist
              • 13.3 Currency conversion rates for US$
                • Exhibit 178: Currency conversion rates for US$
              • 13.4 Research methodology
                • Exhibit 179: Research methodology
                • Exhibit 180: Validation techniques employed for market sizing
                • Exhibit 181: Information sources
              • 13.5 List of abbreviations
                • Exhibit 182: List of abbreviations

              Research Methodology

              Technavio presents a detailed picture of the market by way of study, synthesis, and summation of data from multiple sources. The analysts have presented the various facets of the market with a particular focus on identifying the key industry influencers. The data thus presented is comprehensive, reliable, and the result of extensive research, both primary and secondary.

              INFORMATION SOURCES

              Primary sources

              • Manufacturers and suppliers
              • Channel partners
              • Industry experts
              • Strategic decision makers

              Secondary sources

              • Industry journals and periodicals
              • Government data
              • Financial reports of key industry players
              • Historical data
              • Press releases

              DATA ANALYSIS

              Data Synthesis

              • Collation of data
              • Estimation of key figures
              • Analysis of derived insights

              Data Validation

              • Triangulation with data models
              • Reference against proprietary databases
              • Corroboration with industry experts

              REPORT WRITING

              Qualitative

              • Market drivers
              • Market challenges
              • Market trends
              • Five forces analysis

              Quantitative

              • Market size and forecast
              • Market segmentation
              • Geographical insights
              • Competitive landscape

              Interested in this report?

              Get your sample now to see our research methodology and insights!

              Download Now

              Frequently Asked Questions

              Application Platform market growth will increase by $ 5.67 bn during 2024-2028 .

              The Application Platform market is expected to grow at a CAGR of 6.34% during 2024-2028 .

              Application Platform market is segmented by Deployment( On-premises, aPaaS) End-user( Large enterprises, SMEs, APAC, South America, Middle East and Africa)

              Adobe Inc., Alphabet Inc., Amazon.com Inc., Appian Corp., Betty Blocks BV, BMC Software Inc., Caucho Technology Inc, Cisco Systems Inc., GigaSpaces, Hewlett Packard Enterprise Co., Hitachi Ltd., International Business Machines Corp., Microsoft Corp., Open Text Corp., Oracle Corp., Salesforce Inc., SAP SE, Siemens AG, VANTIQ Inc., Wipro Ltd., Zerone Consulting Pvt. Ltd., Akamai Technologies Inc. are a few of the key vendors in the Application Platform market.

              North America will register the highest growth rate of 39% among the other regions. Therefore, the Application Platform market in North America is expected to garner significant business opportunities for the vendors during the forecast period.

              US, China, Australia, Germany, UK

              • Growing popularity of cloud-based servicesGlobally is the driving factor this market.
              • enterprises are focusing on reducing their overall capital expenditure (CAPEX) by adopting new technologies because building and running on-premises applications are complex is the driving factor this market.
              • expensive is the driving factor this market.
              • and slow processes. Traditionally is the driving factor this market.
              • each on-premises application requires hardware is the driving factor this market.
              • an OS is the driving factor this market.
              • a database is the driving factor this market.
              • middleware is the driving factor this market.
              • servers is the driving factor this market.
              • and other software. Therefore is the driving factor this market.
              • SMEs are adopting aPaaS solutions to help them adopt hardware is the driving factor this market.
              • middleware is the driving factor this market.
              • OS is the driving factor this market.
              • software is the driving factor this market.
              • and resources as and when required. Organizations require high CAPEX and OPEX to purchase and maintain all of them and to establish their own data centers. Hence is the driving factor this market.
              • they are adopting cloud platforms as they provide the following benefits: Cost shift from CAPEX to OPEX: Moving to the cloud reduces the CAPEX required for servers and related network equipment is the driving factor this market.
              • which significantly reduces the overall costs. Reduced setup and labor costs: Cloud service providers offer servers is the driving factor this market.
              • storage space is the driving factor this market.
              • and hardware. Hence is the driving factor this market.
              • organizations do not have to spend on data center setup is the driving factor this market.
              • and they need to pay only for the services used. Moreover is the driving factor this market.
              • labor costs are handled by cloud service providers is the driving factor this market.
              • and hence is the driving factor this market.
              • organizations are not required to hire dedicated staff. Reduced expansion cost: Cloud service providers can offer additional facilities is the driving factor this market.
              • such as disks is the driving factor this market.
              • central processing units (CPU) is the driving factor this market.
              • memory is the driving factor this market.
              • and communication lines is the driving factor this market.
              • possibly at lower costs. This provides organizations the flexibility in scaling up or down. Hence is the driving factor this market.
              • organizations need not build an IT infrastructure is the driving factor this market.
              • and the overall cost is reduced. Cloud-based solutions can easily integrate with any data is the driving factor this market.
              • which allows the creation of data-centric applications. This factor provides a new level of connected experience to application users is the driving factor this market.
              • thus giving them relevant is the driving factor this market.
              • contextual information in real-time. Therefore is the driving factor this market.
              • rather than depending on a specific web application development framework is the driving factor this market.
              • cloud-based solutions offer enterprises the benefit of using a single is the driving factor this market.
              • all-purpose development framework as per their need and pay per use. This helps to reduce the extra cost incurred to build different platforms and enables organizations to introduce applications or products in less time. Hence is the driving factor this market.
              • these factors will boost the growth of the global application platform market during the forecast period. is the driving factor this market.

              The Application Platform market vendors should focus on grabbing business opportunities from the On-premises segment as it accounted for the largest market share in the base year.