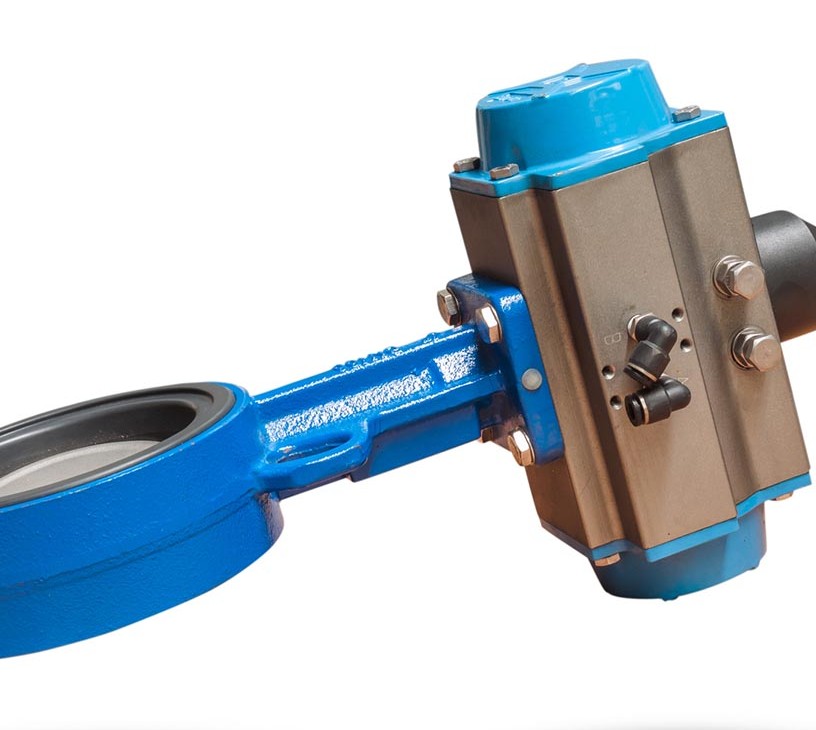
Butterfly Valve Market Size 2026-2030
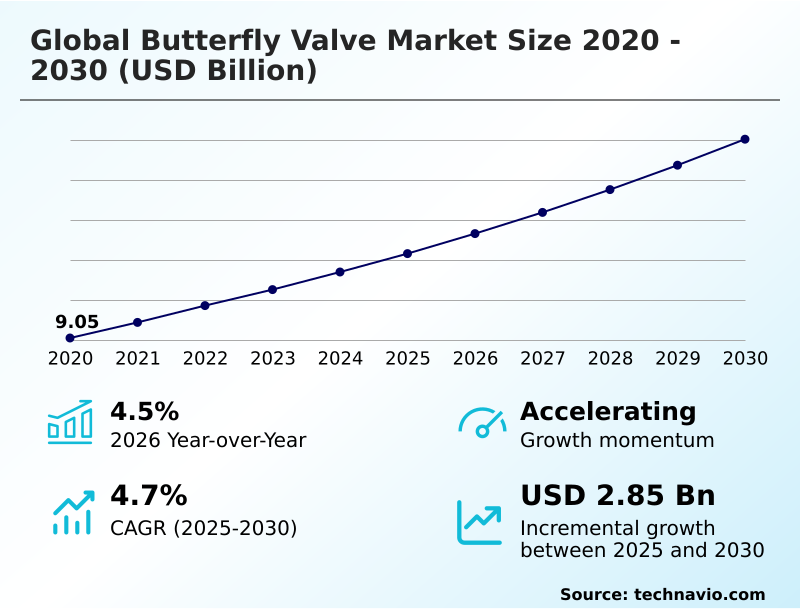
The butterfly valve market size is valued to increase by USD 2.85 billion, at a CAGR of 4.7% from 2025 to 2030. Increasing investment in water and wastewater infrastructure will drive the butterfly valve market.
Major Market Trends & Insights
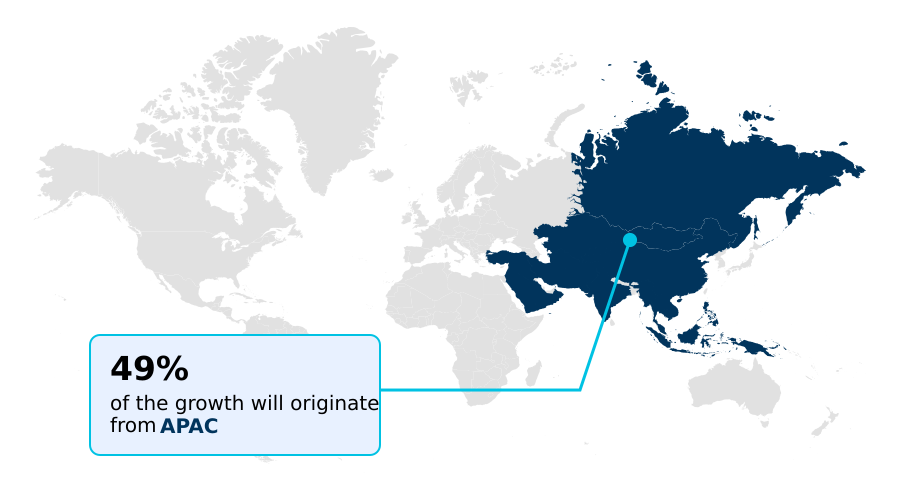
- APAC dominated the market and accounted for a 49.4% growth during the forecast period.
- By End-user - Oil and gas Industry segment was valued at in 2024
- By Product Type - Manual segment accounted for the largest market revenue share in 2024
Market Size & Forecast
- Market Opportunities: USD 4.97 billion
- Market Future Opportunities: USD 2.85 billion
- CAGR from 2025 to 2030 : 4.7%
Market Summary
- The butterfly valve market is experiencing sustained expansion, driven by industrial automation, infrastructure modernization, and a focus on process efficiency. In developing nations, rapid urbanization necessitates significant investment in water and wastewater management, creating massive demand for resilient seated butterfly valves and other foundational components in new greenfield projects. Concurrently, developed economies focus on MRO activities, upgrading aging networks with higher-performing solutions.
- The global energy transition creates dual opportunities, with demand for specialized cryogenic butterfly valves in LNG facilities and for nuclear-grade valves in new power plants. A key business scenario involves plant operators leveraging smart valve technology with intelligent valve positioners integrated into a distributed control system (DCS).
- This setup enables predictive maintenance strategies, where real-time data on performance metrics like operating torque is analyzed to anticipate failures. This shift from reactive to proactive maintenance minimizes unplanned downtime and extends asset life, showcasing how technological adoption addresses operational challenges while enhancing plant safety and efficiency across sectors.
What will be the Size of the Butterfly Valve Market during the forecast period?
Get Key Insights on Market Forecast (PDF) Get Free Sample
How is the Butterfly Valve Market Segmented?
The butterfly valve industry research report provides comprehensive data (region-wise segment analysis), with forecasts and estimates in "USD million" for the period 2026-2030, as well as historical data from 2020-2024 for the following segments.
- End-user
- Oil and gas industry
- Water and wastewater industry
- Power generation industry
- Chemical industry
- Others
- Product type
- Manual
- Electric-actuated
- Pneumatic-actuated
- Hydraulic-actuated
- Aircraft type
- High performance valves
- Lined valves
- Geography
- APAC
- China
- India
- Japan
- Europe
- Germany
- UK
- France
- North America
- US
- Canada
- Mexico
- South America
- Brazil
- Argentina
- Middle East and Africa
- Saudi Arabia
- UAE
- South Africa
- Rest of World (ROW)
- APAC
By End-user Insights
The oil and gas industry segment is estimated to witness significant growth during the forecast period.
The oil and gas industry is a principal end-user, with applications spanning upstream, midstream, and downstream sectors.
Here, high-performance butterfly valves, including severe service metal seated butterfly valves and cryogenic butterfly valves, are indispensable for managing crude oil, natural gas, and processed water under high pressure.
Demand is driven by new greenfield projects and continuous MRO activities at aging facilities. The increasing investment in LNG infrastructure, a key area for process optimization, necessitates specialized components capable of operating at extreme temperatures.
Adherence to standards like the API 607 and the use of smart valve actuators are critical for ensuring plant safety and environmental compliance, with advanced systems improving incident prevention by over 20%.
The reliance on components like a scotch yoke mechanism ensures reliable performance in severe service applications.
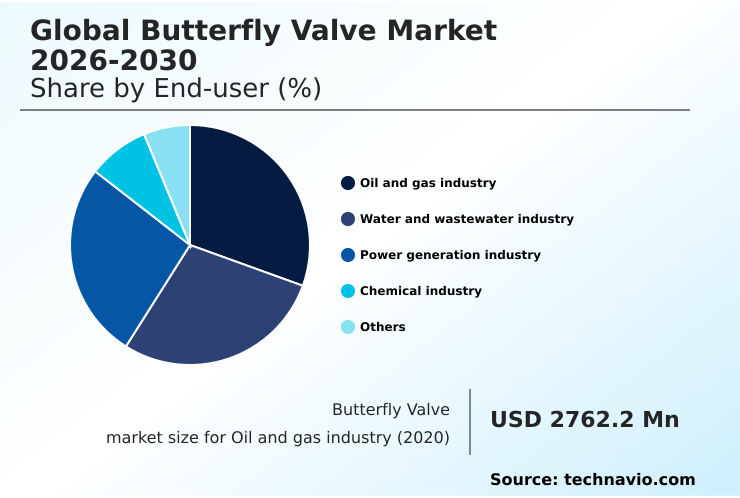
The Oil and gas industry segment was valued at in 2024 and showed a gradual increase during the forecast period.
Regional Analysis
APAC is estimated to contribute 49.4% to the growth of the global market during the forecast period.Technavio’s analysts have elaborately explained the regional trends and drivers that shape the market during the forecast period.
See How Butterfly Valve Market Demand is Rising in APAC Get Free Sample
The geographic landscape of the butterfly valve market is led by APAC, which is projected to have the highest market expansion, outpacing other regions with a growth rate of 5.0%.
This is fueled by extensive industrialization and large-scale infrastructure projects, especially in China and India. These greenfield projects create immense demand for a wide range of products, including standard slurry valves and components for variable flow HVAC systems.
In contrast, the markets in North America and Europe, growing at 4.1% and 4.8% respectively, are more mature and largely driven by MRO activities and technological upgrades.
These regions focus on retrofitting aging infrastructure with solutions that improve energy efficiency and meet stringent standards for environmental compliance, such as TA-Luft standard, ensuring robust demand for advanced, certified products.
Market Dynamics
Our researchers analyzed the data with 2025 as the base year, along with the key drivers, trends, and challenges. A holistic analysis of drivers will help companies refine their marketing strategies to gain a competitive advantage.
- Strategic butterfly valve selection for corrosive media is increasingly critical as industries push process boundaries, making the cost-benefit analysis of lined butterfly valves a common engineering exercise. For applications involving extreme conditions, such as the need for a triple offset valve for high temperature steam, achieving zero leakage is paramount for both safety and efficiency.
- This contrasts with less critical applications where a high performance vs resilient seated butterfly valve comparison favors the latter on a cost basis. The integration of digital technologies enables predictive maintenance for smart butterfly valves, where data from electric actuator integration with DCS helps anticipate failures, reducing downtime by over 40% compared to reactive measures.
- In specialized sectors, the choice of a cryogenic butterfly valve for LNG applications is non-negotiable, while butterfly valve compliance with API 607 is mandatory for fire-safe services. For infrastructure, adherence to AWWA C504 for municipal water systems and the proper use of butterfly valves for HVAC hydronic balancing ensure system integrity and efficiency.
- Similarly, the correct pneumatic actuator sizing for emergency shutdown is a core safety requirement in automated systems, demanding precise butterfly valve torque calculation for high pressure scenarios.
What are the key market drivers leading to the rise in the adoption of Butterfly Valve Industry?
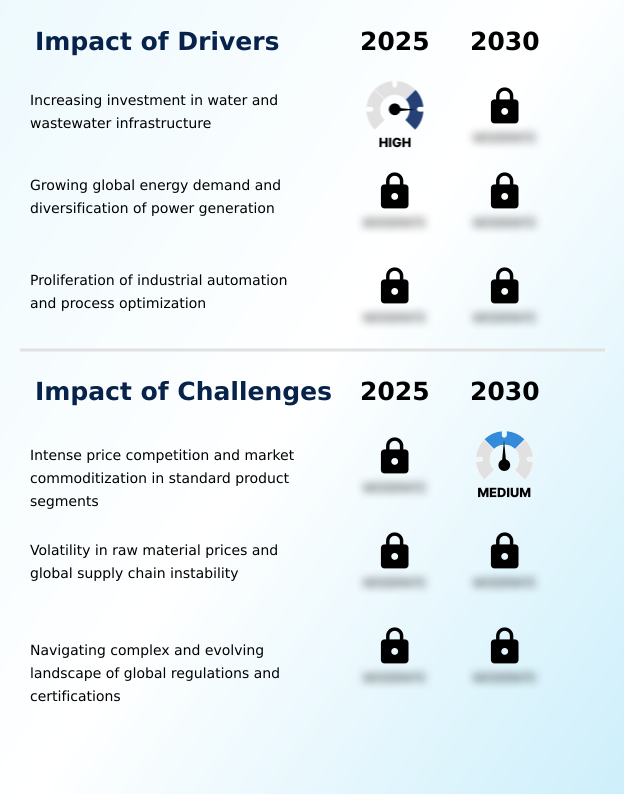
- Increasing investment in water and wastewater infrastructure worldwide serves as a key driver for market growth.
- Sustained market growth is propelled by significant investments in infrastructure and the global push for industrial automation. In the water sector, both greenfield projects in emerging economies and brownfield projects modernizing aging networks in developed regions create constant demand.
- These initiatives often require AWWA C504 compliant valves and advanced oxidation processes, where precise flow control is critical.
- In the energy sector, the demand for LNG is fueling the construction of facilities requiring specialized components, including those compliant with the ASME Boiler and Pressure Vessel Code.
- The drive for process optimization across all industries is increasing the adoption of automated systems, with facilities reporting a 20% increase in production throughput after upgrading.
- This focus on efficiency and plant safety underpins the stable, long-term demand for both standard and high-performance valves.
What are the market trends shaping the Butterfly Valve Industry?
- A defining trend is the ascent of intelligent valve technologies. This includes deeper digital integration for enhanced process control and predictive maintenance capabilities.
- A defining trend is the shift toward intelligent systems, where the integration of digital technologies is transforming flow control. Smart valve technology, a core tenet of Industry 4.0 principles, enables condition-based monitoring and enhances operational excellence. The adoption of these systems allows for a 30% reduction in unplanned downtime by enabling proactive interventions.
- End-users are increasingly focused on total cost of ownership, driving demand for high-performance solutions in severe service applications. This movement is supported by asset management software and data-driven decision making, ensuring that investments in advanced components like a PFA-lined valves and those with a high flow coefficient (Cv) deliver measurable returns, improving process quality by up to 15%.
- This trend also supports stricter environmental compliance.
What challenges does the Butterfly Valve Industry face during its growth?
- A key challenge affecting industry growth is the intense price competition and market commoditization within standard product segments.
- A persistent challenge is navigating the dual pressures of market commoditization and raw material price volatility. In standard segments, intense price competition can erode margins, making it difficult for manufacturers to invest in innovation. This situation is compounded by supply chain instability, which can lead to material shortages and production delays, impacting project timelines by up to 10%.
- Furthermore, manufacturers face a complex web of regulations, including the ATEX directive, Pressure Equipment Directive (PED), and standards like ISO 15848-1 for fugitive emissions. Achieving and maintaining these certifications requires significant investment in quality control and documentation, adding costs that are difficult to recover in a price-sensitive market.
- These factors create an environment where operational efficiency is not just a goal but a necessity for survival.
Exclusive Technavio Analysis on Customer Landscape
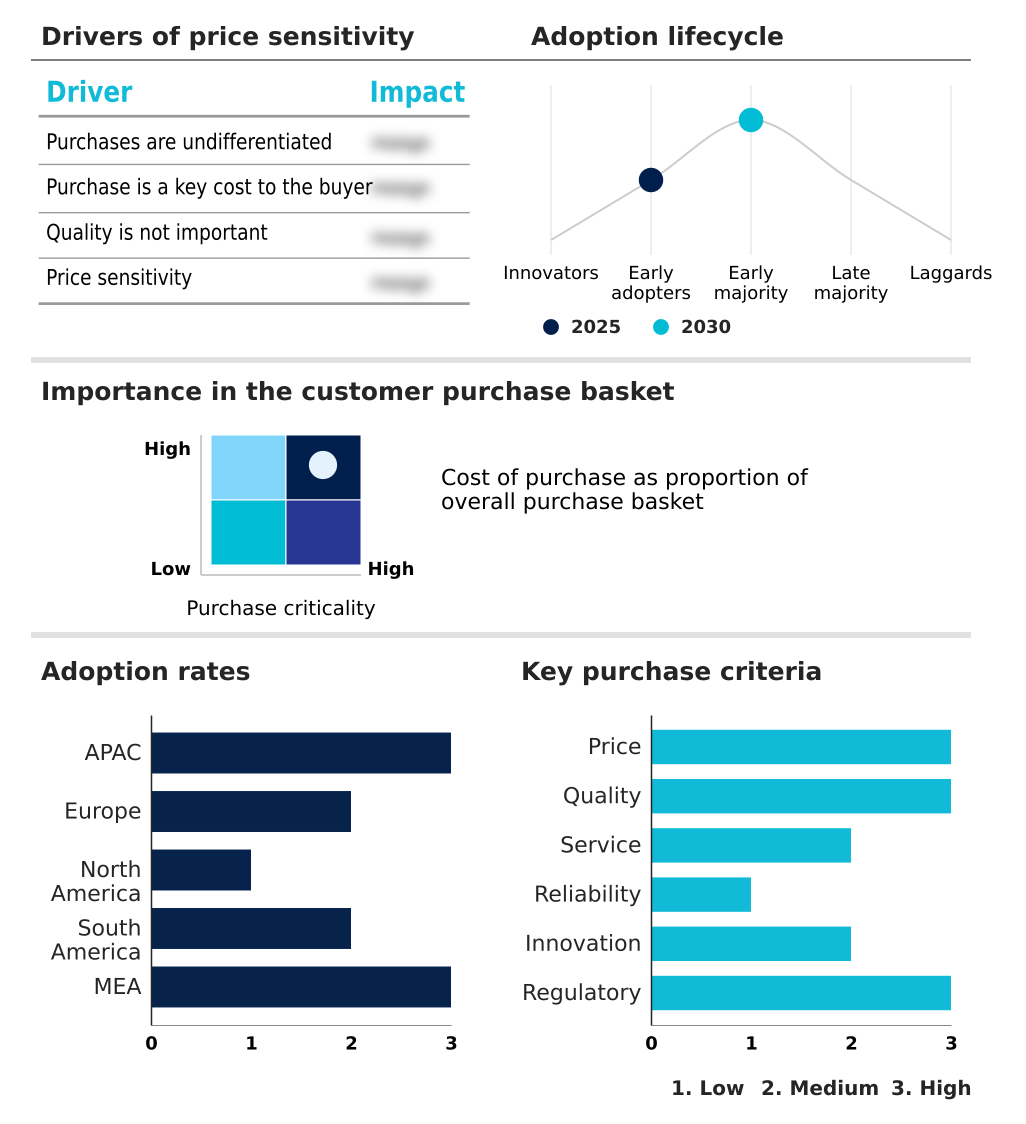
The butterfly valve market forecasting report includes the adoption lifecycle of the market, covering from the innovator’s stage to the laggard’s stage. It focuses on adoption rates in different regions based on penetration. Furthermore, the butterfly valve market report also includes key purchase criteria and drivers of price sensitivity to help companies evaluate and develop their market growth analysis strategies.
Customer Landscape of Butterfly Valve Industry
Competitive Landscape
Companies are implementing various strategies, such as strategic alliances, butterfly valve market forecast, partnerships, mergers and acquisitions, geographical expansion, and product/service launches, to enhance their presence in the industry.
Alfa Laval AB - A diverse portfolio features concentric, double-offset, and large-diameter butterfly valves, targeting both waterworks and demanding high-performance industrial applications.
The industry research and growth report includes detailed analyses of the competitive landscape of the market and information about key companies, including:
- Alfa Laval AB
- AVK Holding AS
- Bray International Inc.
- Christian Burkert GmbH and Co.
- Crane Company
- Curtiss Wright Corp.
- Dembla Valves Ltd.
- Emerson Electric Co.
- Festo SE and Co. KG
- Flowserve Corp.
- Georg Fischer Ltd.
- Hobbs Valve Ltd.
- Honeywell International Inc.
- KITZ Corp.
- KSB SE and Co. KGaA
- Larsen and Toubro Ltd.
- Schlumberger Ltd.
- The Weir Group Plc
- Valmet Corp.
- Velan Inc.
Qualitative and quantitative analysis of companies has been conducted to help clients understand the wider business environment as well as the strengths and weaknesses of key industry players. Data is qualitatively analyzed to categorize companies as pure play, category-focused, industry-focused, and diversified; it is quantitatively analyzed to categorize companies as dominant, leading, strong, tentative, and weak.
Recent Development and News in Butterfly valve market
- In October 2024, the Canadian Nuclear Safety Commission (CNSC) completed its Phase 2 pre-licensing design review for a new grid-scale Small Modular Reactor (SMR), a critical step toward the construction and deployment of SMRs that will create recurring demand for nuclear-certified high-performance butterfly valves.
- In November 2024, the European Commission introduced new mandatory requirements for automated hydronic balancing in non-residential buildings under its Energy Performance of Buildings Directive (EPBD), directly catalyzing demand for actuated butterfly valves integrated with building management systems.
- In April 2025, BASF announced the full mechanical completion of new ethylene oxide and derivatives plants at its Verbund site in Zhanjiang, China, a milestone marking the installation of tens of thousands of butterfly valves, from general service models to specialized, corrosion-resistant lined valves.
- In May 2025, the East African Crude Oil Pipeline (EACOP) project is expected to complete principal civil works for its pumping stations and terminals, a phase requiring thousands of manually operated butterfly valves for ancillary systems like water treatment and firewater, highlighting their continued relevance in major infrastructure.
Dive into Technavio’s robust research methodology, blending expert interviews, extensive data synthesis, and validated models for unparalleled Butterfly Valve Market insights. See full methodology.
| Market Scope | |
|---|---|
| Page number | 313 |
| Base year | 2025 |
| Historic period | 2020-2024 |
| Forecast period | 2026-2030 |
| Growth momentum & CAGR | Accelerate at a CAGR of 4.7% |
| Market growth 2026-2030 | USD 2853.9 million |
| Market structure | Fragmented |
| YoY growth 2025-2026(%) | 4.5% |
| Key countries | China, India, Japan, South Korea, Australia, Indonesia, Germany, UK, France, Italy, Spain, The Netherlands, US, Canada, Mexico, Brazil, Argentina, Chile, Saudi Arabia, UAE, South Africa, Israel and Turkey |
| Competitive landscape | Leading Companies, Market Positioning of Companies, Competitive Strategies, and Industry Risks |
Research Analyst Overview
- The butterfly valve market is evolving from a components-based industry to a solutions-oriented one, driven by the need for enhanced process control and operational intelligence. A central element of this shift is the widespread adoption of electric-actuated butterfly valves and pneumatic-actuated butterfly valves equipped with intelligent valve positioners and smart valve actuators.
- These devices, communicating via protocols like HART protocol, Profibus, or Foundation Fieldbus, integrate seamlessly with a plant's distributed control system (DCS), transforming a simple mechanical device into a data-generating node. This capability supports the move toward predictive maintenance, a boardroom-level strategic decision that prioritizes long-term operational expenditure reduction over short-term capital savings.
- The use of high-performance designs, such as double offset high performance butterfly valves and triple offset butterfly valves with zero leakage shutoff, is becoming standard in severe service applications. Plants implementing these advanced systems have reported up to a 20% improvement in energy efficiency due to lower operating torque and optimized flow control.
What are the Key Data Covered in this Butterfly Valve Market Research and Growth Report?
-
What is the expected growth of the Butterfly Valve Market between 2026 and 2030?
-
USD 2.85 billion, at a CAGR of 4.7%
-
-
What segmentation does the market report cover?
-
The report is segmented by End-user (Oil and gas Industry, Water and wastewater industry, Power generation industry, Chemical industry, and Others), Product Type (Manual, Electric-actuated, Pneumatic-actuated, and Hydraulic-actuated), Aircraft Type (High performance valves, and Lined valves) and Geography (APAC, Europe, North America, South America, Middle East and Africa)
-
-
Which regions are analyzed in the report?
-
APAC, Europe, North America, South America and Middle East and Africa
-
-
What are the key growth drivers and market challenges?
-
Increasing investment in water and wastewater infrastructure, Intense price competition and market commoditization in standard product segments
-
-
Who are the major players in the Butterfly Valve Market?
-
Alfa Laval AB, AVK Holding AS, Bray International Inc., Christian Burkert GmbH and Co., Crane Company, Curtiss Wright Corp., Dembla Valves Ltd., Emerson Electric Co., Festo SE and Co. KG, Flowserve Corp., Georg Fischer Ltd., Hobbs Valve Ltd., Honeywell International Inc., KITZ Corp., KSB SE and Co. KGaA, Larsen and Toubro Ltd., Schlumberger Ltd., The Weir Group Plc, Valmet Corp. and Velan Inc.
-
Market Research Insights
- Market dynamics are shaped by a strategic push toward industrial automation and data-driven decision making, where the adoption of intelligent systems can improve process efficiency by over 15%. While market commoditization exerts downward price pressure on standard components, end-users are increasingly focused on total cost of ownership, driving demand for high-value solutions.
- The integration of valves with asset management software enables condition-based monitoring, which has been shown to reduce unscheduled downtime by as much as 25% compared to traditional maintenance schedules.
- This emphasis on operational excellence and plant safety fosters a competitive environment where advanced features and long-term reliability outweigh initial acquisition costs in critical process control scenarios, especially in severe service applications.
We can help! Our analysts can customize this butterfly valve market research report to meet your requirements.
 RIA -
RIA - 
