Cable Assembly Market Size 2026-2030
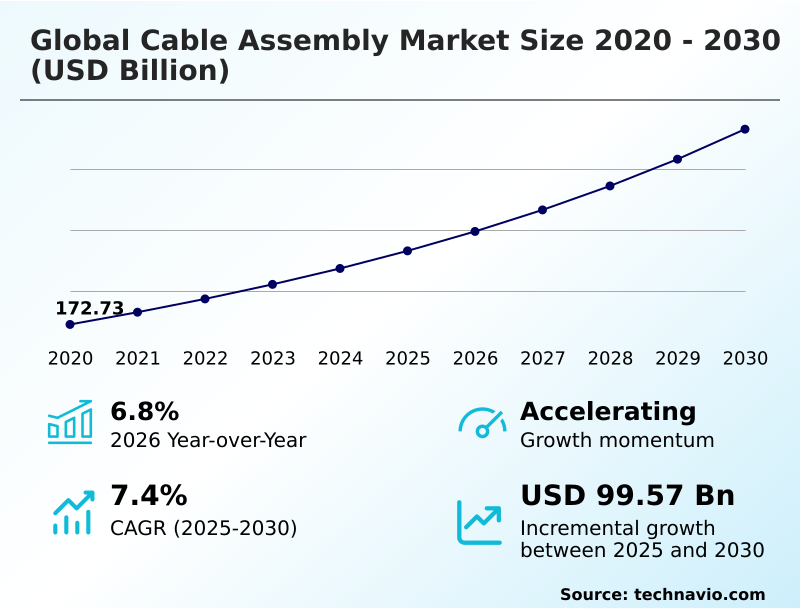
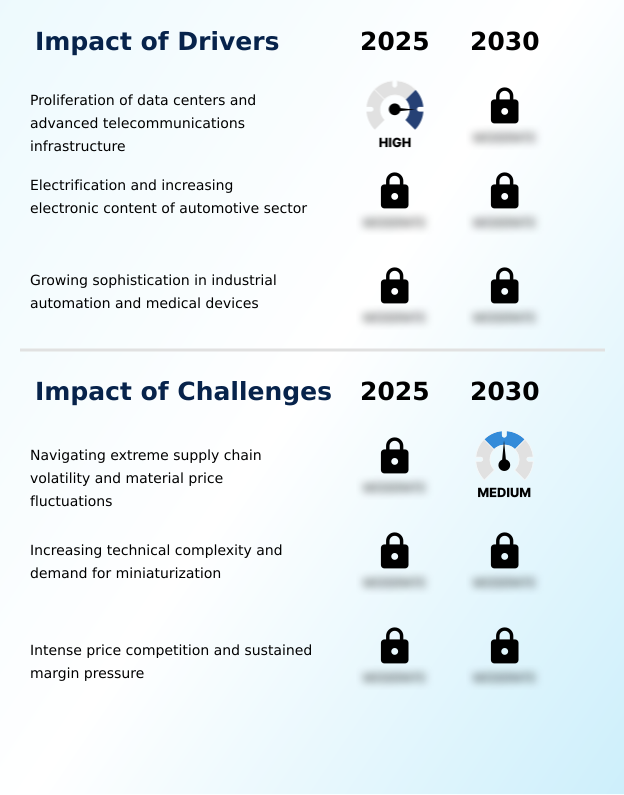
The cable assembly market size is valued to increase by USD 99.57 billion, at a CAGR of 7.4% from 2025 to 2030. Proliferation of data centers and advanced telecommunications infrastructure will drive the cable assembly market.
Major Market Trends & Insights
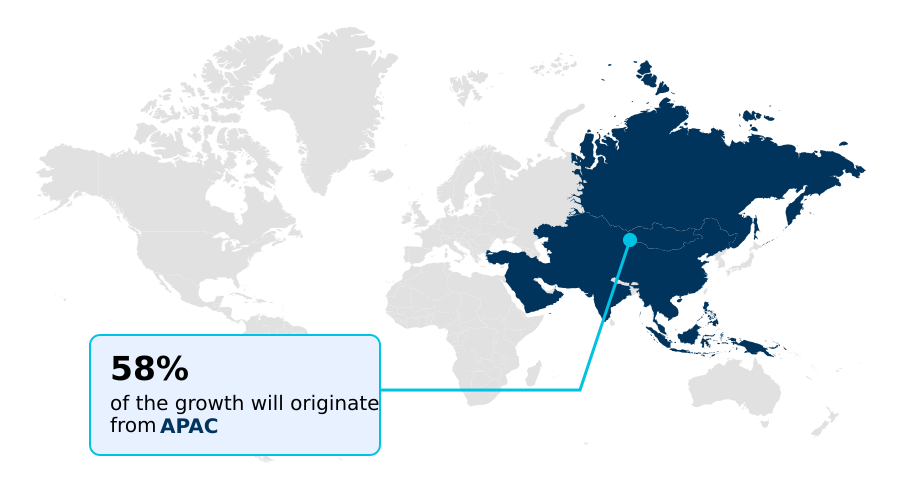
- APAC dominated the market and accounted for a 57.8% growth during the forecast period.
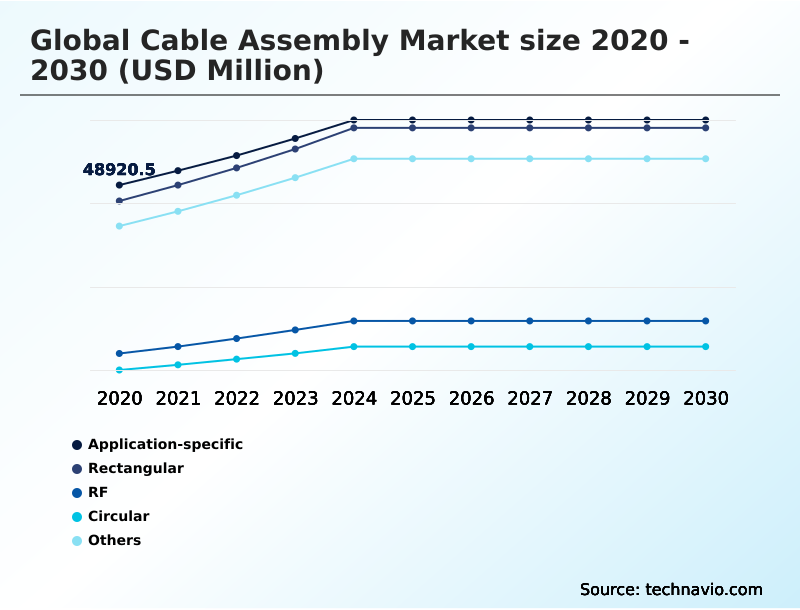
- By Product - Application-specific segment was valued at USD 60.32 billion in 2024
- By Application - Automotive segment accounted for the largest market revenue share in 2024
Market Size & Forecast
- Market Opportunities: USD 159.76 billion
- Market Future Opportunities: USD 99.57 billion
- CAGR from 2025 to 2030 : 7.4%
Market Summary
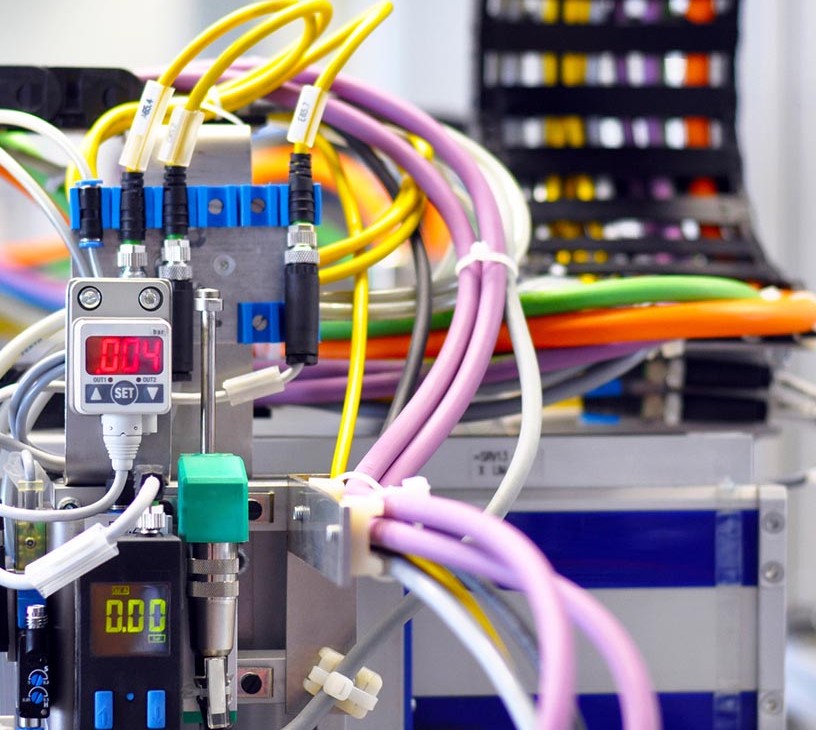
- The Cable Assembly Market is integral to modern technological infrastructure, facilitating essential power and data transmission across diverse sectors. Growth is fundamentally linked to the electrification of the automotive industry and the expansion of digital ecosystems. The transition to electric vehicles creates substantial demand for complex automotive wiring harnesses and specialized high-voltage EV cabling.
- Concurrently, the build-out of 5G networks and hyperscale data centers fuels a need for advanced fiber optic interconnects and high-speed data cables to manage ever-increasing bandwidth. In the industrial realm, the push toward smart factory automation necessitates durable industrial ethernet cables and robotic high-flex cables that can withstand harsh operating environments.
- Innovation focuses on enhancing performance through improved electromagnetic interference shielding and signal integrity analysis. However, the industry grapples with the technical challenges of miniaturization, as devices require smaller yet more powerful sealed interconnect systems.
- For instance, a medical device firm must balance the need for biocompatible jacketing in sterilizable medical assemblies with achieving fine-pitch termination in a compact design, a process that can increase R&D costs significantly while navigating volatile material prices. The market's trajectory is defined by this interplay between technological advancement and operational pressures.
What will be the Size of the Cable Assembly Market during the forecast period?
Get Key Insights on Market Forecast (PDF) Get Free Sample
How is the Cable Assembly Market Segmented?
The cable assembly industry research report provides comprehensive data (region-wise segment analysis), with forecasts and estimates in "USD million" for the period 2026-2030, as well as historical data from 2020-2024 for the following segments.
- Product
- Application-specific
- Rectangular
- RF
- Circular
- Others
- Application
- Automotive
- Consumer electronics
- Telecom and datacom
- Industrial
- Others
- Variant
- High-speed cable assembly
- Data cable assembly
- Conventional cable assembly
- Type
- Coaxial cable
- Custom cable
- Discrete wire
- Flat ribbon cable
- Others
- Geography
- APAC
- China
- Japan
- India
- North America
- US
- Canada
- Mexico
- Europe
- Germany
- UK
- France
- Middle East and Africa
- Saudi Arabia
- UAE
- South Africa
- South America
- Brazil
- Argentina
- Rest of World (ROW)
- APAC
By Product Insights
The application-specific segment is estimated to witness significant growth during the forecast period.
The application-specific segment is a value-driven area focused on custom-engineered interconnects for sectors where standard products are insufficient. Growth stems from increasing complexity in critical industries.
For example, aerospace-grade interconnects for avionics control systems and satellite communication links require flawless performance under extreme conditions.
Similarly, the medical device cable solutions field demands specialized products for patient monitoring equipment and surgical robotics systems, often featuring biocompatible jacketing and harsh environment sealing. These custom molded assemblies undergo rigorous signal integrity analysis to ensure reliability.
Innovations include hybrid power and data cables for unmanned aerial vehicle (UAV) wiring, where optimizing for weight and function improves flight endurance by over 15%. This segment's collaborative design process ensures perfect system integration for applications like geophysical exploration equipment.
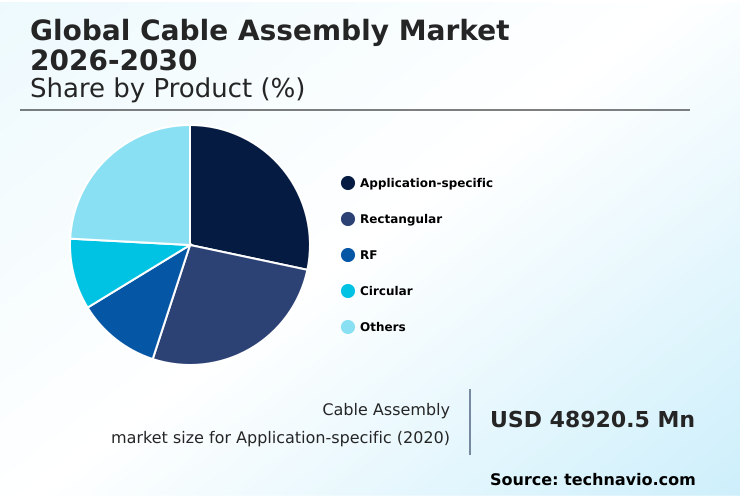
The Application-specific segment was valued at USD 60.32 billion in 2024 and showed a gradual increase during the forecast period.
Regional Analysis
APAC is estimated to contribute 57.8% to the growth of the global market during the forecast period.Technavio’s analysts have elaborately explained the regional trends and drivers that shape the market during the forecast period.
See How Cable Assembly Market Demand is Rising in APAC Get Free Sample
The geographic landscape is dominated by APAC, which serves as both the primary manufacturing hub and a massive consumer market, accounting for over 57% of incremental growth.
Countries like China and South Korea drive demand for high-volume fiber optic interconnects and components for consumer electronics. In North America and Europe, the focus is on high-value applications.
North America's market is propelled by aerospace, requiring advanced RF and microwave assemblies for avionics control systems, and a booming high-performance computing (HPC) sector demanding sophisticated data center structured cabling.
Europe's strong industrial automation base requires specialized industrial control wiring, while its medical technology sector creates demand for sterilizable medical assemblies.
Investment in renewable energy installations and telecom backhaul fiber is a common growth factor across all developed regions, including applications in broadcast and pro-AV solutions.
Market Dynamics
Our researchers analyzed the data with 2025 as the base year, along with the key drivers, trends, and challenges. A holistic analysis of drivers will help companies refine their marketing strategies to gain a competitive advantage.
- The demand for specialized interconnects is diversifying across high-stakes industries, moving beyond standard offerings to highly engineered solutions. For instance, the need for a high-flex life cable for industrial robotics is now a baseline requirement in automated manufacturing.
- In the automotive sector, the development of liquid-cooled high-voltage EV cable assemblies and automotive ethernet cable for ADAS sensors is critical for next-generation vehicle platforms, while high-temperature cables for engine compartments remain essential.
- The data center industry is pushing boundaries with the adoption of the 800g active optical cable for data centers and pluggable optical transceivers for networking to handle immense data loads. Defense and aerospace applications require mil-spec circular connectors for defense and lightweight yet durable space-grade composite cable assemblies and lightweight aircraft wiring solutions.
- Medical technology advancements rely on biocompatible catheter cable assemblies and non-magnetic connectors for MRI systems. Increasingly, custom overmolded cable for medical devices and the use of a flexible printed circuit for wearables are becoming standard. Harsh environments drive demand for ruggedized fiber optic cable for mining and hermetically sealed connectors for aerospace.
- For network infrastructure, low PIM RF assemblies for 5G antennas are critical for signal purity, while the adoption of single-pair ethernet for industrial IoT simplifies connectivity at the network edge.
- These custom solutions improve system reliability, with a client in the mining sector reporting that implementing ruggedized fiber reduced network downtime by a factor of three compared to their previous, less durable infrastructure.
- The move toward zonal architecture wiring for vehicles and the use of high-density connectors for PCB design and EMI shielded cables for sensitive electronics underscores the trend toward integrated, high-performance systems.
What are the key market drivers leading to the rise in the adoption of Cable Assembly Industry?
- A primary market driver is the proliferation of data centers and the deployment of advanced telecommunications infrastructure, creating sustained demand for high-performance connectivity.
- Key drivers are the transformations in the automotive and industrial sectors. The shift toward the electric vehicle (EV) powertrain fuels demand for specialized high-voltage EV cabling and sophisticated automotive wiring harnesses.
- The adoption of a zonal electrical architecture can reduce harness weight by up to 30%, simplifying manufacturing. Advanced in-vehicle networking is crucial for advanced driver-assistance systems (ADAS), which rely on flawless data transmission.
- In parallel, industry 4.0 connectivity is reshaping manufacturing through smart factory automation. This requires durable industrial ethernet cables and robotic high-flex cables for autonomous mobile robots (AMRs) and machine vision systems.
- The use of power-over-ethernet cabling in these environments can lower installation costs by 20% compared to separate power and data lines.
What are the market trends shaping the Cable Assembly Industry?
- A key market trend is the accelerated move toward miniaturization, driving demand for increasingly compact high-density interconnects across a broad spectrum of industries.
- The market is rapidly evolving toward miniaturization and higher bandwidth to support data-intensive ecosystems. The proliferation of internet of things (IoT) devices and wearable medical sensors necessitates miniature flexible circuits with fine-pitch termination. In consumer electronics, augmented reality hardware relies on high-density interconnects and advanced board-to-board connectors for compact designs.
- For hyperscale data center interconnects, the migration to faster speeds is driving adoption of active optical cables and direct attach copper cables, with some facilities achieving a 25% reduction in link power consumption. The build-out of 5G network infrastructure is also a significant factor, demanding high-performance high-speed data cables.
- This innovation cycle, even extending to tools like semiconductor fabrication tools, improves system efficiency by over 20% in some applications.
What challenges does the Cable Assembly Industry face during its growth?
- A significant industry challenge involves navigating extreme supply chain volatility and raw material price fluctuations, which exerts sustained pressure on manufacturing costs and profit margins.
- Navigating technical complexity and supply chain volatility presents significant challenges. The need for smaller, more intricate designs like lightweight composite cables and sealed interconnect systems increases manufacturing costs and requires continuous R&D investment.
- In applications such as railway signaling systems and smart grid sensor networks, robust electromagnetic interference shielding is non-negotiable, and sourcing specialized materials can lead to lead times 40% longer than standard components. Compliance with strict standards for low-smoke zero-halogen cables and plenum-rated cabling in building automation systems adds complexity.
- Furthermore, intense price competition for commoditized products like standard coaxial cable assemblies used in point-of-sale (POS) terminals squeezes profit margins, which have fallen by nearly 5% in some high-volume segments. Even components like overmolded strain relief are under cost pressure.
Exclusive Technavio Analysis on Customer Landscape
The cable assembly market forecasting report includes the adoption lifecycle of the market, covering from the innovator’s stage to the laggard’s stage. It focuses on adoption rates in different regions based on penetration. Furthermore, the cable assembly market report also includes key purchase criteria and drivers of price sensitivity to help companies evaluate and develop their market growth analysis strategies.
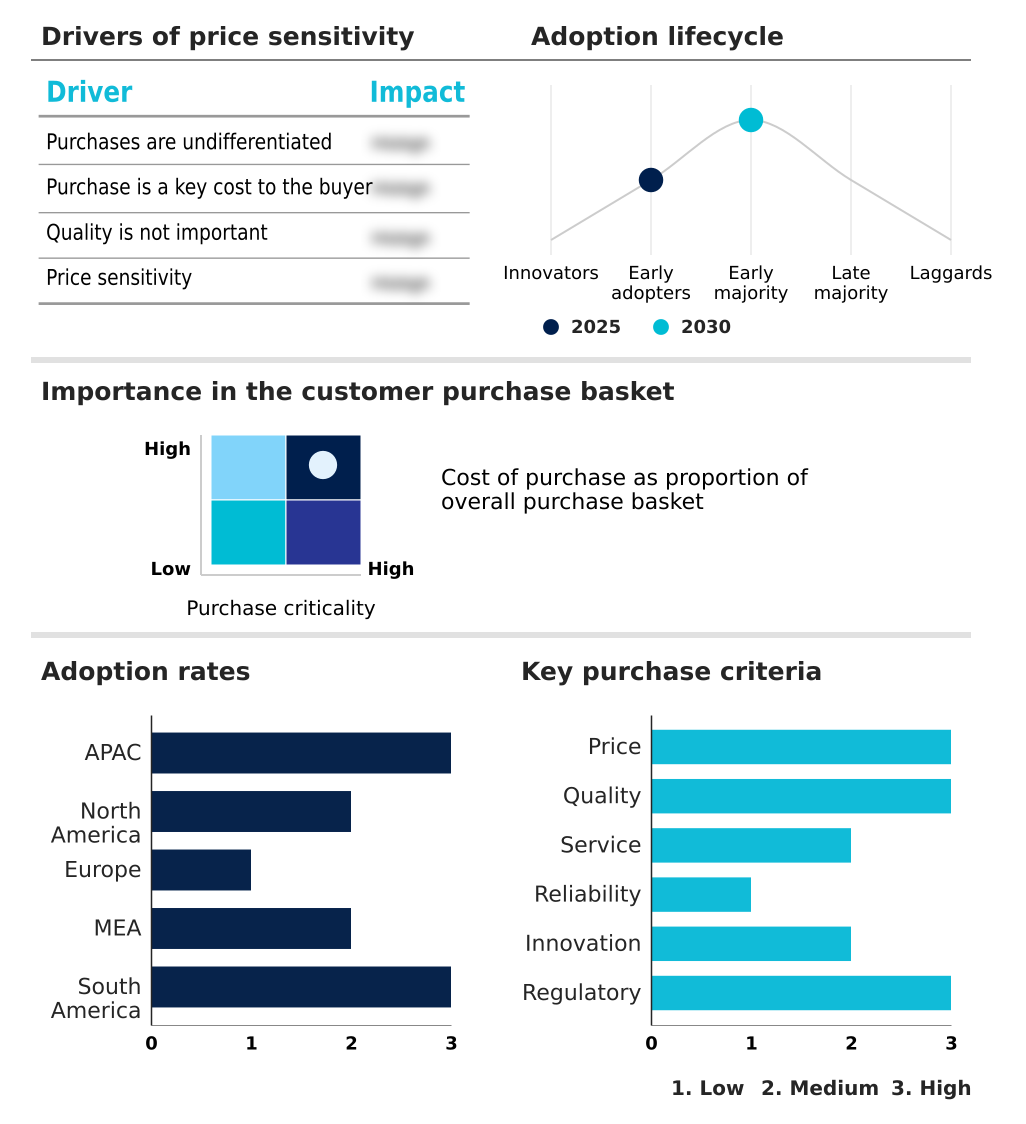
Customer Landscape of Cable Assembly Industry
Competitive Landscape
Companies are implementing various strategies, such as strategic alliances, cable assembly market forecast, partnerships, mergers and acquisitions, geographical expansion, and product/service launches, to enhance their presence in the industry.
3M Co. - Delivering high-performance interconnect solutions, including custom harnesses and connectors, engineered for high-reliability signal and power transmission across critical applications.
The industry research and growth report includes detailed analyses of the competitive landscape of the market and information about key companies, including:
- 3M Co.
- Amphenol Corp.
- Aptiv Plc
- BizLink Holding Inc.
- Cablecraft Motion Controls LLC
- Carlisle Companies Inc.
- Carrio Cabling Corp.
- Copartner Tech Corp.
- Corning Inc.
- Fischer Connectors Holding SA
- JAE Industry Ltd.
- Minnesota Wire and Cable Co.
- Nexans SA
- NKT AS
- Prysmian SpA
- Samtec Inc.
- Smiths Group Plc
- W. L. Gore and Associates
Qualitative and quantitative analysis of companies has been conducted to help clients understand the wider business environment as well as the strengths and weaknesses of key industry players. Data is qualitatively analyzed to categorize companies as pure play, category-focused, industry-focused, and diversified; it is quantitatively analyzed to categorize companies as dominant, leading, strong, tentative, and weak.
Recent Development and News in Cable assembly market
- In May 2025, the Institute of Electrical and Electronics Engineers (IEEE) ratified the 802.3df standard, establishing technical specifications for 1.6 Terabit per second Ethernet and mandating next-generation co-packaged optics.
- In August 2025, the International Electronics Consortium ratified the Nano-Pitch 2.0 standard, mandating reduced connector height and increased pin density for internal board-to-board connectors in portable devices.
- In September 2025, Nokia Networks unveiled its next-generation AirScale 6G-Ready base station platform, which requires a new class of ruggedized, high-density hybrid cable assemblies for its advanced antenna arrays.
- In October 2025, the Volkswagen Group issued a new global standard for its upcoming electric vehicle platform, mandating the use of liquid-cooled high-voltage cable assemblies to enhance thermal management.
Dive into Technavio’s robust research methodology, blending expert interviews, extensive data synthesis, and validated models for unparalleled Cable Assembly Market insights. See full methodology.
| Market Scope | |
|---|---|
| Page number | 335 |
| Base year | 2025 |
| Historic period | 2020-2024 |
| Forecast period | 2026-2030 |
| Growth momentum & CAGR | Accelerate at a CAGR of 7.4% |
| Market growth 2026-2030 | USD 99569.9 million |
| Market structure | Fragmented |
| YoY growth 2025-2026(%) | 6.8% |
| Key countries | China, Japan, India, South Korea, Vietnam, Indonesia, US, Canada, Mexico, Germany, UK, France, Italy, Spain, The Netherlands, Saudi Arabia, UAE, South Africa, Israel, Turkey, Brazil, Argentina and Chile |
| Competitive landscape | Leading Companies, Market Positioning of Companies, Competitive Strategies, and Industry Risks |
Research Analyst Overview
- The market is defined by a persistent push for higher performance and specialization. Demand for high-speed data cables, including active optical cables and direct attach copper cables, is driven by the expansion of data center structured cabling. The automotive sector requires advanced automotive wiring harnesses and high-voltage EV cabling, with zonal electrical architecture and in-vehicle networking as key design principles.
- Industrial settings rely on robotic high-flex cables, industrial control wiring, and industrial ethernet cables, often using power-over-ethernet cabling. For boardroom strategy, miniaturization is a critical trend, impacting everything from medical device cable solutions to miniature flexible circuits and custom molded assemblies. Investing in fine-pitch termination and high-density interconnects is a strategic imperative.
- This decision affects capital expenditure, as achieving robust signal integrity analysis for compact board-to-board connectors can increase quality assurance budgets by over 20%.
- From coaxial cable assemblies and RF and microwave assemblies to hybrid power and data cables with biocompatible jacketing or lightweight composite cables, innovation is centered on reliability, requiring superior electromagnetic interference shielding and harsh environment sealing in sealed interconnect systems. Compliance also drives demand for low-smoke zero-halogen cables and plenum-rated cabling.
What are the Key Data Covered in this Cable Assembly Market Research and Growth Report?
-
What is the expected growth of the Cable Assembly Market between 2026 and 2030?
-
USD 99.57 billion, at a CAGR of 7.4%
-
-
What segmentation does the market report cover?
-
The report is segmented by Product (Application-specific, Rectangular, RF, Circular, and Others), Application (Automotive, Telecom and datacom, Consumer electronics, Industrial, and Others), Variant (High-speed cable assembly, Data cable assembly, and Conventional cable assembly), Type (Coaxial cable, Custom cable, Discrete wire, Flat ribbon cable, and Others) and Geography (APAC, North America, Europe, Middle East and Africa, South America)
-
-
Which regions are analyzed in the report?
-
APAC, North America, Europe, Middle East and Africa and South America
-
-
What are the key growth drivers and market challenges?
-
Proliferation of data centers and advanced telecommunications infrastructure, Navigating extreme supply chain volatility and material price fluctuations
-
-
Who are the major players in the Cable Assembly Market?
-
3M Co., Amphenol Corp., Aptiv Plc, BizLink Holding Inc., Cablecraft Motion Controls LLC, Carlisle Companies Inc., Carrio Cabling Corp., Copartner Tech Corp., Corning Inc., Fischer Connectors Holding SA, JAE Industry Ltd., Minnesota Wire and Cable Co., Nexans SA, NKT AS, Prysmian SpA, Samtec Inc., Smiths Group Plc and W. L. Gore and Associates
-
Market Research Insights
- The market's dynamics are shaped by technological advancements in key end-use sectors. The expansion of 5G network infrastructure and hyperscale data center interconnects creates a sustained need for high-bandwidth solutions. In the automotive sector, the integration of advanced driver-assistance systems (ADAS) relies on high-speed connectivity, with some architectures reducing data latency by over 40% compared to legacy systems.
- Industry 4.0 connectivity is another critical factor, where smart factory automation and machine vision systems demand robust, reliable cabling. The deployment of custom interconnects in surgical robotics systems has been shown to improve procedural accuracy by up to 15%.
- This demand for specialized, high-performance assemblies for applications ranging from electric vehicle (EV) powertrain systems to satellite communication links highlights a shift toward value-added, engineered solutions that deliver measurable performance gains.
We can help! Our analysts can customize this cable assembly market research report to meet your requirements.
 RIA -
RIA - 
