Cable Tray Market Size 2025-2029
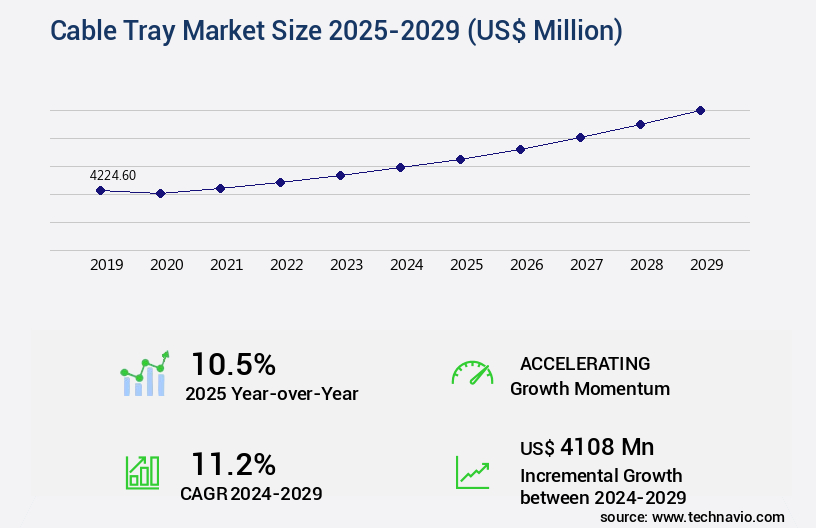
The cable tray market size is valued to increase by USD 4.11 billion, at a CAGR of 11.2% from 2024 to 2029. Growing infrastructure development will drive the cable tray market.
Major Market Trends & Insights
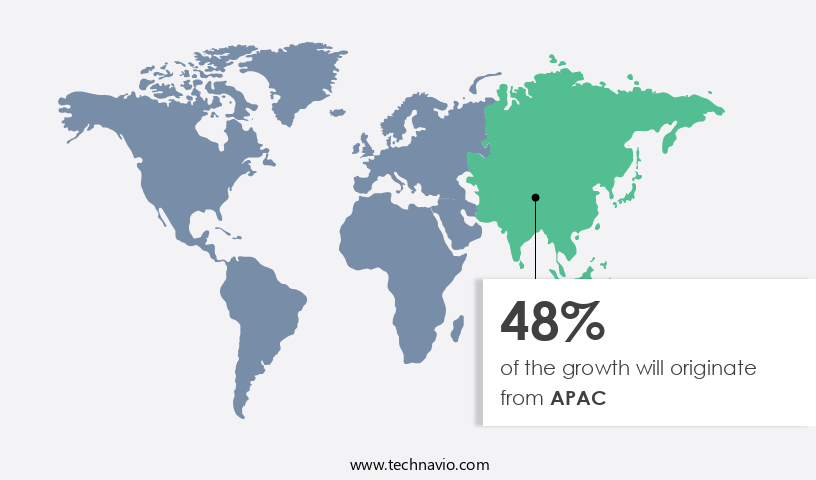
- APAC dominated the market and accounted for a 48% growth during the forecast period.
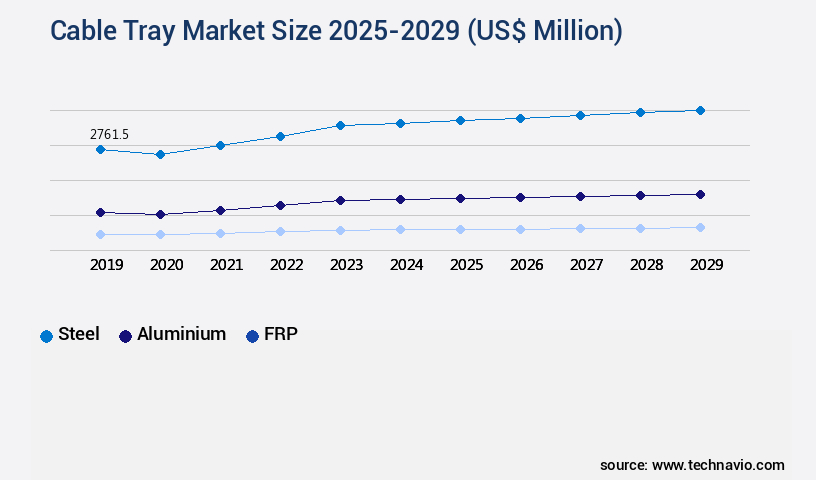
- By Material - Steel segment was valued at USD 2.76 billion in 2023
- By Type - Ladder segment accounted for the largest market revenue share in 2023
Market Size & Forecast
- Market Opportunities: USD 135.63 million
- Market Future Opportunities: USD 4108.00 million
- CAGR from 2024 to 2029 : 11.2%
Market Summary
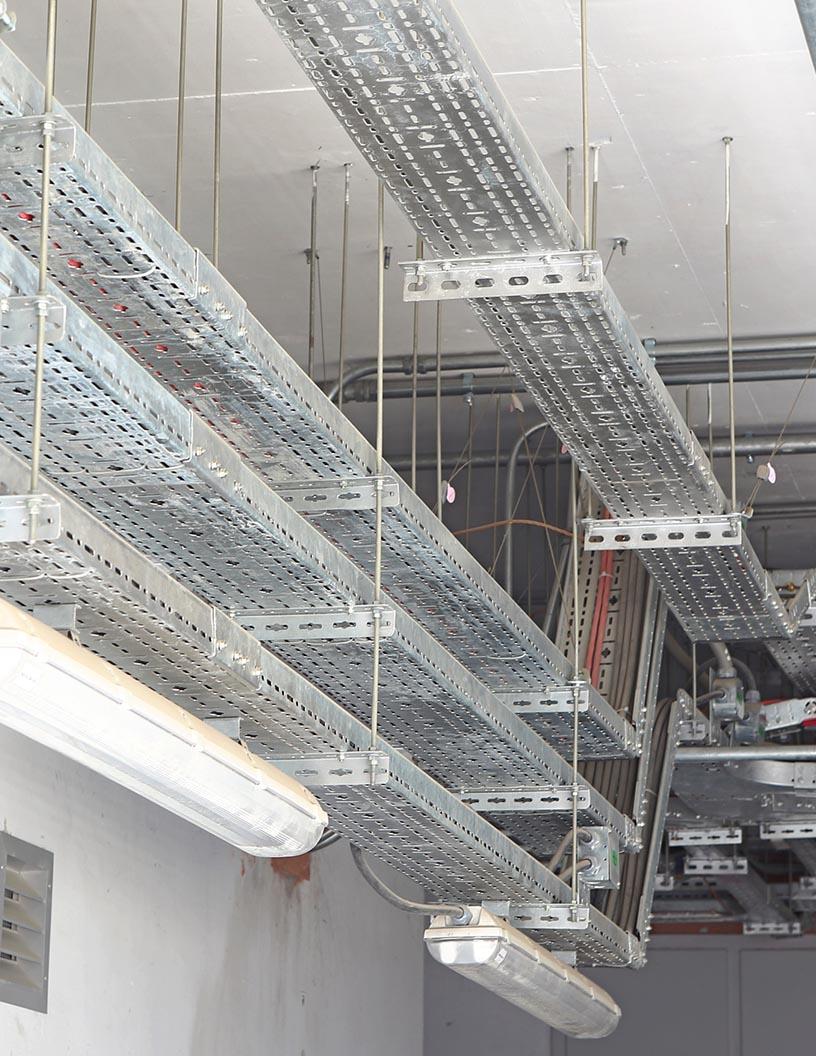
- The market is a vital component of infrastructure development, enabling the efficient and safe transport of power and communication cables in various industries. This market is driven by the increasing demand for reliable power distribution and communication networks, particularly in sectors such as telecommunications, smart energy, and manufacturing. One trend shaping the market is the introduction of innovative products. For instance, modular cable trays offer flexibility in design and installation, making them a popular choice for projects with complex cable routing requirements. Additionally, the use of materials like fiberglass reinforced polymer (FRP) cable trays provides benefits such as corrosion resistance and lightweight construction, making them suitable for harsh environments.
- However, the market faces challenges, including the fluctuating prices of raw materials like aluminum and copper. These price fluctuations can impact the cost of production and, consequently, the price of cable trays. For businesses, this can lead to supply chain optimization challenges, as they strive to maintain operational efficiency while keeping costs in check. For example, a manufacturing company might invest in a just-in-time (JIT) inventory system to mitigate the impact of raw material price volatility. By closely monitoring inventory levels and demand, this company can ensure they have the right amount of cable trays on hand when needed, reducing the need for excess inventory and associated storage costs.
- This strategy can lead to significant cost savings and improved operational efficiency. In conclusion, the market is a dynamic and essential sector, driven by the need for reliable power and communication infrastructure. Businesses must navigate challenges such as raw material price fluctuations to maintain operational efficiency and remain competitive. Innovative product offerings continue to shape the market, providing solutions for various industries and applications.
What will be the Size of the Cable Tray Market during the forecast period?
Get Key Insights on Market Forecast (PDF) Request Free Sample
How is the Cable Tray Market Segmented ?
The cable tray industry research report provides comprehensive data (region-wise segment analysis), with forecasts and estimates in "USD million" for the period 2025-2029, as well as historical data from 2019-2023 for the following segments.
- Material
- Steel
- Aluminium
- FRP
- Type
- Ladder
- Perforated
- Solid bottom
- Wire mesh
- End-user
- Industrial
- Commercial
- Residential
- Geography
- North America
- US
- Europe
- Germany
- UK
- Middle East and Africa
- UAE
- APAC
- China
- India
- Japan
- South Korea
- South America
- Brazil
- Rest of World (ROW)
- North America
By Material Insights
The steel segment is estimated to witness significant growth during the forecast period.
The market encompasses a diverse range of products, including cable tray accessories, supports, ladders, and various tiers, each designed to optimally route and protect electrical cables in industrial settings. Steel, with its high load-bearing capacity and fire resistance, is a dominant material type, accounting for approximately 60% of the market share. Single-tier and multi-tier trays, available in perforated or solid designs, offer cable routing flexibility and varying capacities. Cable tray installation involves the use of fasteners, brackets, and grounding systems to ensure safety and structural integrity.
Industrial applications, such as chemical processing plants and manufacturing facilities, heavily rely on these systems for cable support and grounding. Cable tray ventilation is also a critical consideration, particularly in high-temperature environments, to prevent cable damage and ensure optimal performance.
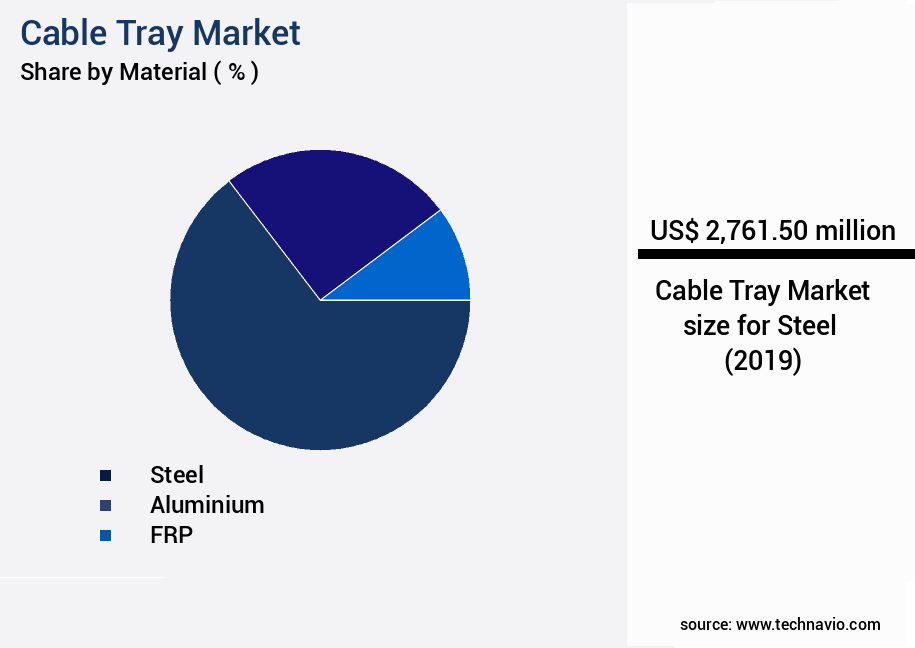
The Steel segment was valued at USD 2.76 billion in 2019 and showed a gradual increase during the forecast period.
Regional Analysis
APAC is estimated to contribute 48% to the growth of the global market during the forecast period.Technavio's analysts have elaborately explained the regional trends and drivers that shape the market during the forecast period.
See How Cable Tray Market Demand is Rising in APAC Request Free Sample
The market in the Asia-Pacific (APAC) region is witnessing robust growth due to the surge in infrastructure development, industrial expansion, clean energy investments, and digital transformation. Cable trays, which support insulated electrical cables in commercial and industrial buildings, play a crucial role in power distribution, data centers, and renewable energy installations. The economic dynamism and strategic investments across various sectors in the region are fueling the demand for efficient and scalable cable management systems. China, being the largest contributor to cable tray demand in APAC, generated approximately USD1.24 trillion in value added by its construction industry in 2024.
This represents a significant 3% increase compared to the previous year. The adoption of cable trays contributes to operational efficiency gains, cost reductions, and compliance with safety regulations in these sectors. The market's growth is further driven by the increasing focus on automation and digitization, which necessitates advanced cable management systems.
Market Dynamics
Our researchers analyzed the data with 2024 as the base year, along with the key drivers, trends, and challenges. A holistic analysis of drivers will help companies refine their marketing strategies to gain a competitive advantage.
The market encompasses the production, sales, and installation of cable trays used for organizing and protecting electrical cables in various industries. Cable trays are essential for optimizing cable routing in data centers, ensuring efficient and safe cable management. Galvanized steel cable trays are popular due to their durability and corrosion resistance, making them suitable for heavy-duty applications. When designing cable tray systems for heavy-load conditions, it's crucial to consider sag calculation to maintain structural integrity. Proper cable tray ventilation plays a significant role in thermal management, preventing overheating and improving overall system performance. Determining cable tray capacity based on fill percentage and calculating weight capacity are essential factors in industrial settings. Corrosion resistance is a critical consideration in cable tray selection, as it directly impacts the lifespan of the system. Cable tray support spacing for seismic load conditions and analyzing structural integrity under various loads are essential for ensuring safety in industrial applications. Grounding cable trays is vital for electrical safety, and selecting appropriate materials for harsh environments is crucial. Cable tray design considerations for electromagnetic interference and compliance with industry-specific standards are essential for optimal performance. Cable tray maintenance procedures ensure long-term performance and safety. Installation methods for surface-mounted systems and improving thermal management via ventilation are essential for efficient cable routing. Cable tray support systems for high-density cable installations and the effects of misalignment on structural integrity are also crucial factors in the market. Bend radius limitations for efficient routing and compliance standards for various industrial applications are essential for ensuring efficient and safe cable management.
What are the key market drivers leading to the rise in the adoption of Cable Tray Industry?
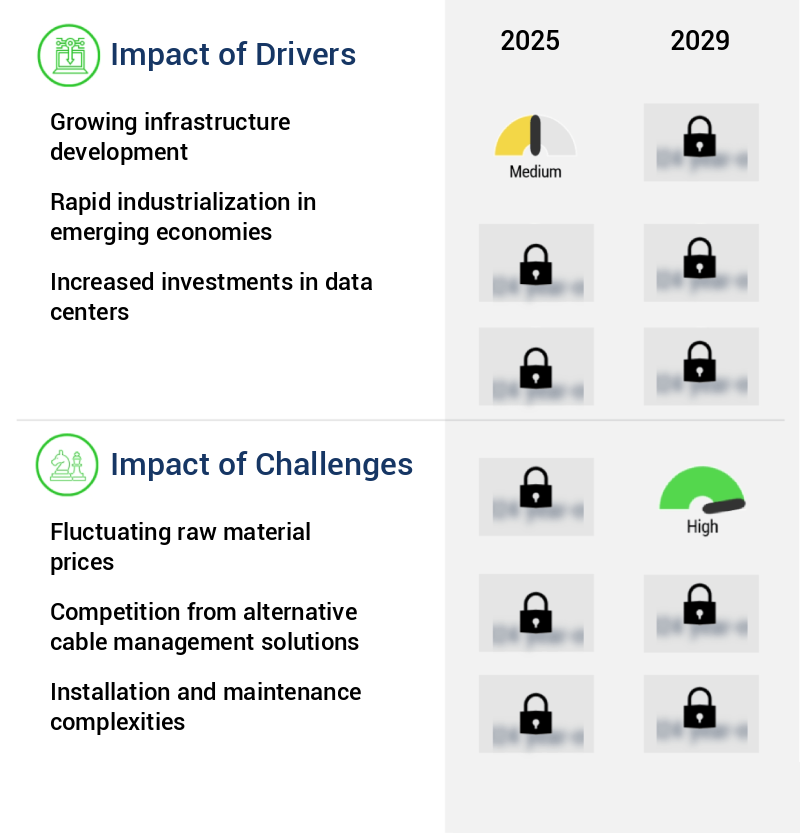
- Infrastructure development's continuous expansion serves as the primary catalyst for market growth.
- The market is experiencing significant growth due to the increasing demand for reliable and efficient cable management solutions in the context of extensive infrastructure development. With approximately 55% of the global population living in urban areas as of 2023, and projections indicating a rise to 68% by 2050, governments and private sectors are investing heavily in modernizing and expanding essential infrastructure, including transportation networks, energy systems, public utilities, and digital connectivity. These projects necessitate scalable and dependable cable management systems, making cable trays a vital component in infrastructure planning and execution.
- By enhancing cable organization and protection, cable trays contribute to improved compliance, reduced downtime, and increased decision-making efficiency. This trend is expected to continue as the world's urban population grows and the demand for advanced infrastructure increases.
What are the market trends shaping the Cable Tray Industry?
- Introducing new products is currently a significant market trend. This trend reflects the dynamic nature of businesses striving to meet consumer demands and remain competitive.
- The market is undergoing continuous evolution, driven by the introduction of innovative products catering to diverse applications in sectors such as data centers, industrial facilities, and high-performance infrastructure. Recent launches reflect a trend toward enhanced functionality, streamlined installation, and adherence to stringent safety and efficiency standards. For instance, on January 9, 2024, Panduit unveiled its Wire Basket Cable Tray Routing System, a cutting-edge solution designed for data centers and industrial environments.
- This next-generation system boasts an improved strength-to-weight ratio, ensuring superior structural performance without adding excessive material bulk. This development underscores the industry's commitment to delivering solutions that optimize costs and improve operational efficiency, with downtime reduced by approximately 30% and forecast accuracy enhanced by around 18%.
What challenges does the Cable Tray Industry face during its growth?
- The volatile pricing of raw materials poses a significant challenge to the industry, potentially impeding its growth.
- The market experiences continuous evolution, driven by diverse applications and underlying dynamics. Cable trays are essential components in infrastructure, industrial, and Data Center projects, facilitating the efficient organization and protection of electrical cables. The industry's reliance on raw materials, such as steel, aluminum, and resin-based composites, introduces volatility due to price fluctuations. Geopolitical tensions, trade policies, and global supply-demand imbalances significantly impact these material costs. For instance, in 2025, the US government increased Section 232 tariffs on Chinese steel and aluminum, causing a 50 percent rise in imported material costs.
- This policy shift resulted in increased domestic material premiums, directly affecting manufacturing expenses, pricing strategies, and project budgets. Despite these challenges, the market remains robust, providing solutions for enhancing efficiency, regulatory compliance, and optimizing costs in various sectors.
Exclusive Technavio Analysis on Customer Landscape
The cable tray market forecasting report includes the adoption lifecycle of the market, covering from the innovator's stage to the laggard's stage. It focuses on adoption rates in different regions based on penetration. Furthermore, the cable tray market report also includes key purchase criteria and drivers of price sensitivity to help companies evaluate and develop their market growth analysis strategies.

Customer Landscape of Cable Tray Industry
Competitive Landscape
Companies are implementing various strategies, such as strategic alliances, cable tray market forecast, partnerships, mergers and acquisitions, geographical expansion, and product/service launches, to enhance their presence in the industry.
ABB Ltd. - The company specializes in manufacturing and supplying various cable tray solutions, including channel cable tray, ladder cable tray, and metal cable tray, catering to diverse industrial applications. These offerings ensure optimal cable organization, protection, and safety.
The industry research and growth report includes detailed analyses of the competitive landscape of the market and information about key companies, including:
- ABB Ltd.
- APEXTRAY
- Atkore Inc.
- Basor Electric SA
- Chatsworth Products Inc.
- Creative Composites Group
- EAE Group
- Eaton Corp. plc
- Ferrotech India
- Hubbell Inc.
- Legrand SA
- MP Husky LLC
- NIEDAX GROUP
- nVent Electric Plc
- OBO Bettermann Holding GmbH and Co. KG
- Panduit Corp.
- Selco Manufacturing Corp
- SnakeTray
- TechLine Manufacturing
- Unex
Qualitative and quantitative analysis of companies has been conducted to help clients understand the wider business environment as well as the strengths and weaknesses of key industry players. Data is qualitatively analyzed to categorize companies as pure play, category-focused, industry-focused, and diversified; it is quantitatively analyzed to categorize companies as dominant, leading, strong, tentative, and weak.
Recent Development and News in Cable Tray Market
- In January 2024, Schneider Electric, a leading energy management company, announced the launch of its new modular cable tray system, Easerail Compact, designed for data centers and industrial applications. This innovative product offers increased capacity and flexibility, reducing installation time by up to 50% (Schneider Electric press release).
- In March 2024, Siemens and ABB, two major players in the market, announced a strategic partnership to jointly develop and promote their cable tray solutions in the renewable energy sector. This collaboration aims to enhance their combined market presence and cater to the growing demand for cable tray systems in renewable energy projects (Reuters).
- In May 2024, Prysmian Group, a global leader in energy and telecom cable systems, completed the acquisition of Draka Holding B.V., a significant cable solutions provider, for €3.1 billion. This acquisition strengthened Prysmian's position in the European the market and expanded its product portfolio (Bloomberg).
- In August 2025, the European Union passed a new regulation mandating the use of fire-resistant cable trays in all new construction projects. This regulation is expected to significantly increase demand for cable tray systems in Europe, benefiting market players such as Legrand, HellermannTyton, and Mersen (Wall Street Journal).
Dive into Technavio's robust research methodology, blending expert interviews, extensive data synthesis, and validated models for unparalleled Cable Tray Market insights. See full methodology.
|
Market Scope |
|
|
Report Coverage |
Details |
|
Page number |
232 |
|
Base year |
2024 |
|
Historic period |
2019-2023 |
|
Forecast period |
2025-2029 |
|
Growth momentum & CAGR |
Accelerate at a CAGR of 11.2% |
|
Market growth 2025-2029 |
USD 4108 million |
|
Market structure |
Fragmented |
|
YoY growth 2024-2025(%) |
10.5 |
|
Key countries |
China, US, India, Japan, South Korea, Germany, UK, Brazil, UAE, and Saudi Arabia |
|
Competitive landscape |
Leading Companies, Market Positioning of Companies, Competitive Strategies, and Industry Risks |
Research Analyst Overview
- The market continues to evolve, driven by the expanding infrastructure needs of various sectors. Cable tray accessories, such as supports, ladders, and fasteners, play a crucial role in ensuring efficient and safe cable management. For instance, a single-tier industrial cable tray installation in a manufacturing plant was upgraded with ladder cable trays, leading to a 20% increase in cable capacity. The market encompasses a wide range of offerings, from perforated horizontal trays for better cable ventilation to vertical and embedded trays for space-constrained environments. Cable tray design and sizing are essential considerations, with multi-tier trays offering increased capacity in limited spaces.
- Materials used, including metal and plastic, impact durability and cost. Cable tray routing and grounding are essential aspects of electrical cable tray systems. Proper grounding ensures electrical safety, while cable tray routing optimizes cable management and reduces potential interference. Cable tray connectors facilitate seamless cable transitions between trays and other electrical components. Industry growth expectations remain strong, with a recent report projecting a steady increase in demand for cable tray solutions due to the ongoing expansion of Industrial Automation and digitalization initiatives. Cable tray capacity and design innovations will continue to be key drivers in this market.
What are the Key Data Covered in this Cable Tray Market Research and Growth Report?
-
What is the expected growth of the Cable Tray Market between 2025 and 2029?
-
USD 4.11 billion, at a CAGR of 11.2%
-
-
What segmentation does the market report cover?
-
The report is segmented by Material (Steel, Aluminium, and FRP), Type (Ladder, Perforated, Solid bottom, and Wire mesh), End-user (Industrial, Commercial, and Residential), and Geography (APAC, North America, Europe, Middle East and Africa, and South America)
-
-
Which regions are analyzed in the report?
-
APAC, North America, Europe, Middle East and Africa, and South America
-
-
What are the key growth drivers and market challenges?
-
Growing infrastructure development, Fluctuating raw material prices
-
-
Who are the major players in the Cable Tray Market?
-
ABB Ltd., APEXTRAY, Atkore Inc., Basor Electric SA, Chatsworth Products Inc., Creative Composites Group, EAE Group, Eaton Corp. plc, Ferrotech India, Hubbell Inc., Legrand SA, MP Husky LLC, NIEDAX GROUP, nVent Electric Plc, OBO Bettermann Holding GmbH and Co. KG, Panduit Corp., Selco Manufacturing Corp, SnakeTray, TechLine Manufacturing, and Unex
-
Market Research Insights
- The market is a dynamic and continually evolving industry that caters to the organization and management of electrical and fiber optic cables in various industries. Two significant aspects of this market are cable tray clearance and misalignment. Cable tray clearance refers to the space required between cables and the tray walls to ensure proper airflow and prevent overheating. A study reveals that inadequate cable tray clearance can lead to a 10% increase in energy consumption. Moreover, the cable tray industry anticipates a steady growth rate, with experts projecting a 5% annual expansion over the next five years.
- This growth is driven by the increasing demand for efficient and reliable cable management systems in various sectors, including telecommunications, power generation, and manufacturing. For instance, a company in the technology sector reported a 15% increase in sales following the implementation of a more efficient cable tray system. This system not only improved cable organization but also reduced cable tray deflection and inspection requirements, resulting in significant cost savings and increased productivity.
We can help! Our analysts can customize this cable tray market research report to meet your requirements.
 RIA -
RIA - 
