Calibration Equipment Market Size and Growth Forecast 2026-2030
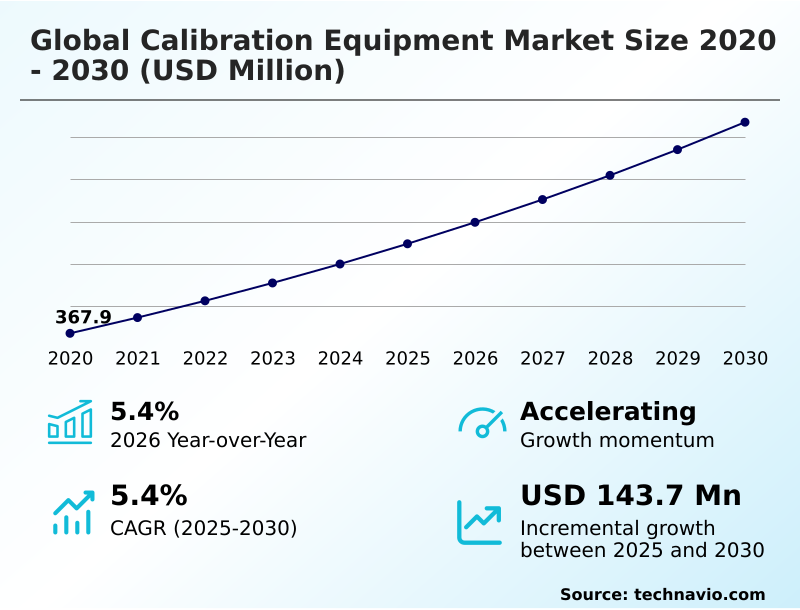
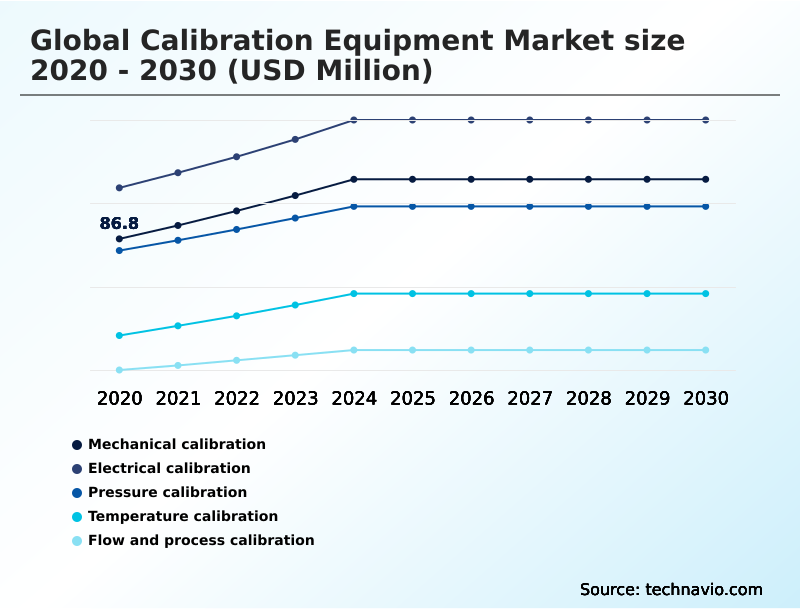
The Calibration Equipment Market size was valued at USD 473.7 million in 2025 growing at a CAGR of 5.4% during the forecast period 2026-2030.
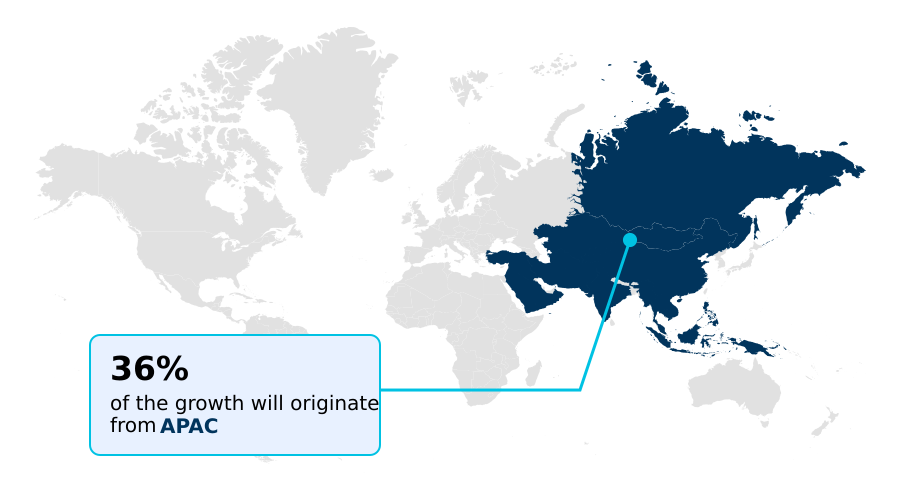
APAC accounts for 35.5% of incremental growth during the forecast period. The Mechanical calibration segment by Application was valued at USD 107.7 million in 2024, while the Handheld and portable segment holds the largest revenue share by Product Type.
The market is projected to grow by USD 249.5 million from 2020 to 2030, with USD 143.7 million of the growth expected during the forecast period of 2025 to 2030.
Get Key Insights on Market Forecast (PDF) Request Free Sample
Calibration Equipment Market Overview
The calibration equipment market is fundamentally shaped by the industrial transition toward automation and data-driven quality assurance. Adherence to rigorous standards such as ISO/IEC 17025 is a primary driver, compelling investment in high-precision hardware and metrology software integration. For instance, in a large-scale pharmaceutical manufacturing facility, the deployment of multifunction process calibrators for verifying bioreactor sensors is critical; integrating this with a cloud-based calibration management system can reduce documentation time by over 50% and virtually eliminate transcription errors, ensuring a compliant audit trail. This shift is steering procurement away from standalone devices toward interconnected ecosystems that support predictive maintenance models. While the APAC region is set to contribute over 35% of the market's growth, challenges persist globally, including a critical scarcity of skilled metrologists capable of managing complex measurement uncertainty evaluation and implementing new technologies like on-chip quantum standards. This dynamic places a premium on solutions that combine high accuracy with operational simplicity.
Drivers, Trends, and Challenges in the Calibration Equipment Market
Strategic procurement in the calibration equipment market is shifting from acquiring standalone instruments to implementing holistic, integrated metrology systems. This evolution is driven by the operational need for a seamless digitalization of calibration audit trails, which is critical for compliance with standards like ISO 9001 and IATF 16949 in the automotive sector.
For example, a tier-1 automotive supplier must ensure that every torque wrench and pressure sensor on its assembly line is accurately calibrated. By integrating calibration data with erp systems, plant managers can automate record-keeping and preemptively flag instruments approaching their service intervals, reducing the risk of a line-down situation.
This proactive approach, facilitated by multi-parameter testing for field technicians using a single device, delivers a significant operational advantage over traditional, siloed methods. The ability to perform high-precision thermal calibration protocol verification on the factory floor, rather than in a separate lab, shortens maintenance cycles.
Ultimately, the focus on calibration for industrial automation sensors is not just about accuracy but about embedding measurement data into the core of the digital manufacturing ecosystem to enhance productivity and mitigate compliance risks.
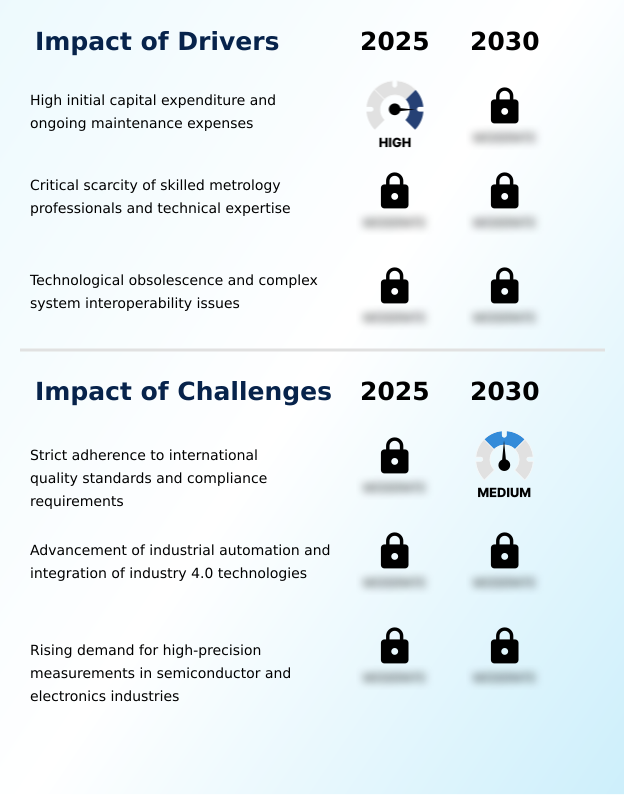
Primary Growth Driver: Strict adherence to international quality standards and compliance requirements is a key driver for the global calibration equipment market.
Stringent regulatory compliance and the technical demands of advanced manufacturing are primary market drivers. Adherence to ISO/IEC 17025 compliance is mandatory for laboratories to prove competence, necessitating investment in equipment that provides unimpeachable traceability reference standards.
The continuous push toward nanometer-scale metrology in the semiconductor and electronics industries requires unprecedented levels of precision that only cutting-edge calibrators can provide.
Within industrial automation, the widespread use of smart devices requires seamless data flow, fueling the adoption of instruments with native support for HART communication protocol and Foundation Fieldbus integration.
This allows calibration data to be integrated directly into plant control systems, improving process oversight.
Furthermore, a more analytical approach to maintenance, involving systematic calibration interval analysis, is being adopted to balance compliance costs against operational risks, solidifying the need for accurate and reliable calibration tools.
Emerging Market Trend: The transition toward digitalized and cloud-based metrology ecosystems represents a significant market trend, enhancing data management and operational efficiency across industrial operations.
The market is undergoing a significant transformation driven by digitalization and intelligent automation. The adoption of cloud-based calibration management systems is becoming standard practice, enabling real-time data synchronization and remote access to records, which is crucial for organizations with global operations.
This trend supports the move toward predictive maintenance models, where AI algorithms analyze historical data to forecast instrument drift prediction and optimize service schedules. In parallel, the use of digital twin technology allows for the simulation and analysis of measurement systems, improving design and performance.
This is complemented by advanced metrology software integration with enterprise-level systems, creating a unified data ecosystem. This digital shift not only enhances efficiency but also strengthens compliance with rigorous international standards by providing a transparent and automated audit trail, moving the industry decisively beyond paper-based workflows.
Key Industry Challenge: High initial capital expenditure and ongoing maintenance expenses are a key challenge for the global calibration equipment market.
The market faces significant challenges related to technological complexity, cost, and workforce expertise. The high capital investment required for instruments capable of performing high-frequency electrical calibrations or validating next-generation sensors acts as a barrier for many organizations.
Furthermore, the rapid pace of innovation leads to a constant risk of obsolescence; emerging technologies like on-chip quantum standards and self-calibrating sensors, while promising, require new knowledge and create interoperability issues with legacy systems. A critical challenge is the accurate measurement uncertainty evaluation, a complex task that demands deep metrological expertise, which is in short supply.
This skills gap complicates the field calibration workflow, increasing the risk of procedural errors and slowing the adoption of more advanced, efficient calibration strategies across the industry.
Explore Full Market Dynamics Analysis Request Free Sample
Calibration Equipment Market Segmentation
The calibration equipment industry research report provides comprehensive data including region-wise segment analysis, with forecasts and analysis for the period 2026-2030, as well as historical data from 2020-2024 for the following segments.
Application Segment Analysis
The electrical calibration segment is estimated to witness significant growth during the forecast period.
The electrical calibration segment is foundational for industries where precise measurement of voltage, current, and resistance is non-negotiable.
This segment's growth is tied to the adoption of sophisticated documenting process calibrators and automated pressure calibrators that reduce human error and ensure compliance with standards like the International Electrotechnical Commission's safety protocols.
Innovations such as advanced temperature calibration baths and high-speed laser scan micrometers are becoming essential for verifying the performance of telecommunications and semiconductor components.
As manufacturing moves toward greater complexity, the need for multifunction process calibrators that integrate multiple electrical and physical measurements into a single workflow becomes a critical factor for maintaining operational efficiency and product quality, contributing significantly to the market's overall trajectory.
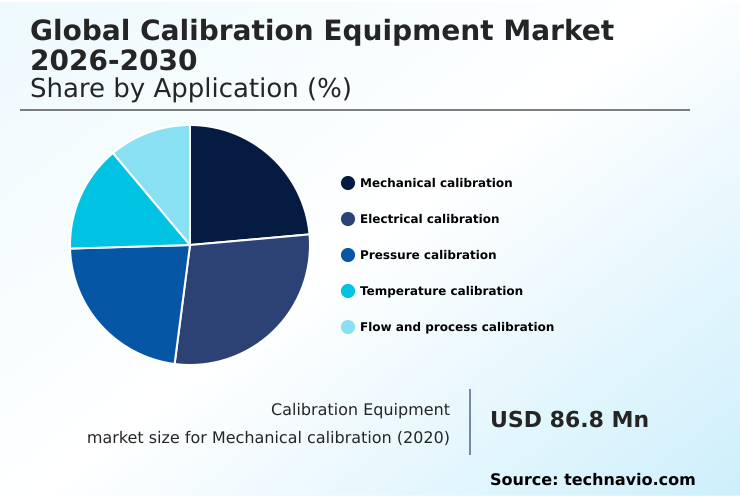
The Electrical calibration segment was valued at USD 107.7 million in 2024 and showed a gradual increase during the forecast period.
Calibration Equipment Market by Region: APAC Leads with 35.5% Growth Share
APAC is estimated to contribute 35.5% to the growth of the global market during the forecast period.
The geographic dynamics of the calibration equipment market are characterized by a dual focus on mature and emerging industrial economies.
North America, contributing approximately 34.38% of the market opportunity, continues to lead in the adoption of high-end benchtop and automated systems, driven by its aerospace, defense, and pharmaceutical sectors, where advanced deadweight testers are standard.
In contrast, the APAC region, representing 35.49% of the opportunity, shows rapid growth fueled by the expansion of electronics and automotive manufacturing.
In this region, there is strong demand for versatile and cost-effective solutions like multifunction process calibrators and digital pressure gauges.
The need for in-situ calibration in remote energy and mining sites in regions like South America and Australia further diversifies demand, favoring rugged, portable instruments integrated with a centralized asset management platform.
Customer Landscape Analysis for the Calibration Equipment Market
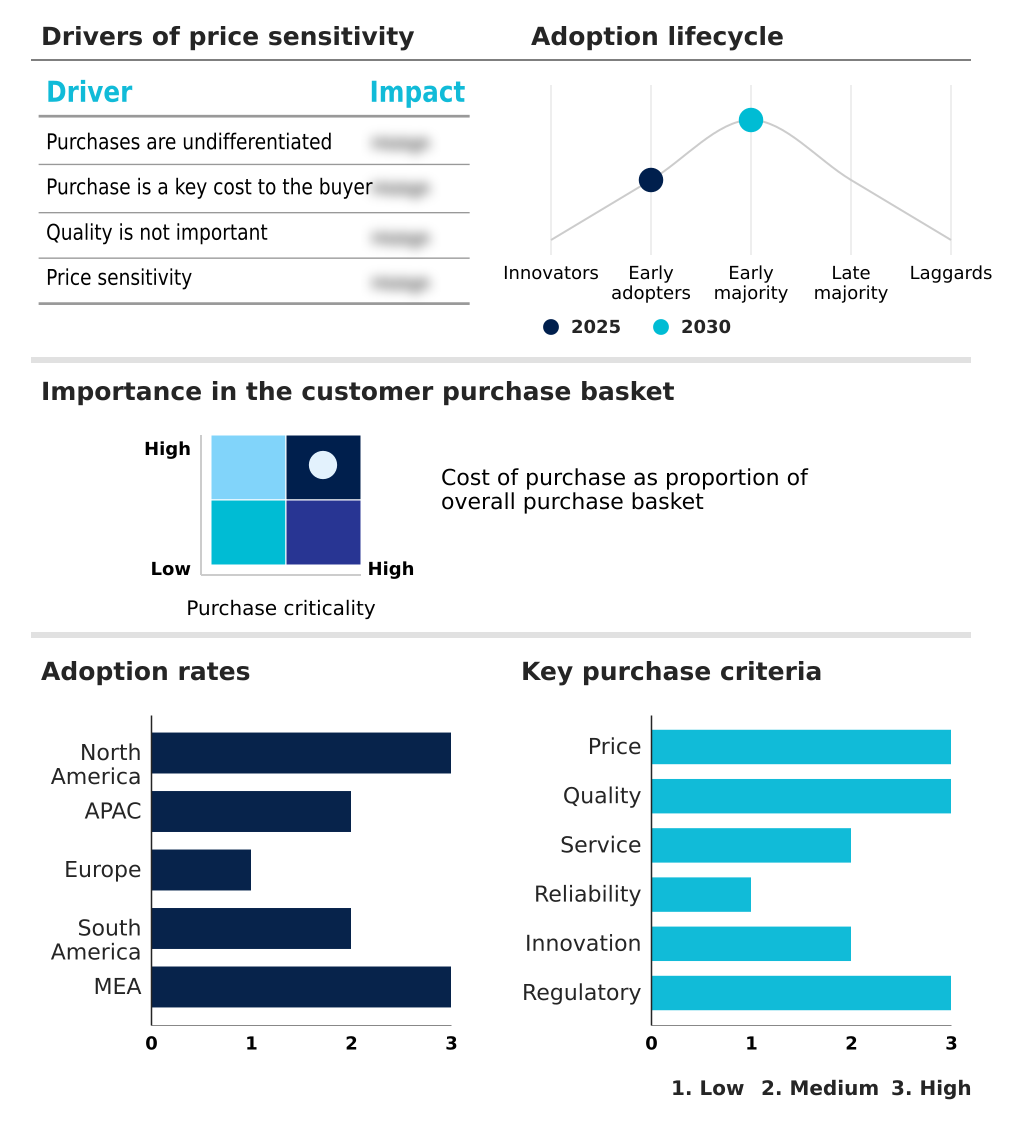
The calibration equipment market forecasting report includes the adoption lifecycle of the market, covering from the innovator’s stage to the laggard’s stage. It focuses on adoption rates in different regions based on penetration. Furthermore, the calibration equipment market report also includes key purchase criteria and drivers of price sensitivity to help companies evaluate and develop their market growth analysis strategies.
Competitive Landscape of the Calibration Equipment Market
Companies are implementing various strategies, such as strategic alliances, partnerships, mergers and acquisitions, geographical expansion, and product/service launches, to enhance their presence in the calibration equipment market industry.
Additel Corp. - Core offerings center on high-precision instruments and integrated software systems designed to verify, maintain, and manage the accuracy of critical measurement devices across industrial applications.
The industry research and growth report includes detailed analyses of the competitive landscape of the market and information about key companies, including:
- Additel Corp.
- AMETEK Inc.
- Baker Hughes Co.
- Beamex Oy AB
- Cole Parmer
- Darter Controls Pvt Ltd
- DwyerOmega
- Endress Hauser Grp Services
- Fluke Corp.
- Keysight Technologies Inc.
- Mettler Toledo Inc.
- Nagman Instruments Pvt. Ltd.
- Omega Engineering Inc.
- PCE Holding GmbH
- Rohde and Schwarz GmbH
- Tempsens Instrument Pvt. Ltd.
- Time Electronics Ltd
- Transmille Ltd
- WIKA Alexander Wiegand SE
- Yokogawa Electric Corp.
Qualitative and quantitative analysis of companies has been conducted to help clients understand the wider business environment as well as the strengths and weaknesses of key industry players. Data is qualitatively analyzed to categorize companies as pure play, category-focused, industry-focused, and diversified; it is quantitatively analyzed to categorize companies as dominant, leading, strong, tentative, and weak.
Recent Developments in the Calibration Equipment Market
- In February 2025, the Japanese Ministry of Economy, Trade and Industry announced a financial support program to assist smaller manufacturing firms in the APAC region with the costs of laboratory infrastructure and precision testing hardware.
- In March 2025, Fluke Corporation expanded its presence in digital metrology by launching a cloud-based calibration management platform designed to synchronize measurement data across multiple international facilities.
- In April 2025, the International Organization for Standardization released a technical update regarding the traceability of mechanical force measurements in laboratory settings, prompting a review of protocols across multinational testing facilities.
- In May 2025, Beamex finalized the expansion of its cloud-based calibration management software to include native API integrations for major corporate asset management platforms, enabling seamless data transfer.
Research Analyst Overview: Calibration Equipment Market
Boardroom decisions regarding capital expenditure are increasingly influenced by the total cost of ownership of metrology assets, moving beyond initial hardware acquisition. The market's technical progression, demonstrated by advancements in nanometer-scale metrology and the development of high-frequency electrical calibrations, requires a strategic approach to technology lifecycle management.
Adherence to ISO/IEC 17025 compliance is non-negotiable, compelling investment in documenting process calibrators and sophisticated software to manage audit trails. While benchtop instruments like deadweight testers and temperature calibration baths remain the gold standard for primary labs, there is a clear demand shift toward portable solutions. The handheld and portable segment's growth reflects the need for efficiency in field service.
The adoption of modular pressure controllers and multifunction process calibrators allows for a reduction in the number of tools a technician must carry.
As technologies like on-chip quantum standards and laser scan micrometers emerge, and communication protocols like HART communication protocol and Foundation Fieldbus integration become standard, companies must balance the adoption of innovation with the need for a manageable and interoperable instrument portfolio.
Dive into Technavio’s robust research methodology, blending expert interviews, extensive data synthesis, and validated models for unparalleled Calibration Equipment Market insights. See full methodology.
| Market Scope | |
|---|---|
| Page number | 309 |
| Base year | 2025 |
| Historic period | 2020-2024 |
| Forecast period | 2026-2030 |
| Growth momentum & CAGR | Accelerate at a CAGR of 5.4% |
| Market growth 2026-2030 | USD 143.7 million |
| Market structure | Fragmented |
| YoY growth 2025-2026(%) | 5.4% |
| Key countries | US, Canada, Mexico, China, India, Japan, South Korea, Australia, Indonesia, Germany, UK, France, Italy, Spain, The Netherlands, Brazil, Argentina, Colombia, Saudi Arabia, UAE, South Africa, Israel and Turkey |
| Competitive landscape | Leading Companies, Market Positioning of Companies, Competitive Strategies, and Industry Risks |
Calibration Equipment Market: Key Questions Answered in This Report
-
What is the expected growth of the Calibration Equipment Market between 2026 and 2030?
-
The Calibration Equipment Market is expected to grow by USD 143.7 million during 2026-2030, registering a CAGR of 5.4%. Year-over-year growth in 2026 is estimated at 5.4%%. This acceleration is shaped by high initial capital expenditure and ongoing maintenance expenses, which is intensifying demand across multiple end-use verticals covered in the report.
-
-
What segmentation does the market report cover?
-
The report is segmented by Application (Mechanical calibration, Electrical calibration, Pressure calibration, Temperature calibration, and Flow and process calibration), Product Type (Handheld and portable, and Benchtop), End-user (Manufacturing, Energy and power, Healthcare and pharmaceuticals, Electronics and semiconductors, and Others) and Geography (North America, APAC, Europe, South America, Middle East and Africa). Among these, the Electrical calibration segment is estimated to witness significant growth during the forecast period, driven by rising adoption across key application areas. Each segment includes detailed qualitative and quantitative analysis, along with historical data from 2020-2024 and forecasts through 2030 with year-over-year growth rates.
-
-
Which regions are analyzed in the report?
-
The report covers North America, APAC, Europe, South America and Middle East and Africa. APAC is estimated to contribute 35.5% to market growth during the forecast period. Country-level analysis includes US, Canada, Mexico, China, India, Japan, South Korea, Australia, Indonesia, Germany, UK, France, Italy, Spain, The Netherlands, Brazil, Argentina, Colombia, Saudi Arabia, UAE, South Africa, Israel and Turkey, with dedicated market size tables and year-over-year growth for each.
-
-
What are the key growth drivers and market challenges?
-
The primary driver is high initial capital expenditure and ongoing maintenance expenses, which is accelerating investment and industry demand. The main challenge is strict adherence to international quality standards and compliance requirements, creating operational barriers for key market participants. The report quantifies the impact of each driver and challenge across 2026 and 2030 with comparative analysis.
-
-
Who are the major players in the Calibration Equipment Market?
-
Key vendors include Additel Corp., AMETEK Inc., Baker Hughes Co., Beamex Oy AB, Cole Parmer, Darter Controls Pvt Ltd, DwyerOmega, Endress Hauser Grp Services, Fluke Corp., Keysight Technologies Inc., Mettler Toledo Inc., Nagman Instruments Pvt. Ltd., Omega Engineering Inc., PCE Holding GmbH, Rohde and Schwarz GmbH, Tempsens Instrument Pvt. Ltd., Time Electronics Ltd, Transmille Ltd, WIKA Alexander Wiegand SE and Yokogawa Electric Corp.. The report provides qualitative and quantitative analysis categorizing companies as dominant, leading, strong, tentative, and weak based on their market positioning. Company profiles include business segment analysis, SWOT assessment, key offerings, and recent strategic developments.
-
Calibration Equipment Market Research Insights
The market's momentum is increasingly defined by the need for enhanced data integrity and operational efficiency. The adoption of digital twin technology allows for predictive modeling of instrument performance, directly addressing issues of instrument drift prediction and optimizing calibration interval analysis. This shift is supported by robust metrology software integration with the broader enterprise asset management platform.
For instance, adherence to ISO/IEC 17025 necessitates a transparent and auditable field calibration workflow, which is now facilitated by cloud-based calibration management systems that provide remote monitoring capabilities. These systems create a paperless metrology environment where traceability reference standards are digitally linked to every measurement.
Even in challenging environments requiring in-situ calibration, modern tools ensure that data is captured and synchronized, reducing the reliance on manual verification and enhancing overall measurement uncertainty evaluation.
We can help! Our analysts can customize this calibration equipment market research report to meet your requirements.
 RIA -
RIA - 
