Calibration Management Software Market Analysis, Size, and Forecast 2026-2030: North America (US, Canada, and Mexico), Europe (Germany, UK, and France), APAC (Japan, China, and India), South America (Brazil and Argentina), Middle East and Africa (UAE, Saudi Arabia, and South Africa), and Rest of World (ROW)

Calibration Management Software Market Analysis, Size, and Forecast 2026-2030:
North America (US, Canada, and Mexico), Europe (Germany, UK, and France), APAC (Japan, China, and India), South America (Brazil and Argentina), Middle East and Africa (UAE, Saudi Arabia, and South Africa), and Rest of World (ROW)

Published: Mar 2026 289 Pages SKU: IRTNTR40617

Market Overview at a Glance

$82.4 Mn
Market Opportunity
3.9%
CAGR 2025 - 2030
37.4%
North America Growth
$230.6 Mn
Locally installed segment 2024

Calibration Management Software Market Size 2026-2030

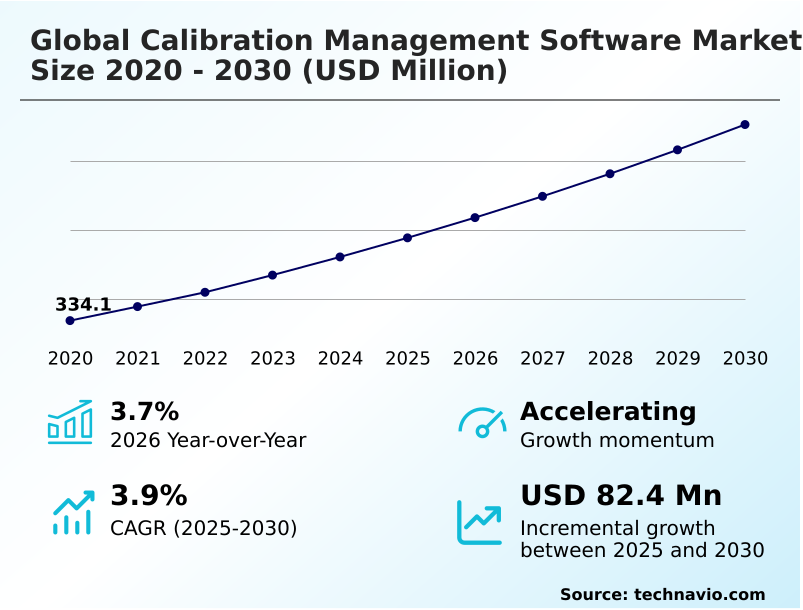
The calibration management software market size is valued to increase by USD 82.4 million, at a CAGR of 3.9% from 2025 to 2030. Automation of calibration process will drive the calibration management software market.

Major Market Trends & Insights

  • North America dominated the market and accounted for a 37.4% growth during the forecast period.
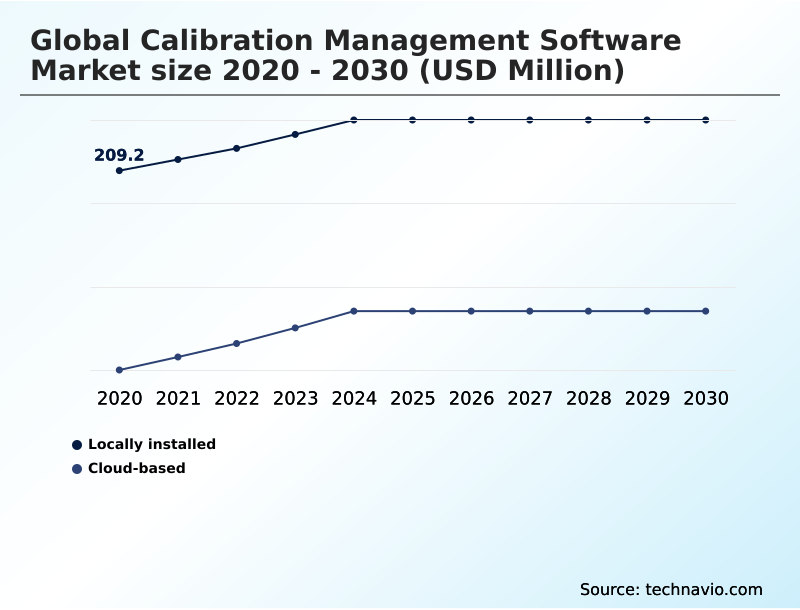
  • By Technology - Locally installed segment was valued at USD 230.6 million in 2024
  • By Application - Large enterprises segment accounted for the largest market revenue share in 2024

Market Size & Forecast

  • Market Opportunities: USD 142.6 million
  • Market Future Opportunities: USD 82.4 million
  • CAGR from 2025 to 2030 : 3.9%

Market Summary

  • The calibration management software market is fundamentally driven by the industrial imperative for quality, compliance, and operational efficiency. Organizations across manufacturing, healthcare, and aerospace rely on this technology to transition from reactive, paper-based record-keeping to proactive, automated systems.
  • A key driver is the stringent enforcement of regulatory standards, which mandates meticulous instrument calibration management and verifiable audit trail management for iso 17025 compliance. The adoption of cloud-based calibration platforms is accelerating, offering scalability and remote accessibility that is crucial for multi-site operations.
  • For example, a pharmaceutical manufacturer can use a centralized asset management system to ensure that all laboratory instruments across global facilities are calibrated on schedule, with automated certificate generation and deviation alerts. This not only streamlines compliance but also integrates predictive maintenance analytics to anticipate instrument drift, reducing the risk of costly production batch failures.
  • The increasing focus on data integrity and the integration of smart calibrators are further shaping the market, pushing companies toward more intelligent and interconnected quality ecosystems that enhance both productivity and risk mitigation strategies.

What will be the Size of the Calibration Management Software Market during the forecast period?

Get Key Insights on Market Forecast (PDF) Request Free Sample

How is the Calibration Management Software Market Segmented?

The calibration management software industry research report provides comprehensive data (region-wise segment analysis), with forecasts and estimates in "USD million" for the period 2026-2030, as well as historical data from 2020-2024 for the following segments.

  • Technology
    • Locally installed
    • Cloud-based
  • Application
    • Large enterprises
    • Small and medium enterprises
  • End-user
    • Manufacturing
    • Healthcare
    • Pharmaceuticals
    • Aerospace and defense
    • Others
  • Geography
    • North America
      • US
      • Canada
      • Mexico
    • Europe
      • Germany
      • UK
      • France
    • APAC
      • Japan
      • China
      • India
    • South America
      • Brazil
      • Argentina
    • Middle East and Africa
      • UAE
      • Saudi Arabia
      • South Africa
    • Rest of World (ROW)

By Technology Insights

The locally installed segment is estimated to witness significant growth during the forecast period.

The on-premise deployment model remains a cornerstone for industries where absolute data control is non-negotiable. This approach enables deep cmms integration and supports comprehensive instrument lifecycle management.

By hosting systems internally, organizations gain unparalleled control over audit trail management and can implement strict e-signature workflows.

This localized strategy facilitates the creation of tamper-proof electronic records, simplifies regulatory compliance reporting for complex calibration standards management, and allows for precise asset hierarchy management.

It is crucial for asset lifecycle tracking and cmms erp integration with legacy systems, ensuring that compliance documentation automation reduces audit-related errors by over 15% while supporting service level agreement tracking with internal teams.

Request Free Sample

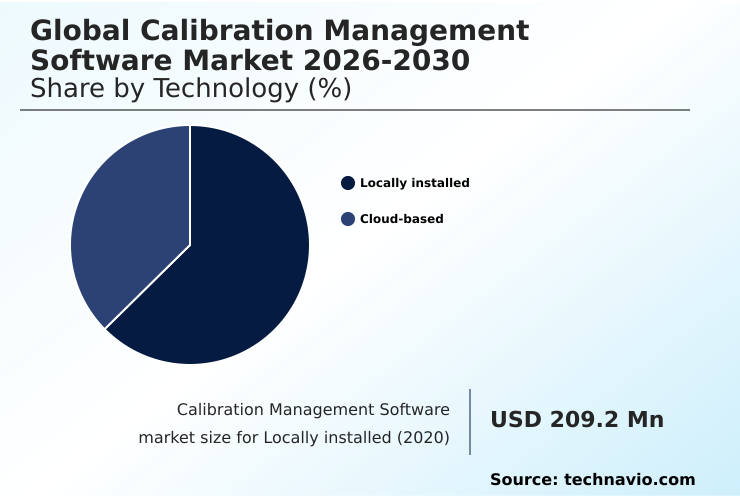
The Locally installed segment was valued at USD 230.6 million in 2024 and showed a gradual increase during the forecast period.

Request Free Sample

Regional Analysis

North America is estimated to contribute 37.4% to the growth of the global market during the forecast period.Technavio’s analysts have elaborately explained the regional trends and drivers that shape the market during the forecast period.

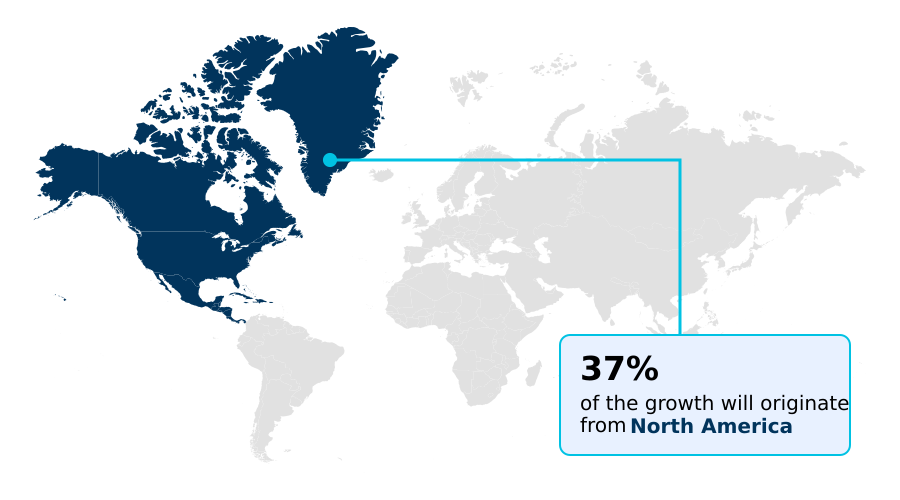
See How Calibration Management Software Market Demand is Rising in North America Request Free Sample

The geographic landscape is led by North America, which accounts for over 37% of new system adoptions, driven by demand for advanced test equipment management.

Europe follows, contributing nearly one-third of the market's expansion, with a focus on smart calibrator communication. In these mature markets, saas calibration solutions that include a mobile calibration application are boosting field technician efficiency by up to 20%.

These platforms rely on a central instrument data repository and a master calibrator database for consistency. Meanwhile, the APAC region is adopting cloud platforms that provide workflow automation tools and automated reporting tools for enhanced calibration metrics reporting.

These systems enable remote calibration access and automated audit reports, with real-time data synchronization from a master instrument database.

Market Dynamics

Our researchers analyzed the data with 2025 as the base year, along with the key drivers, trends, and challenges. A holistic analysis of drivers will help companies refine their marketing strategies to gain a competitive advantage.

  • Organizations are increasingly evaluating the strategic benefits of modern calibration systems, moving beyond basic compliance to achieve tangible operational gains. A key consideration is the debate of saas vs on-premise calibration software, where the decision impacts everything from initial investment to long-term scalability.
  • For businesses managing multiple sites with cloud software, the advantages of centralized data and remote access are clear. The roi of automated calibration scheduling is a significant driver, with companies reporting a two-fold improvement in technician utilization. This is closely linked to reducing downtime with predictive maintenance, achieved by optimizing calibration intervals using data.
  • For regulated sectors, the focus is on specialized applications. Calibration software for pharmaceutical manufacturing must prioritize ensuring data integrity for fda compliance, while calibration software for aerospace industry needs to manage complex asset specifications. Likewise, software for iso 17025 accredited labs requires robust features for measurement uncertainty.
  • Implementing best practices for audit trail management and linking capa to calibration events are critical for these fields. This involves overcoming smart calibrator integration challenges and performing rigorous software validation for regulated industries. Functionality like customizable reporting in calibration software and automating calibration certificate workflows are now standard expectations.
  • Finally, the ability to define a clear asset hierarchy in calibration software and apply risk-based calibration scheduling methods is transforming asset management. Even for smaller operations, effective calibration management for smes is becoming a competitive necessity, especially when supported by tools for mobile calibration for field technicians and by integrating calibration software with mes for a holistic production view.

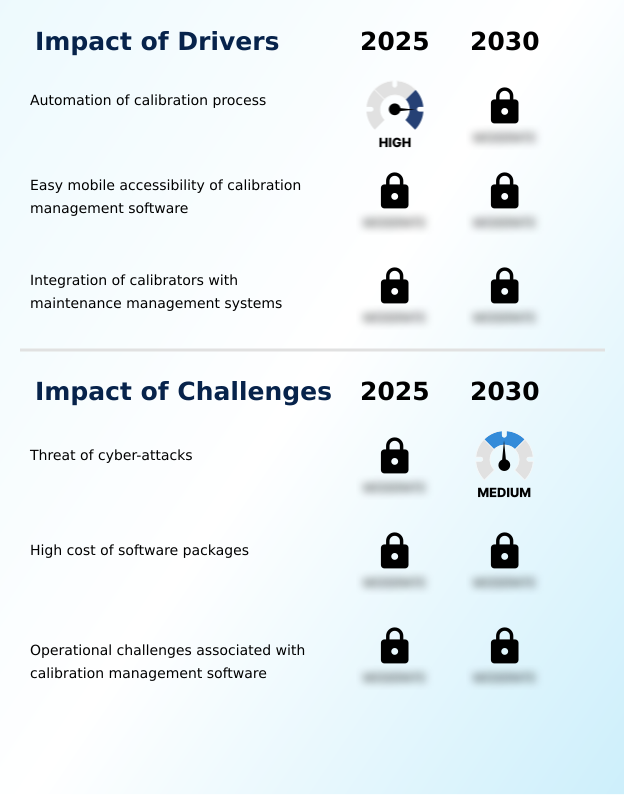
What are the key market drivers leading to the rise in the adoption of Calibration Management Software Industry?

  • The automation of the calibration process, which reduces manual effort and improves accuracy, serves as a key market driver.

  • The primary market driver is the automation of calibration processes, enabled by sophisticated calibration control software. These platforms feature automated calibration scheduling and automatic calibration certificate generation, reducing manual data entry by over 90%.
  • As a core asset management system, this software enables seamless quality management system integration and supports electronic signature support for digital calibration records. The adoption of specific process calibrator tools, coupled with calibration procedure automation, further enhances efficiency.
  • This focus on enterprise asset management is supported by robust asset tracking software and streamlined equipment maintenance scheduling, making a compelling business case for adoption by accelerating compliance reporting cycles significantly.

What are the market trends shaping the Calibration Management Software Industry?

  • An increased focus on predictive maintenance and analytics is an emerging market trend. This involves leveraging data to anticipate equipment failures and optimize calibration schedules.

  • A prominent trend is the integration of predictive maintenance analytics, shifting organizations toward a proactive preventive maintenance strategy. By applying calibration interval analysis to historical data, companies can improve asset uptime by 15% and trigger out-of-tolerance alerts before failures occur. This data-driven calibration approach supports risk-based calibration and efficient equipment lifecycle management.
  • The trend extends to outsourcing, with increased calibration service provider management and third-party lab integration driving demand for platforms supporting this calibration workflow optimization. Such systems streamline the entire validation lifecycle management process, from issuing digital work instructions for corrective and preventive actions to documenting outcomes, reducing overall calibration-related expenses by up to 20%.

What challenges does the Calibration Management Software Industry face during its growth?

  • The pervasive threat of cyber-attacks presents a significant challenge to market growth, particularly for cloud-based and IoT-integrated solutions.

  • A significant challenge is ensuring calibration data integrity amid rising cybersecurity threats, which impacts both cloud deployment security and on-premise systems. Effective instrument calibration management must address GxP compliance software requirements and stringent standards like iso 17025 compliance and fda 21 cfr part 11. The complexity of metrology software solutions demands robust quality assurance software and thorough measurement uncertainty analysis.
  • Organizations also face hurdles with instrument performance monitoring and accurate measurement system analysis. For specialized sectors, integrating gauge management software with a broader laboratory information management system can be complex, with integration failures accounting for nearly 30% of implementation delays.

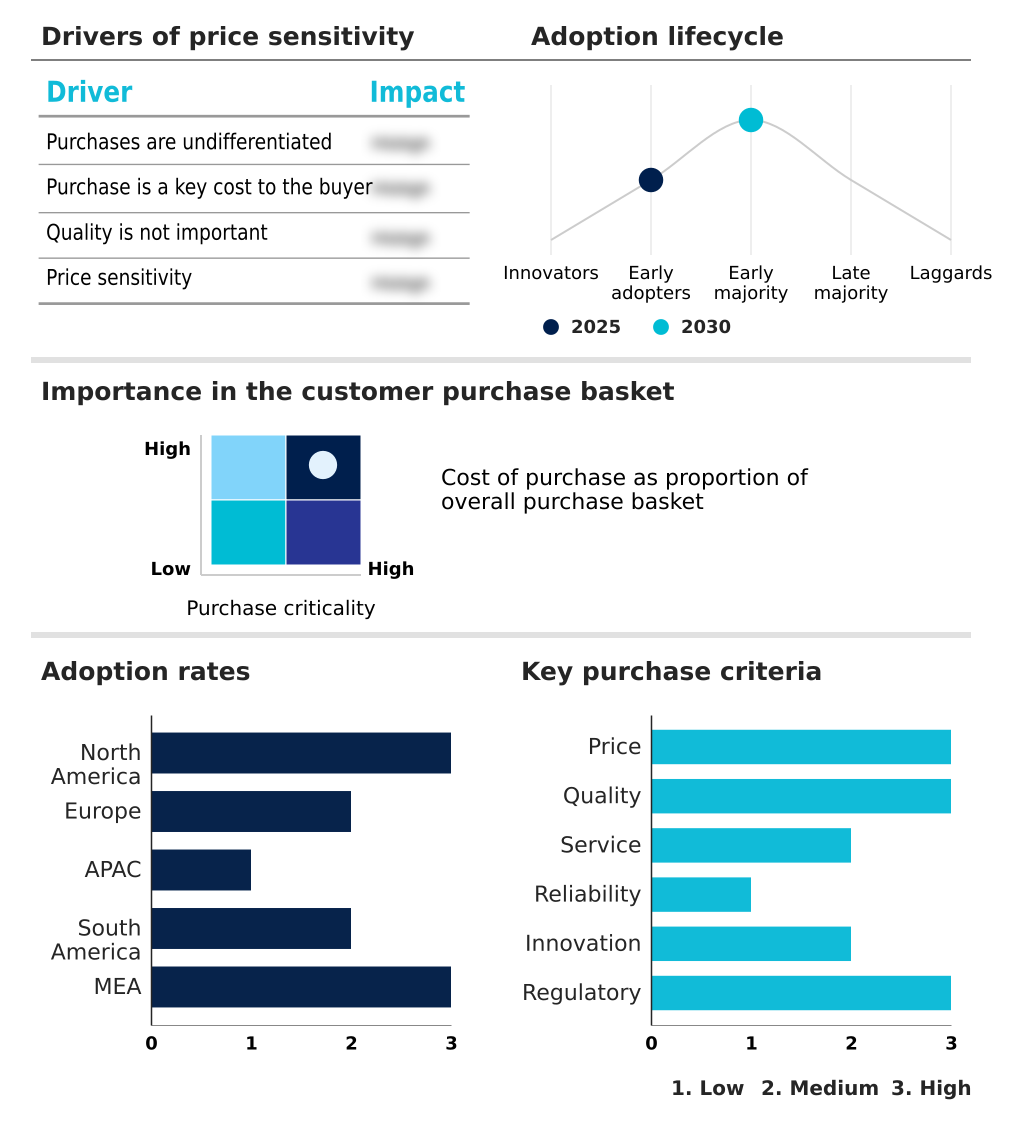
Exclusive Technavio Analysis on Customer Landscape

The calibration management software market forecasting report includes the adoption lifecycle of the market, covering from the innovator’s stage to the laggard’s stage. It focuses on adoption rates in different regions based on penetration. Furthermore, the calibration management software market report also includes key purchase criteria and drivers of price sensitivity to help companies evaluate and develop their market growth analysis strategies.

Customer Landscape of Calibration Management Software Industry

Competitive Landscape

Companies are implementing various strategies, such as strategic alliances, calibration management software market forecast, partnerships, mergers and acquisitions, geographical expansion, and product/service launches, to enhance their presence in the industry.

ACG Infotech Ltd. - Key offerings include integrated calibration management software with ERP and CRM functionalities, designed to support diverse industrial verticals through cloud-based and on-demand deployment models.

The industry research and growth report includes detailed analyses of the competitive landscape of the market and information about key companies, including:

  • ACG Infotech Ltd.
  • Ape Software Inc.
  • AVL List GmbH
  • Business Analysis Ltd.
  • CompuCal Calibration Solutions
  • CyberMetrics Corp.
  • Espresso Moon LLC
  • Fluke Corp.
  • Hexagon AB
  • Humpage Technology Ltd.
  • IndySoft Corp.
  • Nagman Instruments Pvt. Ltd.
  • P.J. Bonner and Co. Ltd.
  • Quality America Inc.
  • Qualityze Inc.
  • QUBYX Software Technologies
  • Sarlin Oy AB
  • TMA Systems

Qualitative and quantitative analysis of companies has been conducted to help clients understand the wider business environment as well as the strengths and weaknesses of key industry players. Data is qualitatively analyzed to categorize companies as pure play, category-focused, industry-focused, and diversified; it is quantitatively analyzed to categorize companies as dominant, leading, strong, tentative, and weak.

Recent Development and News in Calibration management software market

  • In August 2024, Ape Software Inc. announced the release of version 9.7.2 of its calibration control software, featuring enhancements for synchronized deployments and upgraded reporting components.
  • In October 2024, CompuCal Calibration Solutions announced a strategic partnership with Pharmagraph to digitize calibration programs, integrating its software to streamline workflows for environmental monitoring systems.
  • In January 2025, CyberMetrics Corp. expanded its GAGEtrak software with an advanced cloud-native module for Quality Event Management (QEM), offering a no-code solution for life science quality teams.
  • In February 2025, Fluke Corp. announced a major update to its calibration management platform, focusing on enhanced digital twin integration and seamless data flow with IIoT ecosystems for predictive maintenance.

Dive into Technavio’s robust research methodology, blending expert interviews, extensive data synthesis, and validated models for unparalleled Calibration Management Software Market insights. See full methodology.

Market Scope
Page number 289
Base year 2025
Historic period 2020-2024
Forecast period 2026-2030
Growth momentum & CAGR Accelerate at a CAGR of 3.9%
Market growth 2026-2030 USD 82.4 million
Market structure Fragmented
YoY growth 2025-2026(%) 3.7%
Key countries US, Canada, Mexico, Germany, UK, France, Italy, Spain, The Netherlands, Japan, China, India, South Korea, Australia, Indonesia, Brazil, Chile, Argentina, UAE, Saudi Arabia, South Africa, Egypt and Nigeria
Competitive landscape Leading Companies, Market Positioning of Companies, Competitive Strategies, and Industry Risks

Request Free Sample

Research Analyst Overview

  • The calibration management software market is evolving from a niche compliance tool into a strategic enterprise asset. Boardroom decisions are increasingly influenced by the need for a robust equipment lifecycle management strategy, where metrology software solutions are central.
  • An effective asset management system provides a unified instrument data repository, essential for both the traditional on-premise deployment model and the increasingly prevalent saas calibration solutions. The core functionality of modern calibration control software revolves around ensuring regulatory compliance reporting for standards like iso 17025 compliance and fda 21 cfr part 11.
  • This is achieved through features such as tamper-proof electronic records and rigorous audit trail management. Integrating these platforms via smart calibrator communication and cmms integration allows for sophisticated gauge management software. Organizations leverage these workflow automation tools for automated calibration scheduling and automatic calibration certificate generation, achieving a documented 30% reduction in audit preparation time.
  • Advanced platforms also incorporate predictive maintenance analytics and measurement uncertainty analysis, enabling proactive corrective and preventive actions. The availability of a mobile calibration application further extends the utility of cloud-based calibration, making instrument calibration management more efficient for field operations.

What are the Key Data Covered in this Calibration Management Software Market Research and Growth Report?

  • What is the expected growth of the Calibration Management Software Market between 2026 and 2030?

    • USD 82.4 million, at a CAGR of 3.9%

  • What segmentation does the market report cover?

    • The report is segmented by Technology (Locally installed, and Cloud-based), Application (Large enterprises, and Small and medium enterprises), End-user (Manufacturing, Healthcare, Pharmaceuticals, Aerospace and defense, and Others) and Geography (North America, Europe, APAC, South America, Middle East and Africa)

  • Which regions are analyzed in the report?

    • North America, Europe, APAC, South America and Middle East and Africa

  • What are the key growth drivers and market challenges?

    • Automation of calibration process, Threat of cyber-attacks

  • Who are the major players in the Calibration Management Software Market?

    • ACG Infotech Ltd., Ape Software Inc., AVL List GmbH, Business Analysis Ltd., CompuCal Calibration Solutions, CyberMetrics Corp., Espresso Moon LLC, Fluke Corp., Hexagon AB, Humpage Technology Ltd., IndySoft Corp., Nagman Instruments Pvt. Ltd., P.J. Bonner and Co. Ltd., Quality America Inc., Qualityze Inc., QUBYX Software Technologies, Sarlin Oy AB and TMA Systems

Market Research Insights

  • Market dynamics are increasingly shaped by the pursuit of operational excellence through advanced digital tools. The adoption of solutions focused on calibration workflow optimization is delivering tangible returns, with some firms reporting a 30% improvement in technician productivity.
  • Central to this shift is the emphasis on calibration data integrity, where the transition to digital calibration records has been shown to reduce documentation errors by over 40% compared to manual methods. Furthermore, robust quality management system integration enables automated equipment maintenance scheduling, reducing the risk of unplanned downtime due to out-of-tolerance instruments by as much as 25%.
  • This data-driven approach allows for strategic asset lifecycle tracking, ensuring both regulatory adherence and a higher return on asset investment.

We can help! Our analysts can customize this calibration management software market research report to meet your requirements.

Get in touch

1. Executive Summary

1.1 Market overview

Executive Summary - Chart on Market Overview
Executive Summary - Data Table on Market Overview
Executive Summary - Chart on Global Market Characteristics
Executive Summary - Chart on Market by Geography
Executive Summary - Chart on Market Segmentation by Technology
Executive Summary - Chart on Market Segmentation by Application
Executive Summary - Chart on Market Segmentation by End-user
Executive Summary - Chart on Incremental Growth
Executive Summary - Data Table on Incremental Growth
Executive Summary - Chart on Company Market Positioning

2. Technavio Analysis

2.1 Analysis of price sensitivity, lifecycle, customer purchase basket, adoption rates, and purchase criteria

2.2 Criticality of inputs and Factors of differentiation

Chart on Overview on criticality of inputs and factors of differentiation

2.3 Factors of disruption

Chart on Overview on factors of disruption

2.4 Impact of drivers and challenges

Chart on Impact of drivers and challenges in 2025 and 2030

3. Market Landscape

3.1 Market ecosystem

Chart on Parent Market
Data Table on - Parent Market

3.2 Market characteristics

Chart on Market characteristics analysis

3.3 Value chain analysis

Chart on Value chain analysis

4. Market Sizing

4.1 Market definition

Data Table on Offerings of companies included in the market definition

4.2 Market segment analysis

Market segments

4.3 Market size 2025

4.4 Market outlook: Forecast for 2025-2030

Chart on Global - Market size and forecast 2025-2030 ($ million)
Data Table on Global - Market size and forecast 2025-2030 ($ million)
Chart on Global Market: Year-over-year growth 2025-2030 (%)
Data Table on Global Market: Year-over-year growth 2025-2030 (%)

5. Historic Market Size

5.1 Global Calibration Management Software Market 2020 - 2024

Historic Market Size - Data Table on Global Calibration Management Software Market 2020 - 2024 ($ million)

5.2 Technology segment analysis 2020 - 2024

Historic Market Size - Technology Segment 2020 - 2024 ($ million)

5.3 Application segment analysis 2020 - 2024

Historic Market Size - Application Segment 2020 - 2024 ($ million)

5.4 End-user segment analysis 2020 - 2024

Historic Market Size - End-user Segment 2020 - 2024 ($ million)

5.5 Geography segment analysis 2020 - 2024

Historic Market Size - Geography Segment 2020 - 2024 ($ million)

5.6 Country segment analysis 2020 - 2024

Historic Market Size - Country Segment 2020 - 2024 ($ million)

6. Qualitative Analysis

6.1 Impact of AI on Global Calibration Management Software Market

7. Five Forces Analysis

7.1 Five forces summary

Five forces analysis - Comparison between 2025 and 2030

7.2 Bargaining power of buyers

Bargaining power of buyers - Impact of key factors 2025 and 2030

7.3 Bargaining power of suppliers

Bargaining power of suppliers - Impact of key factors in 2025 and 2030

7.4 Threat of new entrants

Threat of new entrants - Impact of key factors in 2025 and 2030

7.5 Threat of substitutes

Threat of substitutes - Impact of key factors in 2025 and 2030

7.6 Threat of rivalry

Threat of rivalry - Impact of key factors in 2025 and 2030

7.7 Market condition

Chart on Market condition - Five forces 2025 and 2030

8. Market Segmentation by Technology

8.1 Market segments

Chart on Technology - Market share 2025-2030 (%)
Data Table on Technology - Market share 2025-2030 (%)

8.2 Comparison by Technology

Chart on Comparison by Technology
Data Table on Comparison by Technology

8.3 Locally installed - Market size and forecast 2025-2030

Chart on Locally installed - Market size and forecast 2025-2030 ($ million)
Data Table on Locally installed - Market size and forecast 2025-2030 ($ million)
Chart on Locally installed - Year-over-year growth 2025-2030 (%)
Data Table on Locally installed - Year-over-year growth 2025-2030 (%)

8.4 Cloud-based - Market size and forecast 2025-2030

Chart on Cloud-based - Market size and forecast 2025-2030 ($ million)
Data Table on Cloud-based - Market size and forecast 2025-2030 ($ million)
Chart on Cloud-based - Year-over-year growth 2025-2030 (%)
Data Table on Cloud-based - Year-over-year growth 2025-2030 (%)

8.5 Market opportunity by Technology

Market opportunity by Technology ($ million)
Data Table on Market opportunity by Technology ($ million)

9. Market Segmentation by Application

9.1 Market segments

Chart on Application - Market share 2025-2030 (%)
Data Table on Application - Market share 2025-2030 (%)

9.2 Comparison by Application

Chart on Comparison by Application
Data Table on Comparison by Application

9.3 Large enterprises - Market size and forecast 2025-2030

Chart on Large enterprises - Market size and forecast 2025-2030 ($ million)
Data Table on Large enterprises - Market size and forecast 2025-2030 ($ million)
Chart on Large enterprises - Year-over-year growth 2025-2030 (%)
Data Table on Large enterprises - Year-over-year growth 2025-2030 (%)

9.4 Small and medium enterprises - Market size and forecast 2025-2030

Chart on Small and medium enterprises - Market size and forecast 2025-2030 ($ million)
Data Table on Small and medium enterprises - Market size and forecast 2025-2030 ($ million)
Chart on Small and medium enterprises - Year-over-year growth 2025-2030 (%)
Data Table on Small and medium enterprises - Year-over-year growth 2025-2030 (%)

9.5 Market opportunity by Application

Market opportunity by Application ($ million)
Data Table on Market opportunity by Application ($ million)

10. Market Segmentation by End-user

10.1 Market segments

Chart on End-user - Market share 2025-2030 (%)
Data Table on End-user - Market share 2025-2030 (%)

10.2 Comparison by End-user

Chart on Comparison by End-user
Data Table on Comparison by End-user

10.3 Manufacturing - Market size and forecast 2025-2030

Chart on Manufacturing - Market size and forecast 2025-2030 ($ million)
Data Table on Manufacturing - Market size and forecast 2025-2030 ($ million)
Chart on Manufacturing - Year-over-year growth 2025-2030 (%)
Data Table on Manufacturing - Year-over-year growth 2025-2030 (%)

10.4 Healthcare - Market size and forecast 2025-2030

Chart on Healthcare - Market size and forecast 2025-2030 ($ million)
Data Table on Healthcare - Market size and forecast 2025-2030 ($ million)
Chart on Healthcare - Year-over-year growth 2025-2030 (%)
Data Table on Healthcare - Year-over-year growth 2025-2030 (%)

10.5 Pharmaceuticals - Market size and forecast 2025-2030

Chart on Pharmaceuticals - Market size and forecast 2025-2030 ($ million)
Data Table on Pharmaceuticals - Market size and forecast 2025-2030 ($ million)
Chart on Pharmaceuticals - Year-over-year growth 2025-2030 (%)
Data Table on Pharmaceuticals - Year-over-year growth 2025-2030 (%)

10.6 Aerospace and defense - Market size and forecast 2025-2030

Chart on Aerospace and defense - Market size and forecast 2025-2030 ($ million)
Data Table on Aerospace and defense - Market size and forecast 2025-2030 ($ million)
Chart on Aerospace and defense - Year-over-year growth 2025-2030 (%)
Data Table on Aerospace and defense - Year-over-year growth 2025-2030 (%)

10.7 Others - Market size and forecast 2025-2030

Chart on Others - Market size and forecast 2025-2030 ($ million)
Data Table on Others - Market size and forecast 2025-2030 ($ million)
Chart on Others - Year-over-year growth 2025-2030 (%)
Data Table on Others - Year-over-year growth 2025-2030 (%)

10.8 Market opportunity by End-user

Market opportunity by End-user ($ million)
Data Table on Market opportunity by End-user ($ million)

11. Customer Landscape

11.1 Customer landscape overview

Analysis of price sensitivity, lifecycle, customer purchase basket, adoption rates, and purchase criteria

12. Geographic Landscape

12.1 Geographic segmentation

Chart on Market share by geography 2025-2030 (%)
Data Table on Market share by geography 2025-2030 (%)

12.2 Geographic comparison

Chart on Geographic comparison
Data Table on Geographic comparison

12.3 North America - Market size and forecast 2025-2030

Chart on North America - Market size and forecast 2025-2030 ($ million)
Data Table on North America - Market size and forecast 2025-2030 ($ million)
Chart on North America - Year-over-year growth 2025-2030 (%)
Data Table on North America - Year-over-year growth 2025-2030 (%)
Chart on Regional Comparison - North America
Data Table on Regional Comparison - North America

12.3.1 US - Market size and forecast 2025-2030

Chart on US - Market size and forecast 2025-2030 ($ million)
Data Table on US - Market size and forecast 2025-2030 ($ million)
Chart on US - Year-over-year growth 2025-2030 (%)
Data Table on US - Year-over-year growth 2025-2030 (%)

12.3.2 Canada - Market size and forecast 2025-2030

Chart on Canada - Market size and forecast 2025-2030 ($ million)
Data Table on Canada - Market size and forecast 2025-2030 ($ million)
Chart on Canada - Year-over-year growth 2025-2030 (%)
Data Table on Canada - Year-over-year growth 2025-2030 (%)

12.3.3 Mexico - Market size and forecast 2025-2030

Chart on Mexico - Market size and forecast 2025-2030 ($ million)
Data Table on Mexico - Market size and forecast 2025-2030 ($ million)
Chart on Mexico - Year-over-year growth 2025-2030 (%)
Data Table on Mexico - Year-over-year growth 2025-2030 (%)

12.4 Europe - Market size and forecast 2025-2030

Chart on Europe - Market size and forecast 2025-2030 ($ million)
Data Table on Europe - Market size and forecast 2025-2030 ($ million)
Chart on Europe - Year-over-year growth 2025-2030 (%)
Data Table on Europe - Year-over-year growth 2025-2030 (%)
Chart on Regional Comparison - Europe
Data Table on Regional Comparison - Europe

12.4.1 Germany - Market size and forecast 2025-2030

Chart on Germany - Market size and forecast 2025-2030 ($ million)
Data Table on Germany - Market size and forecast 2025-2030 ($ million)
Chart on Germany - Year-over-year growth 2025-2030 (%)
Data Table on Germany - Year-over-year growth 2025-2030 (%)

12.4.2 UK - Market size and forecast 2025-2030

Chart on UK - Market size and forecast 2025-2030 ($ million)
Data Table on UK - Market size and forecast 2025-2030 ($ million)
Chart on UK - Year-over-year growth 2025-2030 (%)
Data Table on UK - Year-over-year growth 2025-2030 (%)

12.4.3 France - Market size and forecast 2025-2030

Chart on France - Market size and forecast 2025-2030 ($ million)
Data Table on France - Market size and forecast 2025-2030 ($ million)
Chart on France - Year-over-year growth 2025-2030 (%)
Data Table on France - Year-over-year growth 2025-2030 (%)

12.4.4 Italy - Market size and forecast 2025-2030

Chart on Italy - Market size and forecast 2025-2030 ($ million)
Data Table on Italy - Market size and forecast 2025-2030 ($ million)
Chart on Italy - Year-over-year growth 2025-2030 (%)
Data Table on Italy - Year-over-year growth 2025-2030 (%)

12.4.5 Spain - Market size and forecast 2025-2030

Chart on Spain - Market size and forecast 2025-2030 ($ million)
Data Table on Spain - Market size and forecast 2025-2030 ($ million)
Chart on Spain - Year-over-year growth 2025-2030 (%)
Data Table on Spain - Year-over-year growth 2025-2030 (%)

12.4.6 The Netherlands - Market size and forecast 2025-2030

Chart on The Netherlands - Market size and forecast 2025-2030 ($ million)
Data Table on The Netherlands - Market size and forecast 2025-2030 ($ million)
Chart on The Netherlands - Year-over-year growth 2025-2030 (%)
Data Table on The Netherlands - Year-over-year growth 2025-2030 (%)

12.5 APAC - Market size and forecast 2025-2030

Chart on APAC - Market size and forecast 2025-2030 ($ million)
Data Table on APAC - Market size and forecast 2025-2030 ($ million)
Chart on APAC - Year-over-year growth 2025-2030 (%)
Data Table on APAC - Year-over-year growth 2025-2030 (%)
Chart on Regional Comparison - APAC
Data Table on Regional Comparison - APAC

12.5.1 Japan - Market size and forecast 2025-2030

Chart on Japan - Market size and forecast 2025-2030 ($ million)
Data Table on Japan - Market size and forecast 2025-2030 ($ million)
Chart on Japan - Year-over-year growth 2025-2030 (%)
Data Table on Japan - Year-over-year growth 2025-2030 (%)

12.5.2 China - Market size and forecast 2025-2030

Chart on China - Market size and forecast 2025-2030 ($ million)
Data Table on China - Market size and forecast 2025-2030 ($ million)
Chart on China - Year-over-year growth 2025-2030 (%)
Data Table on China - Year-over-year growth 2025-2030 (%)

12.5.3 India - Market size and forecast 2025-2030

Chart on India - Market size and forecast 2025-2030 ($ million)
Data Table on India - Market size and forecast 2025-2030 ($ million)
Chart on India - Year-over-year growth 2025-2030 (%)
Data Table on India - Year-over-year growth 2025-2030 (%)

12.5.4 South Korea - Market size and forecast 2025-2030

Chart on South Korea - Market size and forecast 2025-2030 ($ million)
Data Table on South Korea - Market size and forecast 2025-2030 ($ million)
Chart on South Korea - Year-over-year growth 2025-2030 (%)
Data Table on South Korea - Year-over-year growth 2025-2030 (%)

12.5.5 Australia - Market size and forecast 2025-2030

Chart on Australia - Market size and forecast 2025-2030 ($ million)
Data Table on Australia - Market size and forecast 2025-2030 ($ million)
Chart on Australia - Year-over-year growth 2025-2030 (%)
Data Table on Australia - Year-over-year growth 2025-2030 (%)

12.5.6 Indonesia - Market size and forecast 2025-2030

Chart on Indonesia - Market size and forecast 2025-2030 ($ million)
Data Table on Indonesia - Market size and forecast 2025-2030 ($ million)
Chart on Indonesia - Year-over-year growth 2025-2030 (%)
Data Table on Indonesia - Year-over-year growth 2025-2030 (%)

12.6 South America - Market size and forecast 2025-2030

Chart on South America - Market size and forecast 2025-2030 ($ million)
Data Table on South America - Market size and forecast 2025-2030 ($ million)
Chart on South America - Year-over-year growth 2025-2030 (%)
Data Table on South America - Year-over-year growth 2025-2030 (%)
Chart on Regional Comparison - South America
Data Table on Regional Comparison - South America

12.6.1 Brazil - Market size and forecast 2025-2030

Chart on Brazil - Market size and forecast 2025-2030 ($ million)
Data Table on Brazil - Market size and forecast 2025-2030 ($ million)
Chart on Brazil - Year-over-year growth 2025-2030 (%)
Data Table on Brazil - Year-over-year growth 2025-2030 (%)

12.6.2 Chile - Market size and forecast 2025-2030

Chart on Chile - Market size and forecast 2025-2030 ($ million)
Data Table on Chile - Market size and forecast 2025-2030 ($ million)
Chart on Chile - Year-over-year growth 2025-2030 (%)
Data Table on Chile - Year-over-year growth 2025-2030 (%)

12.6.3 Argentina - Market size and forecast 2025-2030

Chart on Argentina - Market size and forecast 2025-2030 ($ million)
Data Table on Argentina - Market size and forecast 2025-2030 ($ million)
Chart on Argentina - Year-over-year growth 2025-2030 (%)
Data Table on Argentina - Year-over-year growth 2025-2030 (%)

12.7 Middle East and Africa - Market size and forecast 2025-2030

Chart on Middle East and Africa - Market size and forecast 2025-2030 ($ million)
Data Table on Middle East and Africa - Market size and forecast 2025-2030 ($ million)
Chart on Middle East and Africa - Year-over-year growth 2025-2030 (%)
Data Table on Middle East and Africa - Year-over-year growth 2025-2030 (%)
Chart on Regional Comparison - Middle East and Africa
Data Table on Regional Comparison - Middle East and Africa

12.7.1 UAE - Market size and forecast 2025-2030

Chart on UAE - Market size and forecast 2025-2030 ($ million)
Data Table on UAE - Market size and forecast 2025-2030 ($ million)
Chart on UAE - Year-over-year growth 2025-2030 (%)
Data Table on UAE - Year-over-year growth 2025-2030 (%)

12.7.2 Saudi Arabia - Market size and forecast 2025-2030

Chart on Saudi Arabia - Market size and forecast 2025-2030 ($ million)
Data Table on Saudi Arabia - Market size and forecast 2025-2030 ($ million)
Chart on Saudi Arabia - Year-over-year growth 2025-2030 (%)
Data Table on Saudi Arabia - Year-over-year growth 2025-2030 (%)

12.7.3 South Africa - Market size and forecast 2025-2030

Chart on South Africa - Market size and forecast 2025-2030 ($ million)
Data Table on South Africa - Market size and forecast 2025-2030 ($ million)
Chart on South Africa - Year-over-year growth 2025-2030 (%)
Data Table on South Africa - Year-over-year growth 2025-2030 (%)

12.7.4 Egypt - Market size and forecast 2025-2030

Chart on Egypt - Market size and forecast 2025-2030 ($ million)
Data Table on Egypt - Market size and forecast 2025-2030 ($ million)
Chart on Egypt - Year-over-year growth 2025-2030 (%)
Data Table on Egypt - Year-over-year growth 2025-2030 (%)

12.7.5 Nigeria - Market size and forecast 2025-2030

Chart on Nigeria - Market size and forecast 2025-2030 ($ million)
Data Table on Nigeria - Market size and forecast 2025-2030 ($ million)
Chart on Nigeria - Year-over-year growth 2025-2030 (%)
Data Table on Nigeria - Year-over-year growth 2025-2030 (%)

12.8 Market opportunity by geography

Market opportunity by geography ($ million)
Data Tables on Market opportunity by geography ($ million)

13. Drivers, Challenges, and Opportunity

13.1 Market drivers

Automation of calibration process
Easy mobile accessibility of calibration management software
Integration of calibrators with maintenance management systems

13.2 Market challenges

Threat of cyber-attacks
High cost of software packages
Operational challenges associated with calibration management software

13.3 Impact of drivers and challenges

Impact of drivers and challenges in 2025 and 2030

13.4 Market opportunities

Increased focus on predictive maintenance and analytics
Outsourcing to third-party calibration management software service providers
Rising need for customization and scalability

14. Competitive Landscape

14.1 Overview

14.2

Overview on criticality of inputs and factors of differentiation

14.3 Landscape disruption

Overview on factors of disruption

14.4 Industry risks

Impact of key risks on business

15. Competitive Analysis

15.1 Companies profiled

Companies covered

15.2 Company ranking index

15.3 Market positioning of companies

Matrix on companies position and classification

15.4 ACG Infotech Ltd.

ACG Infotech Ltd. - Overview
ACG Infotech Ltd. - Product / Service
ACG Infotech Ltd. - Key offerings
SWOT

15.5 Ape Software Inc.

Ape Software Inc. - Overview
Ape Software Inc. - Product / Service
Ape Software Inc. - Key offerings
SWOT

15.6 AVL List GmbH

AVL List GmbH - Overview
AVL List GmbH - Product / Service
AVL List GmbH - Key offerings
SWOT

15.7 Business Analysis Ltd.

Business Analysis Ltd. - Overview
Business Analysis Ltd. - Product / Service
Business Analysis Ltd. - Key offerings
SWOT

15.8 CompuCal Calibration Solutions

CompuCal Calibration Solutions - Overview
CompuCal Calibration Solutions - Product / Service
CompuCal Calibration Solutions - Key offerings
SWOT

15.9 CyberMetrics Corp.

CyberMetrics Corp. - Overview
CyberMetrics Corp. - Product / Service
CyberMetrics Corp. - Key offerings
SWOT

15.10 Fluke Corp.

Fluke Corp. - Overview
Fluke Corp. - Product / Service
Fluke Corp. - Key offerings
SWOT

15.11 Hexagon AB

Hexagon AB - Overview
Hexagon AB - Business segments
Hexagon AB - Key news
Hexagon AB - Key offerings
Hexagon AB - Segment focus
SWOT

15.12 Humpage Technology Ltd.

Humpage Technology Ltd. - Overview
Humpage Technology Ltd. - Product / Service
Humpage Technology Ltd. - Key offerings
SWOT

15.13 IndySoft Corp.

IndySoft Corp. - Overview
IndySoft Corp. - Product / Service
IndySoft Corp. - Key offerings
SWOT

15.14 Nagman Instruments Pvt. Ltd.

Nagman Instruments Pvt. Ltd. - Overview
Nagman Instruments Pvt. Ltd. - Product / Service
Nagman Instruments Pvt. Ltd. - Key offerings
SWOT

15.15 P.J. Bonner and Co. Ltd.

P.J. Bonner and Co. Ltd. - Overview
P.J. Bonner and Co. Ltd. - Product / Service
P.J. Bonner and Co. Ltd. - Key offerings
SWOT

15.16 Quality America Inc.

Quality America Inc. - Overview
Quality America Inc. - Product / Service
Quality America Inc. - Key offerings
SWOT

15.17 Sarlin Oy AB

Sarlin Oy AB - Overview
Sarlin Oy AB - Product / Service
Sarlin Oy AB - Key offerings
SWOT

15.18 TMA Systems

TMA Systems - Overview
TMA Systems - Product / Service
TMA Systems - Key offerings
SWOT

16. Appendix

16.1 Scope of the report

Market definition
Objectives
Notes and caveats

16.2 Inclusions and exclusions checklist

Inclusions checklist
Exclusions checklist

16.3 Currency conversion rates for US$

16.4 Research methodology

16.5 Data procurement

Information sources

16.6 Data validation

16.7 Validation techniques employed for market sizing

16.8 Data synthesis

16.9 360 degree market analysis

16.10 List of abbreviations

Research Methodology

Technavio presents a detailed picture of the market by way of study, synthesis, and summation of data from multiple sources. The analysts have presented the various facets of the market with a particular focus on identifying the key industry influencers. The data thus presented is comprehensive, reliable, and the result of extensive research, both primary and secondary.

INFORMATION SOURCES

Primary sources

  • Manufacturers and suppliers
  • Channel partners
  • Industry experts
  • Strategic decision makers

Secondary sources

  • Industry journals and periodicals
  • Government data
  • Financial reports of key industry players
  • Historical data
  • Press releases

DATA ANALYSIS

Data Synthesis

  • Collation of data
  • Estimation of key figures
  • Analysis of derived insights

Data Validation

  • Triangulation with data models
  • Reference against proprietary databases
  • Corroboration with industry experts

REPORT WRITING

Qualitative

  • Market drivers
  • Market challenges
  • Market trends
  • Five forces analysis

Quantitative

  • Market size and forecast
  • Market segmentation
  • Geographical insights
  • Competitive landscape

Interested in this report?

Get your sample now to see our research methodology and insights!

Download Now

Frequently Asked Questions

Calibration Management Software market growth will increase by USD 82.4 million during 2026-2030.

The Calibration Management Software market is expected to grow at a CAGR of 3.9% during 2026-2030.

Calibration Management Software market is segmented by Technology (Locally installed, Cloud-based) Application (Large enterprises, Small and medium enterprises) End-user (Manufacturing, Healthcare, Pharmaceuticals, Aerospace and defense, Others)

ACG Infotech Ltd., Ape Software Inc., AVL List GmbH, Business Analysis Ltd., CompuCal Calibration Solutions, CyberMetrics Corp., Espresso Moon LLC, Fluke Corp., Hexagon AB, Humpage Technology Ltd., IndySoft Corp., Nagman Instruments Pvt. Ltd., P.J. Bonner and Co. Ltd., Quality America Inc., Qualityze Inc., QUBYX Software Technologies, Sarlin Oy AB, TMA Systems are a few of the key vendors in the Calibration Management Software market.

North America will register the highest growth rate of 37.4% among the other regions. Therefore, the Calibration Management Software market in North America is expected to garner significant business opportunities for the vendors during the forecast period.

US, Canada, Mexico, Germany, UK, France, Italy, Spain, The Netherlands, Japan, China, India, South Korea, Australia, Indonesia, Brazil, Chile, Argentina, UAE, Saudi Arabia, South Africa, Egypt, Nigeria

  • Automation of calibration process is the driving factor this market.

The Calibration Management Software market vendors should focus on grabbing business opportunities from the Technology segment as it accounted for the largest market share in the base year.
RIA - Research AI Assistant
Ask RIA