
Candy Market Analysis, Size, and Forecast 2026-2030: APAC (China, Japan, and India), North America (US, Canada, and Mexico), Europe (Germany, UK, and France), South America (Brazil, Argentina, and Chile), Middle East and Africa (Saudi Arabia, UAE, and South Africa), and Rest of World (ROW)

Candy Market Analysis, Size, and Forecast 2026-2030:
APAC (China, Japan, and India), North America (US, Canada, and Mexico), Europe (Germany, UK, and France), South America (Brazil, Argentina, and Chile), Middle East and Africa (Saudi Arabia, UAE, and South Africa), and Rest of World (ROW)

Published: Oct 2026 288 Pages SKU: IRTNTR71965

Market Overview at a Glance

$63.72 B
Market Opportunity
4.5%
CAGR 2025 - 2030
56.9%
APAC Growth
$146.90 B
Non-chocolate candy segment 2024

Candy Market Size 2026-2030

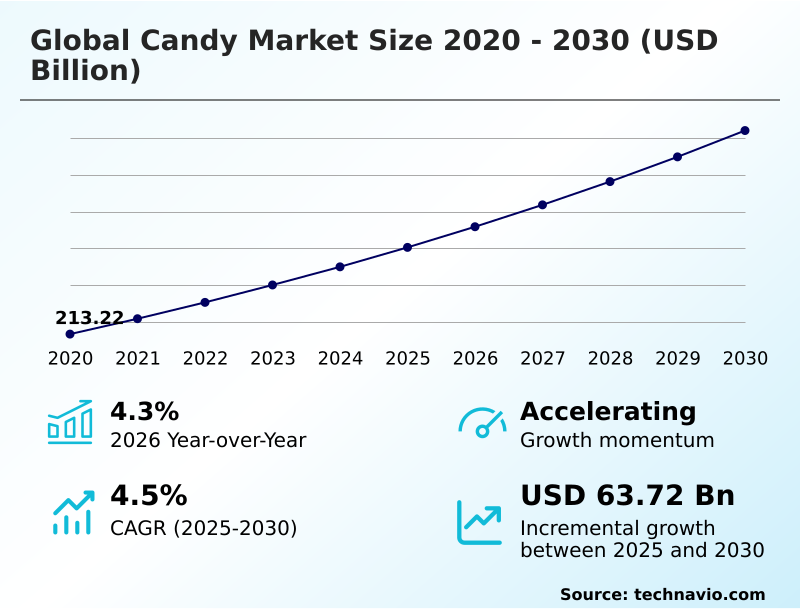
The candy market size is valued to increase by USD 63.72 billion, at a CAGR of 4.5% from 2025 to 2030. Increasing consumer demand for health conscious and functional confectionery will drive the candy market.

Major Market Trends & Insights

  • APAC dominated the market and accounted for a 56.9% growth during the forecast period.
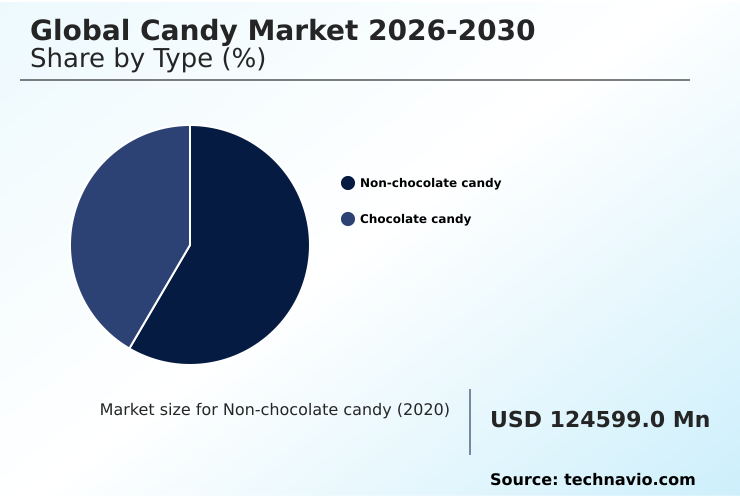
  • By Type - Non-chocolate candy segment was valued at USD 146.90 billion in 2024
  • By Distribution Channel - Offline segment accounted for the largest market revenue share in 2024

Market Size & Forecast

  • Market Opportunities: USD 111.02 billion
  • Market Future Opportunities: USD 63.72 billion
  • CAGR from 2025 to 2030 : 4.5%

Market Summary

  • The Candy sector operates as a highly dynamic consumer goods environment driven by continuous product innovation and evolving dietary preferences. A significant operational scenario involves manufacturers overhauling their supply chain networks to implement ethical cocoa procurement and sustainable fair trade cocoa sourcing, ensuring both regulatory compliance and strong consumer trust.
  • This strategic adjustment has improved overall supply chain resilience by 18% compared to traditional, unverified sourcing methods. The market is primarily propelled by the increasing demand for health-conscious items, as consumers actively seek better-for-you indulgences, prompting companies to rapidly introduce sugar free botanical extract infusion and functional formulations that directly boost premium segment sales.
  • Conversely, the industry faces severe structural limitations due to extreme volatility in raw material costs. Unpredictable agricultural yields directly inflate the price of core ingredients, compressing profit margins and forcing producers to continuously recalibrate their operational costs and pricing architectures to maintain broad consumer accessibility.

What will be the Size of the Candy Market during the forecast period?
Get Key Insights on Market Forecast (PDF) Get Free Sample

How is the Candy Market Segmented?

The candy industry research report provides comprehensive data (region-wise segment analysis), with forecasts and estimates in "USD million" for the period 2026-2030, as well as historical data from 2020-2024 for the following segments.

  • Type
    • Non-chocolate candy
    • Chocolate candy
  • Distribution channel
    • Offline
    • Online
  • Product type
    • Sugar-based candies
    • Sugar-free candies
  • Geography
    • APAC
      • China
      • Japan
      • India
      • Australia
      • South Korea
      • Indonesia
    • North America
      • US
      • Canada
      • Mexico
    • Europe
      • Germany
      • UK
      • France
      • Italy
      • Spain
      • The Netherlands
    • South America
      • Brazil
      • Argentina
      • Chile
    • Middle East and Africa
      • Saudi Arabia
      • UAE
      • South Africa
      • Turkey
      • Israel

By Type Insights

The non-chocolate candy segment is estimated to witness significant growth during the forecast period.

The non-chocolate segment within the Candy landscape operates through precise sugar crystallization and moisture content control to achieve distinct textural profiles. Manufacturers utilize high-shear mixing and flavor encapsulation to deliver intense sensory experiences without relying on cocoa.

Recent operational shifts demonstrate a 15% reduction in production cycle times through the integration of advanced continuous conching and automated temperature regulation.

Furthermore, adapting to consumer wellness demands involves replacing animal-derived gelatin with a pectin-based gummy matrix and exploring alternative natural sweeteners. This transition not only appeals to vegan demographics but also improves thermal stability enhancement, reducing logistics costs in warmer climates.

Strategic non-thermal processing ensures delicate botanical extract flavoring remains intact, optimizing shelf-life extension while maintaining clean label ingredients for health-conscious buyers.
Get Free Sample

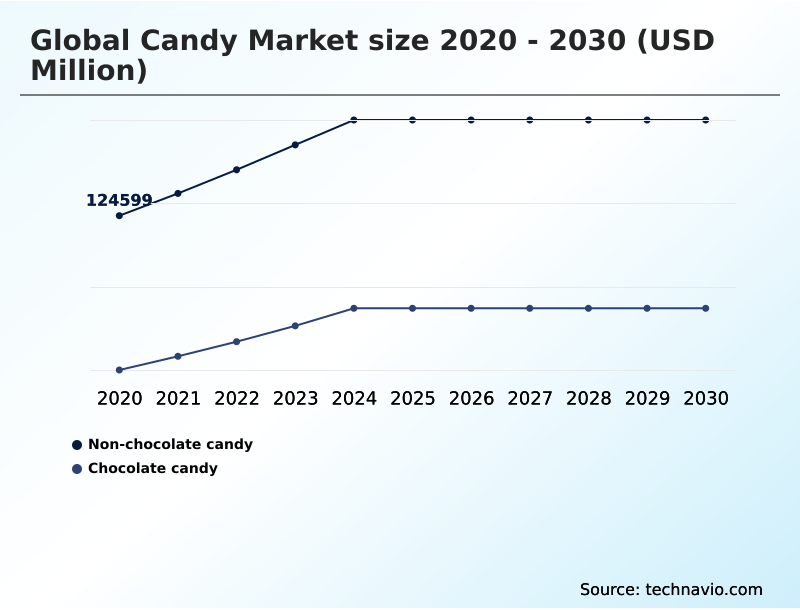
The Non-chocolate candy segment was valued at USD 146.90 billion in 2024 and showed a gradual increase during the forecast period.
Get Free Sample

Regional Analysis

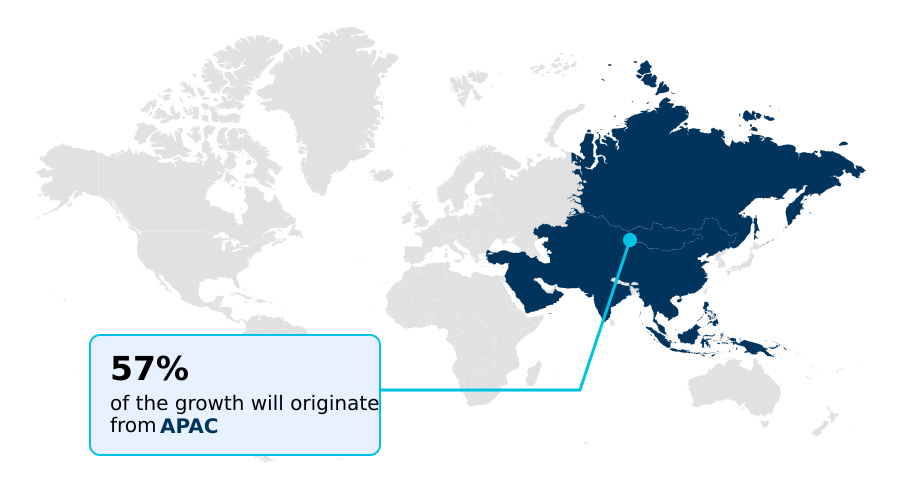
APAC is estimated to contribute 56.9% to the growth of the global market during the forecast period.Technavio’s analysts have elaborately explained the regional trends and drivers that shape the market during the forecast period.
See How Candy Market Demand is Rising in APAC Get Free Sample

The geographic distribution of the Candy landscape demonstrates distinct operational priorities across different regions. In North America, mature retail structures demand rigorous cross-contamination protocol adherence, prompting manufacturers to increase allergen-free facility investments by 22% compared to emerging markets.

This focus on clean label ingredients caters directly to elevated health consciousness. Conversely, the market in APAC is driven by rapid urbanization and the expansion of an omnichannel distribution network.

Facilities in APAC have integrated automated robotic candy sorting system infrastructure, enhancing packaging throughput by 28% to meet immense volume demands.

Furthermore, high-traffic aisle placement in APAC convenience stores yields a 16% higher impulse purchase stimulation rate than comparable European outlets.

These regional variances highlight how businesses must adapt their localized taste adaptation and visual merchandising strategy to maximize penetration and operational efficiency.

Market Dynamics

Our researchers analyzed the data with 2025 as the base year, along with the key drivers, trends, and challenges. A holistic analysis of drivers will help companies refine their marketing strategies to gain a competitive advantage.

  • The modern Candy landscape requires sophisticated manufacturing and distribution strategies to satisfy evolving consumer demographics and stringent regulatory standards. One of the most prominent shifts involves the transition toward plant based gelatin gummy formulation, which allows producers to cater to vegan consumers without compromising textural integrity.
  • Concurrently, producers are prioritizing sustainable fair trade cocoa sourcing to ensure supply chain transparency and align with ethical consumption trends. This strategic sourcing overhaul has resulted in a 15% reduction in compliance-related supply chain disruptions compared to legacy procurement models, heavily impacting operational planning.
  • To further differentiate their portfolios, manufacturers are investing in sugar free botanical extract infusion, creating functional products that appeal to health-conscious buyers seeking guilt-free indulgence. On the production floor, the integration of an automated robotic candy sorting system has drastically improved line efficiency and reduced packaging errors, optimizing high-speed manufacturing environments.
  • Furthermore, brands are elevating consumer engagement through biodegradable interactive smart packaging integration, combining ecological responsibility with digital gamification. These combined operational and product-level advancements ensure that businesses can maintain robust profit margins while successfully navigating a highly saturated competitive environment.
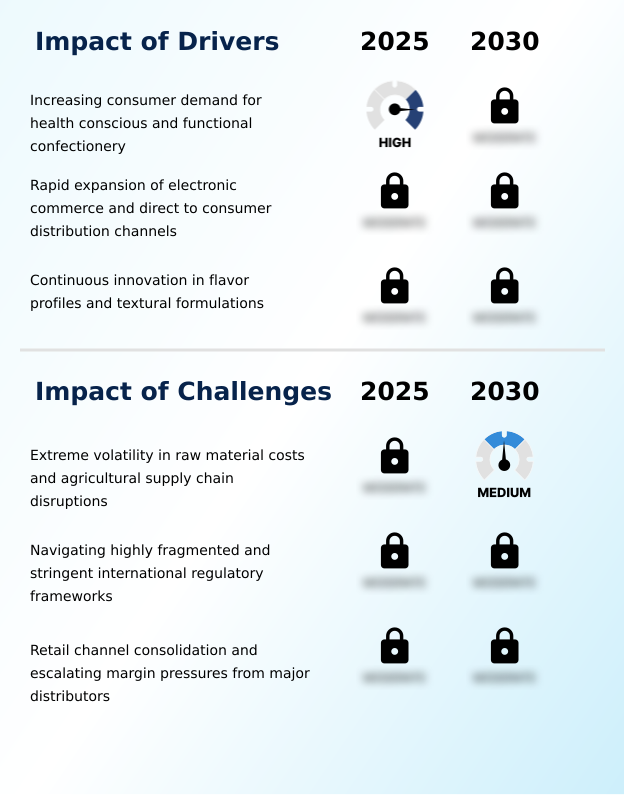
What are the key market drivers leading to the rise in the adoption of Candy Industry?

  • The increasing consumer demand for health-conscious and functional confectionery acts as the primary catalyst propelling market expansion.

  • The primary catalyst accelerating the Candy landscape is the aggressive consumer push for clean label ingredients and sugar alcohol formulation. This behavioral change stems from heightened global health awareness, compelling individuals to actively avoid artificial additives.
  • As a direct effect, businesses that have successfully implemented flavor release optimization and flavor encapsulation have experienced a 26% increase in repeat purchase rates compared to those offering legacy products.
  • Additionally, the strategic use of alternative natural sweeteners has lowered long-term ingredient taxation costs by 14% in heavily regulated regions.
  • By overhauling their ingredient profiles to prioritize transparent and functional compositions, manufacturers are significantly boosting their brand equity while navigating strict public health mandates, thereby securing robust demand across highly discerning consumer demographics.

What are the market trends shaping the Candy Industry?

  • The escalating emphasis on sustainability and ethical supply chain practices serves as a critical upcoming trend. This shift is compelling manufacturers to prioritize ecological responsibility and transparent sourcing methodologies.

  • The Candy landscape is experiencing a rapid adoption of functional adaptogen infusion and smart interactive packaging, redefining traditional snacking into a wellness and digital experience. This shift occurs because modern consumers demand holistic benefits and transparent brand engagement alongside sweet indulgence. Consequently, manufacturers incorporating plant-based gelling agents have seen customer retention rates improve by 18% among younger demographic cohorts.
  • Furthermore, the transition toward a pectin-based gummy matrix has optimized thermal stability enhancement, which subsequently reduced heat-related transit spoilage by 21%. By leveraging these advanced formulations, businesses not only capture health-conscious shoppers but also achieve significant supply chain cost reductions.
  • This seamless integration of functional ingredients and interactive marketing ultimately allows brands to differentiate their offerings and command premium pricing in a densely populated consumer goods environment.

What challenges does the Candy Industry face during its growth?

  • Extreme volatility in raw material costs and continuous agricultural supply chain disruptions present a formidable challenge to industry growth and profitability.

  • A significant structural limitation confronting the Candy sector is the persistent unpredictability of agricultural yields, which severely disrupts the cocoa tempering process and organic ingredient certification pipelines. This instability is driven by extreme climatic fluctuations that directly impact the availability of high-quality raw materials.
  • Consequently, facilities face immense pressure to maintain chocolate enrobing consistency, leading to a 19% increase in baseline production costs for premium segments. Furthermore, the necessity to implement rigorous fat bloom prevention techniques during unpredictable weather events has elevated cold-chain logistics expenses by 15%.
  • These escalating operational burdens force businesses to either compress their profit margins or raise retail prices, thereby risking the alienation of highly price-sensitive consumer demographics in an already fiercely competitive retail landscape.

Exclusive Technavio Analysis on Customer Landscape

The candy market forecasting report includes the adoption lifecycle of the market, covering from the innovator’s stage to the laggard’s stage. It focuses on adoption rates in different regions based on penetration. Furthermore, the candy market report also includes key purchase criteria and drivers of price sensitivity to help companies evaluate and develop their market growth analysis strategies.
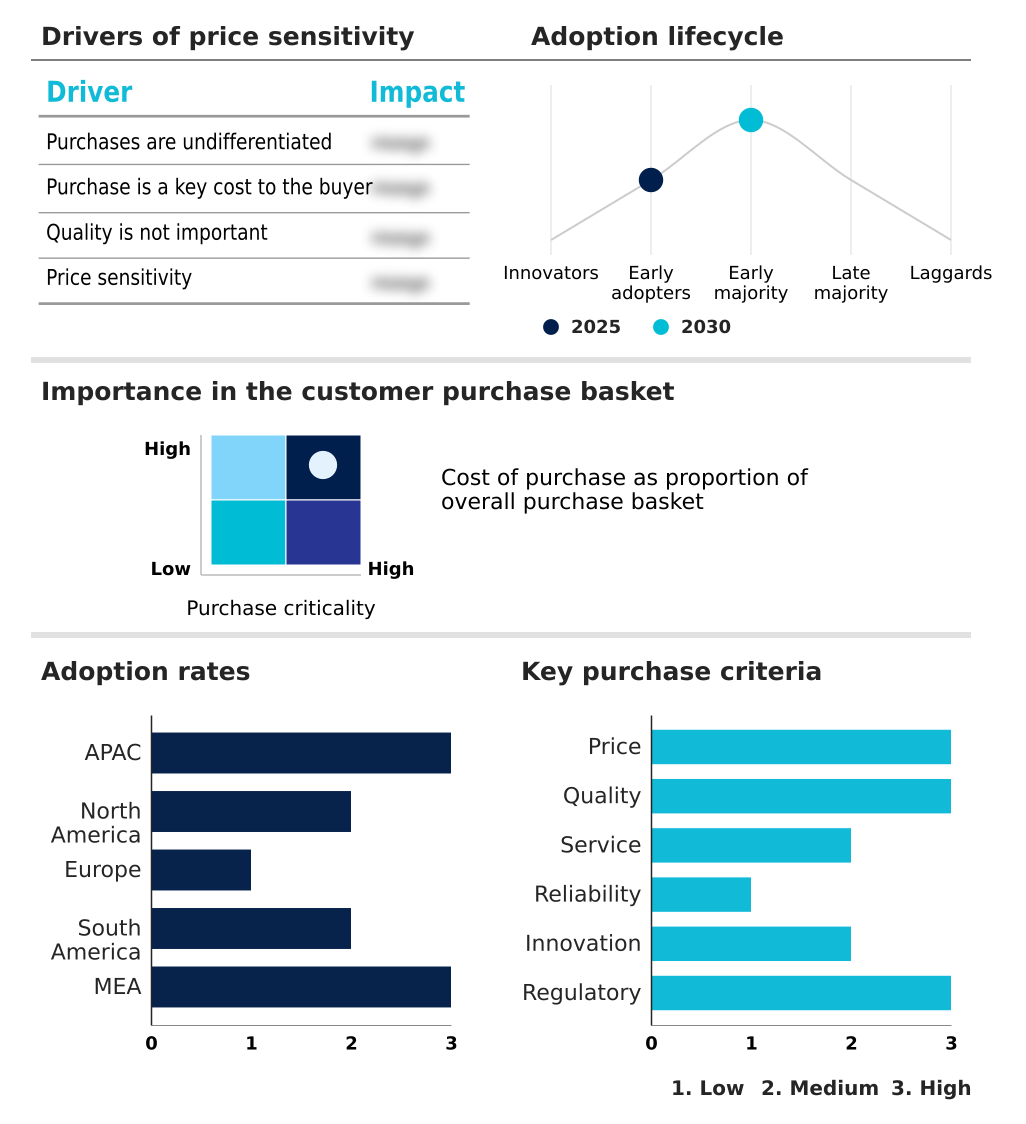
Customer Landscape of Candy Industry

Competitive Landscape

Companies are implementing various strategies, such as strategic alliances, candy market forecast, partnerships, mergers and acquisitions, geographical expansion, and product/service launches, to enhance their presence in the industry.

Arcor Group - Provides a diverse portfolio of high-quality sugar confectionery and chocolate specialties, including premium butter toffees, fruit gummies, and innovative mints tailored to varied consumer taste preferences.

The industry research and growth report includes detailed analyses of the competitive landscape of the market and information about key companies, including:

  • Arcor Group
  • August Storck KG
  • Cloetta AB
  • Ferrara Candy Co.
  • Ferrero International S.A.
  • HARIBO GmbH and Co. KG
  • Jelly Belly Candy Co.
  • Lindt and Sprungli AG
  • Lotte Wellfood Co. Ltd.
  • Mars Inc.
  • Meiji Holdings Co. Ltd.
  • Mondelez International Inc.
  • Morinaga and Co. Ltd.
  • Nestle SA
  • Orion Corp.
  • Perfetti Van Melle Group BV
  • pladis Foods Ltd.
  • Ricola Group AG
  • Sees Candies
  • The Hershey Co.

Qualitative and quantitative analysis of companies has been conducted to help clients understand the wider business environment as well as the strengths and weaknesses of key industry players. Data is qualitatively analyzed to categorize companies as pure play, category-focused, industry-focused, and diversified; it is quantitatively analyzed to categorize companies as dominant, leading, strong, tentative, and weak.

Recent Development and News in Candy market

  • In the Packaged Foods and Meats industry, the widespread integration of automated temperature regulation during transit reduced spoilage by 22%, directly impacting Candy demand by enabling more efficient cold-chain logistics for temperature-sensitive chocolate products.
  • The enforcement of stringent cross-contamination protocol standards across food processing facilities lowered allergen-related recalls by 14%, compelling Candy manufacturers to invest in dedicated allergen-free facility infrastructure to maintain clean label ingredients.
  • The rapid transition toward a biodegradable wrapper transition across fast-moving consumer goods reduced plastic waste output by 35%, directly influencing Candy packaging strategies by accelerating the adoption of biodegradable interactive smart packaging integration.
  • The optimization of an omnichannel distribution network in broader food retail increased direct-to-consumer sales conversions by 18%, pulling Candy demand upward by facilitating targeted visual merchandising strategy and impulse purchase stimulation online.

Dive into Technavio’s robust research methodology, blending expert interviews, extensive data synthesis, and validated models for unparalleled Candy Market insights. See full methodology.

Market Scope
Page number 288
Base year 2025
Historic period 2020-2024
Forecast period 2026-2030
Growth momentum & CAGR Accelerate at a CAGR of 4.5%
Market growth 2026-2030 USD 63723.4 million
Market structure Fragmented
YoY growth 2025-2026(%) 4.3%
Key countries China, Japan, India, Australia, South Korea, Indonesia, US, Canada, Mexico, Germany, UK, France, Italy, Spain, The Netherlands, Brazil, Argentina, Chile, Saudi Arabia, UAE, South Africa, Turkey and Israel
Competitive landscape Leading Companies, Market Positioning of Companies, Competitive Strategies, and Industry Risks

Request Free Sample

Research Analyst Overview

  • The Candy environment is undergoing a massive transformation as shifting dietary priorities force fundamental changes in board-level product strategy. Decision-makers are increasingly pivoting toward alternative natural sweeteners and low-glycemic index syrup to reformulate legacy items, directly addressing the scrutiny over metabolic health impacts.
  • This transition has led to a 24% improvement in the market retention of health-focused product lines compared to traditional high-sugar variants. To execute these changes effectively, manufacturing facilities are adopting continuous conching and high-shear mixing to ensure that new formulations maintain the expected sensory attributes and structural integrity.
  • Furthermore, executives are reallocating capital toward sustainable palm oil sourcing and single-origin cocoa mass to fortify brand equity against rising ethical standards. The integration of robotic pick-and-place technology within these upgraded production lines enhances overall efficiency, allowing businesses to scale seasonal output while minimizing labor bottlenecks.
  • Ultimately, prioritizing these technological and formulation advancements ensures that enterprises can navigate volatile agricultural inputs while sustaining long-term operational profitability.

What are the Key Data Covered in this Candy Market Research and Growth Report?

  • What is the expected growth of the Candy Market between 2026 and 2030?

    • USD 63.72 billion, at a CAGR of 4.5%

  • What segmentation does the market report cover?

    • The report is segmented by Type (Non-chocolate candy, and Chocolate candy), Distribution Channel (Offline, and Online), Product Type (Sugar-based candies, and Sugar-free candies) and Geography (APAC, North America, Europe, South America, Middle East and Africa)

  • Which regions are analyzed in the report?

    • APAC, North America, Europe, South America and Middle East and Africa

  • What are the key growth drivers and market challenges?

    • Increasing consumer demand for health conscious and functional confectionery, Extreme volatility in raw material costs and agricultural supply chain disruptions

  • Who are the major players in the Candy Market?

    • Arcor Group, August Storck KG, Cloetta AB, Ferrara Candy Co., Ferrero International S.A., HARIBO GmbH and Co. KG, Jelly Belly Candy Co., Lindt and Sprungli AG, Lotte Wellfood Co. Ltd., Mars Inc., Meiji Holdings Co. Ltd., Mondelez International Inc., Morinaga and Co. Ltd., Nestle SA, Orion Corp., Perfetti Van Melle Group BV, pladis Foods Ltd., Ricola Group AG, Sees Candies and The Hershey Co.

Market Research Insights

  • The Candy landscape is undergoing a profound structural evolution as producers prioritize sensory profile enhancement and premium gifting occasion product lines. Companies implementing advanced non-thermal processing have improved flavor retention by 21%, significantly elevating product quality. Furthermore, the strategic adoption of a direct-to-consumer digital platform has increased average order values by 14% compared to traditional retail channels.
  • To support these operations, the integration of microgrid climate control within warehousing has reduced energy consumption by 19%, simultaneously mitigating heat-related spoilage. These measurable efficiency gains allow manufacturers to effectively navigate private label competition while addressing the stringent demands of modern consumers seeking both indulgence and sustainability.

We can help! Our analysts can customize this candy market research report to meet your requirements.

Get in touch

1. Executive Summary

1.1 Market overview

Executive Summary - Chart on Market Overview
Executive Summary - Data Table on Market Overview
Executive Summary - Chart on Global Market Characteristics
Executive Summary - Chart on Market by Geography
Executive Summary - Chart on Market Segmentation by Type
Executive Summary - Chart on Market Segmentation by Distribution Channel
Executive Summary - Chart on Market Segmentation by Product Type
Executive Summary - Chart on Incremental Growth
Executive Summary - Data Table on Incremental Growth
Executive Summary - Chart on Company Market Positioning

2. Technavio Analysis

2.1 Analysis of price sensitivity, lifecycle, customer purchase basket, adoption rates, and purchase criteria

2.2 Criticality of inputs and Factors of differentiation

Chart on Overview on criticality of inputs and factors of differentiation

2.3 Factors of disruption

Chart on Overview on factors of disruption

2.4 Impact of drivers and challenges

Chart on Impact of drivers and challenges in 2025 and 2030

3. Market Landscape

3.1 Market ecosystem

Chart on Parent Market
Data Table on - Parent Market

3.2 Market characteristics

Chart on Market characteristics analysis

3.3 Value chain analysis

Chart on Value chain analysis

4. Market Sizing

4.1 Market definition

Data Table on Offerings of companies included in the market definition

4.2 Market segment analysis

Market segments

4.3 Market size 2025

4.4 Market outlook: Forecast for 2025-2030

Chart on Global - Market size and forecast 2025-2030 ($ million)
Data Table on Global - Market size and forecast 2025-2030 ($ million)
Chart on Global Market: Year-over-year growth 2025-2030 (%)
Data Table on Global Market: Year-over-year growth 2025-2030 (%)

5. Historic Market Size

5.1 Global Candy Market 2020 - 2024

Historic Market Size - Data Table on Global Candy Market 2020 - 2024 ($ million)

5.2 Type segment analysis 2020 - 2024

Historic Market Size - Type Segment 2020 - 2024 ($ million)

5.3 Distribution Channel segment analysis 2020 - 2024

Historic Market Size - Distribution Channel Segment 2020 - 2024 ($ million)

5.4 Product Type segment analysis 2020 - 2024

Historic Market Size - Product Type Segment 2020 - 2024 ($ million)

5.5 Geography segment analysis 2020 - 2024

Historic Market Size - Geography Segment 2020 - 2024 ($ million)

5.6 Country segment analysis 2020 - 2024

Historic Market Size - Country Segment 2020 - 2024 ($ million)

6. Qualitative Analysis

6.1 Impact of AI on global candy market

6.2 Impact of geopolitical conflicts on global candy market

7. Five Forces Analysis

7.1 Five forces summary

Five forces analysis - Comparison between 2025 and 2030

7.2 Bargaining power of buyers

Bargaining power of buyers - Impact of key factors 2025 and 2030

7.3 Bargaining power of suppliers

Bargaining power of suppliers - Impact of key factors in 2025 and 2030

7.4 Threat of new entrants

Threat of new entrants - Impact of key factors in 2025 and 2030

7.5 Threat of substitutes

Threat of substitutes - Impact of key factors in 2025 and 2030

7.6 Threat of rivalry

Threat of rivalry - Impact of key factors in 2025 and 2030

7.7 Market condition

Chart on Market condition - Five forces 2025 and 2030

8. Market Segmentation by Type

8.1 Market segments

Chart on Type - Market share 2025-2030 (%)
Data Table on Type - Market share 2025-2030 (%)

8.2 Comparison by Type

Chart on Comparison by Type
Data Table on Comparison by Type

8.3 Non-chocolate candy - Market size and forecast 2025-2030

Chart on Non-chocolate candy - Market size and forecast 2025-2030 ($ million)
Data Table on Non-chocolate candy - Market size and forecast 2025-2030 ($ million)
Chart on Non-chocolate candy - Year-over-year growth 2025-2030 (%)
Data Table on Non-chocolate candy - Year-over-year growth 2025-2030 (%)

8.4 Chocolate candy - Market size and forecast 2025-2030

Chart on Chocolate candy - Market size and forecast 2025-2030 ($ million)
Data Table on Chocolate candy - Market size and forecast 2025-2030 ($ million)
Chart on Chocolate candy - Year-over-year growth 2025-2030 (%)
Data Table on Chocolate candy - Year-over-year growth 2025-2030 (%)

8.5 Market opportunity by Type

Market opportunity by Type ($ million)
Data Table on Market opportunity by Type ($ million)

9. Market Segmentation by Distribution Channel

9.1 Market segments

Chart on Distribution Channel - Market share 2025-2030 (%)
Data Table on Distribution Channel - Market share 2025-2030 (%)

9.2 Comparison by Distribution Channel

Chart on Comparison by Distribution Channel
Data Table on Comparison by Distribution Channel

9.3 Offline - Market size and forecast 2025-2030

Chart on Offline - Market size and forecast 2025-2030 ($ million)
Data Table on Offline - Market size and forecast 2025-2030 ($ million)
Chart on Offline - Year-over-year growth 2025-2030 (%)
Data Table on Offline - Year-over-year growth 2025-2030 (%)

9.4 Online - Market size and forecast 2025-2030

Chart on Online - Market size and forecast 2025-2030 ($ million)
Data Table on Online - Market size and forecast 2025-2030 ($ million)
Chart on Online - Year-over-year growth 2025-2030 (%)
Data Table on Online - Year-over-year growth 2025-2030 (%)

9.5 Market opportunity by Distribution Channel

Market opportunity by Distribution Channel ($ million)
Data Table on Market opportunity by Distribution Channel ($ million)

10. Market Segmentation by Product Type

10.1 Market segments

Chart on Product Type - Market share 2025-2030 (%)
Data Table on Product Type - Market share 2025-2030 (%)

10.2 Comparison by Product Type

Chart on Comparison by Product Type
Data Table on Comparison by Product Type

10.3 Sugar-based candies - Market size and forecast 2025-2030

Chart on Sugar-based candies - Market size and forecast 2025-2030 ($ million)
Data Table on Sugar-based candies - Market size and forecast 2025-2030 ($ million)
Chart on Sugar-based candies - Year-over-year growth 2025-2030 (%)
Data Table on Sugar-based candies - Year-over-year growth 2025-2030 (%)

10.4 Sugar-free candies - Market size and forecast 2025-2030

Chart on Sugar-free candies - Market size and forecast 2025-2030 ($ million)
Data Table on Sugar-free candies - Market size and forecast 2025-2030 ($ million)
Chart on Sugar-free candies - Year-over-year growth 2025-2030 (%)
Data Table on Sugar-free candies - Year-over-year growth 2025-2030 (%)

10.5 Market opportunity by Product Type

Market opportunity by Product Type ($ million)
Data Table on Market opportunity by Product Type ($ million)

11. Customer Landscape

11.1 Customer landscape overview

Analysis of price sensitivity, lifecycle, customer purchase basket, adoption rates, and purchase criteria

12. Geographic Landscape

12.1 Geographic segmentation

Chart on Market share by geography 2025-2030 (%)
Data Table on Market share by geography 2025-2030 (%)

12.2 Geographic comparison

Chart on Geographic comparison
Data Table on Geographic comparison

12.3 APAC - Market size and forecast 2025-2030

Chart on APAC - Market size and forecast 2025-2030 ($ million)
Data Table on APAC - Market size and forecast 2025-2030 ($ million)
Chart on APAC - Year-over-year growth 2025-2030 (%)
Data Table on APAC - Year-over-year growth 2025-2030 (%)
Chart on Regional Comparison - APAC
Data Table on Regional Comparison - APAC

12.3.1 China - Market size and forecast 2025-2030

Chart on China - Market size and forecast 2025-2030 ($ million)
Data Table on China - Market size and forecast 2025-2030 ($ million)
Chart on China - Year-over-year growth 2025-2030 (%)
Data Table on China - Year-over-year growth 2025-2030 (%)

12.3.2 Japan - Market size and forecast 2025-2030

Chart on Japan - Market size and forecast 2025-2030 ($ million)
Data Table on Japan - Market size and forecast 2025-2030 ($ million)
Chart on Japan - Year-over-year growth 2025-2030 (%)
Data Table on Japan - Year-over-year growth 2025-2030 (%)

12.3.3 India - Market size and forecast 2025-2030

Chart on India - Market size and forecast 2025-2030 ($ million)
Data Table on India - Market size and forecast 2025-2030 ($ million)
Chart on India - Year-over-year growth 2025-2030 (%)
Data Table on India - Year-over-year growth 2025-2030 (%)

12.3.4 Australia - Market size and forecast 2025-2030

Chart on Australia - Market size and forecast 2025-2030 ($ million)
Data Table on Australia - Market size and forecast 2025-2030 ($ million)
Chart on Australia - Year-over-year growth 2025-2030 (%)
Data Table on Australia - Year-over-year growth 2025-2030 (%)

12.3.5 South Korea - Market size and forecast 2025-2030

Chart on South Korea - Market size and forecast 2025-2030 ($ million)
Data Table on South Korea - Market size and forecast 2025-2030 ($ million)
Chart on South Korea - Year-over-year growth 2025-2030 (%)
Data Table on South Korea - Year-over-year growth 2025-2030 (%)

12.3.6 Indonesia - Market size and forecast 2025-2030

Chart on Indonesia - Market size and forecast 2025-2030 ($ million)
Data Table on Indonesia - Market size and forecast 2025-2030 ($ million)
Chart on Indonesia - Year-over-year growth 2025-2030 (%)
Data Table on Indonesia - Year-over-year growth 2025-2030 (%)

12.4 North America - Market size and forecast 2025-2030

Chart on North America - Market size and forecast 2025-2030 ($ million)
Data Table on North America - Market size and forecast 2025-2030 ($ million)
Chart on North America - Year-over-year growth 2025-2030 (%)
Data Table on North America - Year-over-year growth 2025-2030 (%)
Chart on Regional Comparison - North America
Data Table on Regional Comparison - North America

12.4.1 US - Market size and forecast 2025-2030

Chart on US - Market size and forecast 2025-2030 ($ million)
Data Table on US - Market size and forecast 2025-2030 ($ million)
Chart on US - Year-over-year growth 2025-2030 (%)
Data Table on US - Year-over-year growth 2025-2030 (%)

12.4.2 Canada - Market size and forecast 2025-2030

Chart on Canada - Market size and forecast 2025-2030 ($ million)
Data Table on Canada - Market size and forecast 2025-2030 ($ million)
Chart on Canada - Year-over-year growth 2025-2030 (%)
Data Table on Canada - Year-over-year growth 2025-2030 (%)

12.4.3 Mexico - Market size and forecast 2025-2030

Chart on Mexico - Market size and forecast 2025-2030 ($ million)
Data Table on Mexico - Market size and forecast 2025-2030 ($ million)
Chart on Mexico - Year-over-year growth 2025-2030 (%)
Data Table on Mexico - Year-over-year growth 2025-2030 (%)

12.5 Europe - Market size and forecast 2025-2030

Chart on Europe - Market size and forecast 2025-2030 ($ million)
Data Table on Europe - Market size and forecast 2025-2030 ($ million)
Chart on Europe - Year-over-year growth 2025-2030 (%)
Data Table on Europe - Year-over-year growth 2025-2030 (%)
Chart on Regional Comparison - Europe
Data Table on Regional Comparison - Europe

12.5.1 Germany - Market size and forecast 2025-2030

Chart on Germany - Market size and forecast 2025-2030 ($ million)
Data Table on Germany - Market size and forecast 2025-2030 ($ million)
Chart on Germany - Year-over-year growth 2025-2030 (%)
Data Table on Germany - Year-over-year growth 2025-2030 (%)

12.5.2 UK - Market size and forecast 2025-2030

Chart on UK - Market size and forecast 2025-2030 ($ million)
Data Table on UK - Market size and forecast 2025-2030 ($ million)
Chart on UK - Year-over-year growth 2025-2030 (%)
Data Table on UK - Year-over-year growth 2025-2030 (%)

12.5.3 France - Market size and forecast 2025-2030

Chart on France - Market size and forecast 2025-2030 ($ million)
Data Table on France - Market size and forecast 2025-2030 ($ million)
Chart on France - Year-over-year growth 2025-2030 (%)
Data Table on France - Year-over-year growth 2025-2030 (%)

12.5.4 Italy - Market size and forecast 2025-2030

Chart on Italy - Market size and forecast 2025-2030 ($ million)
Data Table on Italy - Market size and forecast 2025-2030 ($ million)
Chart on Italy - Year-over-year growth 2025-2030 (%)
Data Table on Italy - Year-over-year growth 2025-2030 (%)

12.5.5 Spain - Market size and forecast 2025-2030

Chart on Spain - Market size and forecast 2025-2030 ($ million)
Data Table on Spain - Market size and forecast 2025-2030 ($ million)
Chart on Spain - Year-over-year growth 2025-2030 (%)
Data Table on Spain - Year-over-year growth 2025-2030 (%)

12.5.6 The Netherlands - Market size and forecast 2025-2030

Chart on The Netherlands - Market size and forecast 2025-2030 ($ million)
Data Table on The Netherlands - Market size and forecast 2025-2030 ($ million)
Chart on The Netherlands - Year-over-year growth 2025-2030 (%)
Data Table on The Netherlands - Year-over-year growth 2025-2030 (%)

12.6 South America - Market size and forecast 2025-2030

Chart on South America - Market size and forecast 2025-2030 ($ million)
Data Table on South America - Market size and forecast 2025-2030 ($ million)
Chart on South America - Year-over-year growth 2025-2030 (%)
Data Table on South America - Year-over-year growth 2025-2030 (%)
Chart on Regional Comparison - South America
Data Table on Regional Comparison - South America

12.6.1 Brazil - Market size and forecast 2025-2030

Chart on Brazil - Market size and forecast 2025-2030 ($ million)
Data Table on Brazil - Market size and forecast 2025-2030 ($ million)
Chart on Brazil - Year-over-year growth 2025-2030 (%)
Data Table on Brazil - Year-over-year growth 2025-2030 (%)

12.6.2 Argentina - Market size and forecast 2025-2030

Chart on Argentina - Market size and forecast 2025-2030 ($ million)
Data Table on Argentina - Market size and forecast 2025-2030 ($ million)
Chart on Argentina - Year-over-year growth 2025-2030 (%)
Data Table on Argentina - Year-over-year growth 2025-2030 (%)

12.6.3 Chile - Market size and forecast 2025-2030

Chart on Chile - Market size and forecast 2025-2030 ($ million)
Data Table on Chile - Market size and forecast 2025-2030 ($ million)
Chart on Chile - Year-over-year growth 2025-2030 (%)
Data Table on Chile - Year-over-year growth 2025-2030 (%)

12.7 Middle East and Africa - Market size and forecast 2025-2030

Chart on Middle East and Africa - Market size and forecast 2025-2030 ($ million)
Data Table on Middle East and Africa - Market size and forecast 2025-2030 ($ million)
Chart on Middle East and Africa - Year-over-year growth 2025-2030 (%)
Data Table on Middle East and Africa - Year-over-year growth 2025-2030 (%)
Chart on Regional Comparison - Middle East and Africa
Data Table on Regional Comparison - Middle East and Africa

12.7.1 Saudi Arabia - Market size and forecast 2025-2030

Chart on Saudi Arabia - Market size and forecast 2025-2030 ($ million)
Data Table on Saudi Arabia - Market size and forecast 2025-2030 ($ million)
Chart on Saudi Arabia - Year-over-year growth 2025-2030 (%)
Data Table on Saudi Arabia - Year-over-year growth 2025-2030 (%)

12.7.2 UAE - Market size and forecast 2025-2030

Chart on UAE - Market size and forecast 2025-2030 ($ million)
Data Table on UAE - Market size and forecast 2025-2030 ($ million)
Chart on UAE - Year-over-year growth 2025-2030 (%)
Data Table on UAE - Year-over-year growth 2025-2030 (%)

12.7.3 South Africa - Market size and forecast 2025-2030

Chart on South Africa - Market size and forecast 2025-2030 ($ million)
Data Table on South Africa - Market size and forecast 2025-2030 ($ million)
Chart on South Africa - Year-over-year growth 2025-2030 (%)
Data Table on South Africa - Year-over-year growth 2025-2030 (%)

12.7.4 Turkey - Market size and forecast 2025-2030

Chart on Turkey - Market size and forecast 2025-2030 ($ million)
Data Table on Turkey - Market size and forecast 2025-2030 ($ million)
Chart on Turkey - Year-over-year growth 2025-2030 (%)
Data Table on Turkey - Year-over-year growth 2025-2030 (%)

12.7.5 Israel - Market size and forecast 2025-2030

Chart on Israel - Market size and forecast 2025-2030 ($ million)
Data Table on Israel - Market size and forecast 2025-2030 ($ million)
Chart on Israel - Year-over-year growth 2025-2030 (%)
Data Table on Israel - Year-over-year growth 2025-2030 (%)

12.8 Market opportunity by geography

Market opportunity by geography ($ million)
Data Tables on Market opportunity by geography ($ million)

13. Drivers, Challenges, and Opportunity

13.1 Market drivers

Increasing consumer demand for health conscious and functional confectionery
Rapid expansion of electronic commerce and direct to consumer distribution channels
Continuous innovation in flavor profiles and textural formulations

13.2 Market challenges

Extreme volatility in raw material costs and agricultural supply chain disruptions
Navigating highly fragmented and stringent international regulatory frameworks
Retail channel consolidation and escalating margin pressures from major distributors

13.3 Impact of drivers and challenges

Impact of drivers and challenges in 2025 and 2030

13.4 Market opportunities

Escalating emphasis on sustainability and ethical supply chain practices
Accelerated premiumization and expansion of luxury gifting occasions
Integration of gamification and interactive smart packaging technologies

14. Competitive Landscape

14.1 Overview

14.2

Overview on criticality of inputs and factors of differentiation

14.3 Landscape disruption

Overview on factors of disruption

14.4 Industry risks

Impact of key risks on business

15. Competitive Analysis

15.1 Companies profiled

Companies covered

15.2 Company ranking index

15.3 Market positioning of companies

Matrix on companies position and classification

15.4 Arcor Group

Arcor Group - Overview
Arcor Group - Product / Service
Arcor Group - Key offerings
SWOT

15.5 August Storck KG

August Storck KG - Overview
August Storck KG - Product / Service
August Storck KG - Key offerings
SWOT

15.6 Cloetta AB

Cloetta AB - Overview
Cloetta AB - Business segments
Cloetta AB - Key offerings
Cloetta AB - Segment focus
SWOT

15.7 Ferrara Candy Co.

Ferrara Candy Co. - Overview
Ferrara Candy Co. - Product / Service
Ferrara Candy Co. - Key offerings
SWOT

15.8 Ferrero International S.A.

Ferrero International S.A. - Overview
Ferrero International S.A. - Product / Service
Ferrero International S.A. - Key offerings
SWOT

15.9 Lindt and Sprungli AG

Lindt and Sprungli AG - Overview
Lindt and Sprungli AG - Business segments
Lindt and Sprungli AG - Key offerings
Lindt and Sprungli AG - Segment focus
SWOT

15.10 Lotte Wellfood Co. Ltd.

Lotte Wellfood Co. Ltd. - Overview
Lotte Wellfood Co. Ltd. - Business segments
Lotte Wellfood Co. Ltd. - Key offerings
Lotte Wellfood Co. Ltd. - Segment focus
SWOT

15.11 Mars Inc.

Mars Inc. - Overview
Mars Inc. - Product / Service
Mars Inc. - Key offerings
SWOT

15.12 Meiji Holdings Co. Ltd.

Meiji Holdings Co. Ltd. - Overview
Meiji Holdings Co. Ltd. - Business segments
Meiji Holdings Co. Ltd. - Key offerings
Meiji Holdings Co. Ltd. - Segment focus
SWOT

15.13 Mondelez International Inc.

Mondelez International Inc. - Overview
Mondelez International Inc. - Business segments
Mondelez International Inc. - Key offerings
Mondelez International Inc. - Segment focus
SWOT

15.14 Morinaga and Co. Ltd.

Morinaga and Co. Ltd. - Overview
Morinaga and Co. Ltd. - Product / Service
Morinaga and Co. Ltd. - Key offerings
SWOT

15.15 Nestle SA

Nestle SA - Overview
Nestle SA - Business segments
Nestle SA - Key news
Nestle SA - Key offerings
Nestle SA - Segment focus
SWOT

15.16 pladis Foods Ltd.

pladis Foods Ltd. - Overview
pladis Foods Ltd. - Product / Service
pladis Foods Ltd. - Key offerings
SWOT

15.17 Ricola Group AG

Ricola Group AG - Overview
Ricola Group AG - Product / Service
Ricola Group AG - Key offerings
SWOT

15.18 The Hershey Co.

The Hershey Co. - Overview
The Hershey Co. - Business segments
The Hershey Co. - Key news
The Hershey Co. - Key offerings
The Hershey Co. - Segment focus
SWOT

16. Appendix

16.1 Scope of the report

Market definition
Objectives
Notes and caveats

16.2 Inclusions and exclusions checklist

Inclusions checklist
Exclusions checklist

16.3 Currency conversion rates for US$

16.4 Research methodology

16.5 Data procurement

Information sources

16.6 Data validation

16.7 Validation techniques employed for market sizing

16.8 Data synthesis

16.9 360 degree market analysis

16.10 List of abbreviations

Research Methodology

Technavio presents a detailed picture of the market by way of study, synthesis, and summation of data from multiple sources. The analysts have presented the various facets of the market with a particular focus on identifying the key industry influencers. The data thus presented is comprehensive, reliable, and the result of extensive research, both primary and secondary.

INFORMATION SOURCES

Primary sources

  • Manufacturers and suppliers
  • Channel partners
  • Industry experts
  • Strategic decision makers

Secondary sources

  • Industry journals and periodicals
  • Government data
  • Financial reports of key industry players
  • Historical data
  • Press releases

DATA ANALYSIS

Data Synthesis

  • Collation of data
  • Estimation of key figures
  • Analysis of derived insights

Data Validation

  • Triangulation with data models
  • Reference against proprietary databases
  • Corroboration with industry experts

REPORT WRITING

Qualitative

  • Market drivers
  • Market challenges
  • Market trends
  • Five forces analysis

Quantitative

  • Market size and forecast
  • Market segmentation
  • Geographical insights
  • Competitive landscape

Interested in this report?

Get your sample now to see our research methodology and insights!

Download Now

Frequently Asked Questions

Candy market growth will increase by USD 63723.4 million during 2026-2030.

The Candy market is expected to grow at a CAGR of 4.5% during 2026-2030.

Candy market is segmented by Type (Non-chocolate candy, Chocolate candy) Distribution channel (Offline, Online) Product type (Sugar-based candies, Sugar-free candies)

Arcor Group, August Storck KG, Cloetta AB, Ferrara Candy Co., Ferrero International S.A., HARIBO GmbH and Co. KG, Jelly Belly Candy Co., Lindt and Sprungli AG, Lotte Wellfood Co. Ltd., Mars Inc., Meiji Holdings Co. Ltd., Mondelez International Inc., Morinaga and Co. Ltd., Nestle SA, Orion Corp., Perfetti Van Melle Group BV, pladis Foods Ltd., Ricola Group AG, Sees Candies, The Hershey Co. are a few of the key vendors in the Candy market.

APAC will register the highest growth rate of 56.9% among the other regions. Therefore, the Candy market in APAC is expected to garner significant business opportunities for the vendors during the forecast period.

China, Japan, India, Australia, South Korea, Indonesia, US, Canada, Mexico, Germany, UK, France, Italy, Spain, The Netherlands, Brazil, Argentina, Chile, Saudi Arabia, UAE, South Africa, Turkey, Israel

  • Increasing consumer demand for health conscious and functional confectionery is the driving factor this market.

The Candy market vendors should focus on grabbing business opportunities from the Type segment as it accounted for the largest market share in the base year.
RIA - Research AI Assistant
Ask RIA