
Cargo Insurance Market Size and Growth Forecast 2026-2030
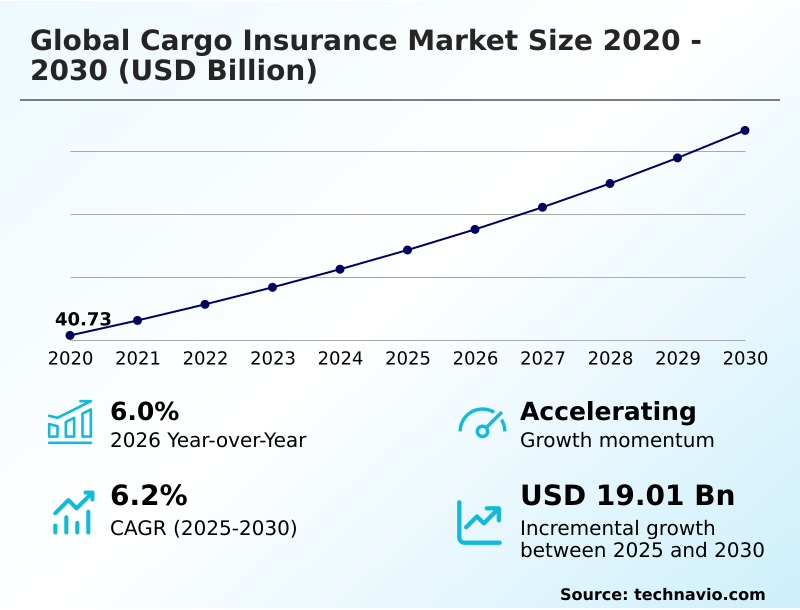
The Cargo Insurance Market size was valued at USD 54.32 billion in 2025 growing at a CAGR of 6.2% during the forecast period 2026-2030.
APAC accounts for 45.3% of incremental growth during the forecast period. The Marine cargo insurance segment by Service Type was valued at USD 25.81 billion in 2024, while the Containerized cargo segment holds the largest revenue share by Type.
The market is projected to grow by USD 32.61 billion from 2020 to 2030, with USD 19.01 billion of the growth expected during the forecast period of 2025 to 2030.
Get Key Insights on Market Forecast (PDF) Request Free Sample
Cargo Insurance Market Overview
The cargo insurance market is navigating a shift from reactive indemnity to proactive risk management, driven by the integration of advanced technology into global supply chains. With APAC poised to contribute approximately 45% of market growth, the demand for sophisticated coverage is intensifying. Insurers are leveraging IoT sensors and telematics to gain unprecedented supply chain visibility, enabling dynamic risk assessment for multimodal transport. This data-driven approach supports more accurate underwriting for an all-risks policy and streamlines claims management. For instance, a logistics firm managing cold chain logistics insurance for pharmaceuticals uses real-time cargo monitoring to maintain temperature integrity. A deviation triggers an immediate alert, allowing for intervention that prevents spoilage, thereby reducing potential claims and ensuring delivery of life-saving medicines. This transition to tech-enabled oversight is essential for maintaining supply chain resilience in the face of increasing geopolitical and environmental volatility, making specialized cargo coverage a critical strategic asset for global trade participants.
Drivers, Trends, and Challenges in the Cargo Insurance Market
The cargo insurance market is undergoing a significant digital transformation in cargo insurance, as stakeholders seek to manage complex risks and improve efficiency. Key to this evolution is the use of telematics data for land cargo insurance and IoT sensors in cold chain logistics, which provide granular data for underwriting high-value cargo shipments and insurance for perishable goods transit.
The adoption of blockchain for cargo chain of custody is enhancing security and creating transparent supply chain visibility solutions. However, this increased connectivity also introduces cybersecurity risks in marine insurance, which require new risk management for project cargo and other specialized freight.
Insurers are developing innovative products, such as parametric insurance for shipping delays, and leveraging AI in cargo insurance underwriting to model and price coverage for catastrophic weather events more accurately. A major focus is on managing accumulation risk in ports and ensuring compliance with Hague-Visby Rules.
For instance, a logistics provider using a new digital platform to manage an all-risks policy for containerized freight can reduce documentation errors by over 25% compared to manual processes.
This focus on technology is crucial for better fraud detection in cargo claims, effective general average claims process management, and navigating geopolitical risk assessment for shipping, all while aligning with ESG criteria in insurance underwriting and clarifying multimodal transport insurance liability.
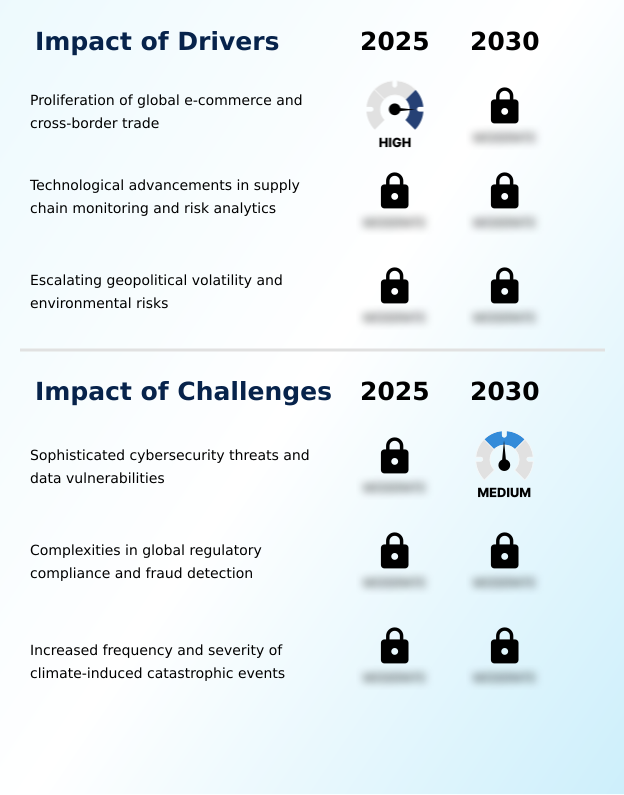
Primary Growth Driver: The proliferation of global e-commerce and cross-border trade is a key driver, increasing the volume and frequency of shipments requiring insurance coverage.
The rapid expansion of global e-commerce and increasing supply chain complexity are primary drivers. The shift from large-scale bulk shipments to high-frequency, smaller-value parcels necessitates more accessible and automated insurance solutions, such as last-mile delivery insurance.
Technological advancements provide insurers with tools for proactive risk management. The use of telematics in land cargo insurance and IoT sensors for real-time cargo monitoring allows for dynamic premium pricing and risk mitigation.
For instance, data shows air cargo insurance grew historically as businesses required faster transit for high-value goods.
This demand for enhanced protection and supply chain resilience is compelling shippers to seek comprehensive coverage, fueling market growth across all transport modes, including marine cargo insurance and multimodal transport.
Emerging Market Trend: The integration of blockchain technology and parametric insurance solutions is a key market trend, aimed at enhancing operational efficiency and transparency in claims processing.
A defining trend is the industry's pivot toward a proactive, data-centric model, where the market is set to grow at a year-over-year rate of 6.0%. This involves the deep integration of technology to enhance risk assessment and claims management.
The adoption of parametric insurance, triggered by verifiable data points from IoT sensors, allows for automated and faster payouts, bypassing traditional indemnity processes. Blockchain technology is being used to create immutable records for a bill of lading, significantly improving supply chain visibility and reducing fraud.
Furthermore, specialized solutions like cold chain logistics insurance are becoming more sophisticated with real-time cargo monitoring. These innovations are not just improving efficiency but also enabling the creation of more tailored all-risks policy structures that better reflect the specific risks of containerized cargo or project cargo in transit.
Key Industry Challenge: Sophisticated cybersecurity threats and data vulnerabilities present a significant challenge to the industry's growth and digital transformation.
The market faces significant challenges from the increasing sophistication of cyber-enabled theft and the escalating frequency of climate-induced catastrophic events. As logistics digitalize, vulnerabilities in supply chain software create opportunities for fraud detection failures and silent cyber risk, making it difficult for underwriters to price cyber-cargo insurance accurately.
Simultaneously, climate change is rendering historical data for risk assessment obsolete, leading to a higher accumulation risk in ports vulnerable to extreme weather. This is particularly concerning in high-growth regions like APAC, which, despite its rapid 7.3% CAGR, is prone to severe weather.
Insurers are compelled to develop advanced climate-induced risk modeling and invest in technologies that provide better supply chain visibility to navigate this volatile environment and maintain market stability.
Explore Full Market Dynamics Analysis Request Free Sample
Cargo Insurance Market Segmentation
The cargo insurance industry research report provides comprehensive data including region-wise segment analysis, with forecasts and analysis for the period 2026-2030, as well as historical data from 2020-2024 for the following segments.
Service Type Segment Analysis
The marine cargo insurance segment is estimated to witness significant growth during the forecast period.
The marine cargo insurance segment is foundational to global trade, addressing perils unique to maritime transport. This includes complex legal principles such as general average, where all stakeholders share costs to save a vessel, and providing indemnity against transit-related losses.
As global shipping confronts heightened geopolitical and climate-related volatility, the need for comprehensive maritime coverage remains high.
Underwriting practices are evolving with the integration of digital data exchange protocols, like those introduced by the International Union of Marine Insurance, to improve real-time risk assessment.
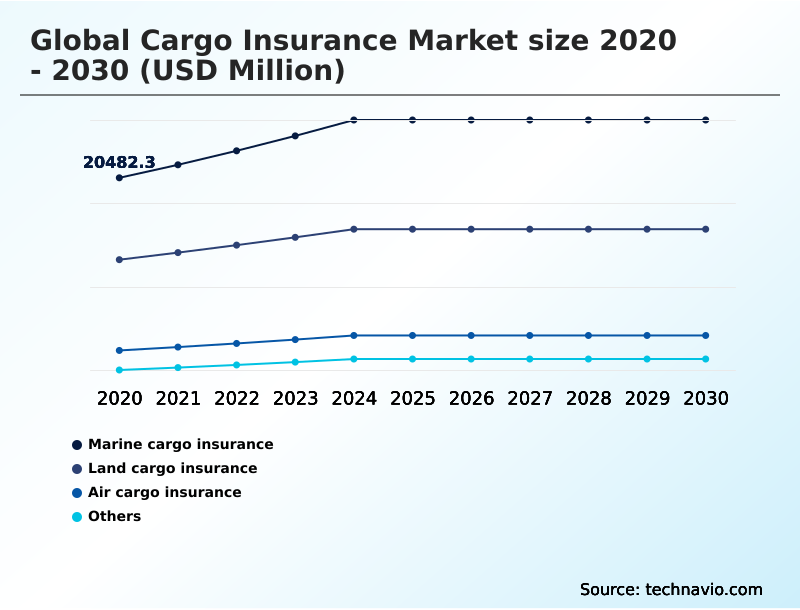
The segment's significance is underscored by its historical market value, which stood at over 25,814 million in 2024.
Insurers are also using IoT sensors to offer more precise terms for containerized cargo based on transit conditions, making proactive risk management a key focus.
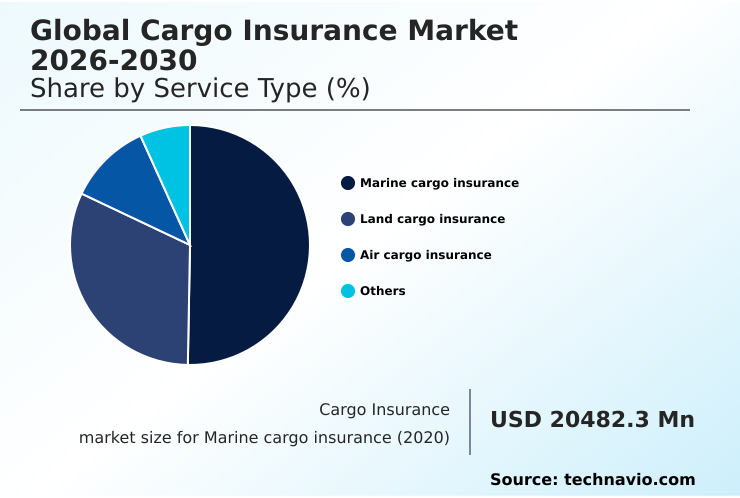
The Marine cargo insurance segment was valued at USD 25.81 billion in 2024 and showed a gradual increase during the forecast period.
Cargo Insurance Market by Region: APAC Leads with 45.3% Growth Share
APAC is estimated to contribute 45.3% to the growth of the global market during the forecast period.
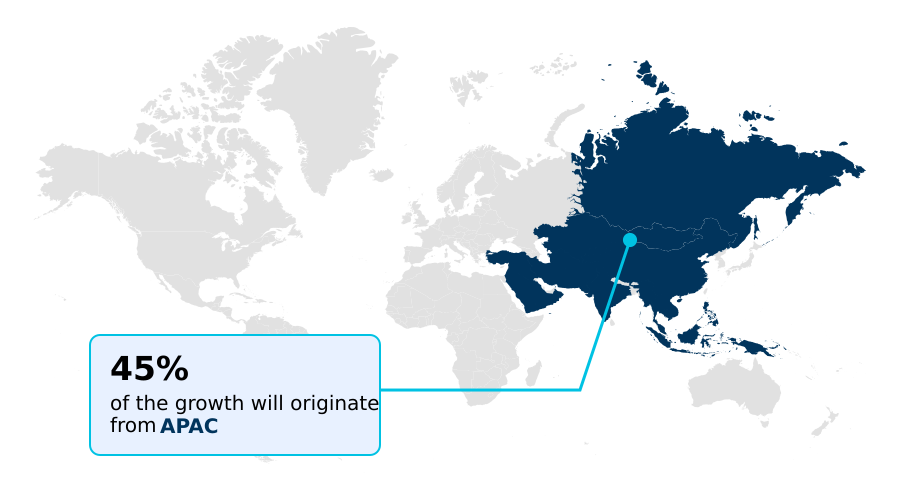
The geographic landscape is dominated by APAC, which accounts for over 45% of the market's incremental growth, driven by its status as a global manufacturing hub.
This high volume of trade necessitates robust digital freight solutions and sophisticated multimodal transport networks. In contrast, Europe, contributing over 23%, is characterized by a mature market focused on regulatory compliance and ESG in underwriting.
North America's market, which makes up nearly 20% of the growth, is driven by advanced logistics and the need for specialized cargo coverage for high-value goods.
Across all regions, geopolitical risk insurance is becoming a standard requirement, as disruptions in critical maritime corridors can impact supply chains globally. The effective management of these diverse regional risks is essential for insurers providing global coverage.
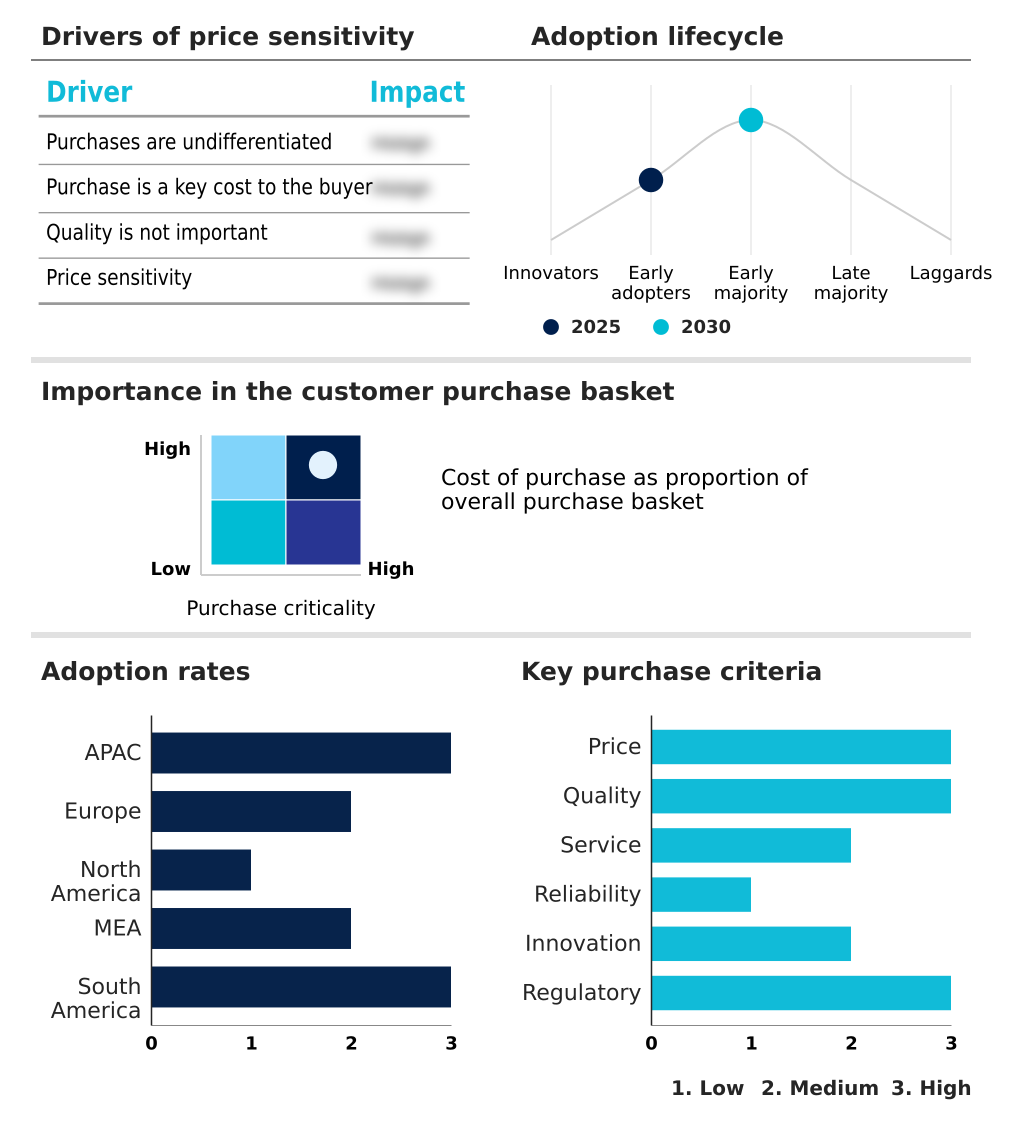
Customer Landscape Analysis for the Cargo Insurance Market
The cargo insurance market forecasting report includes the adoption lifecycle of the market, covering from the innovator’s stage to the laggard’s stage. It focuses on adoption rates in different regions based on penetration. Furthermore, the cargo insurance market report also includes key purchase criteria and drivers of price sensitivity to help companies evaluate and develop their market growth analysis strategies.
Competitive Landscape of the Cargo Insurance Market
Companies are implementing various strategies, such as strategic alliances, partnerships, mergers and acquisitions, geographical expansion, and product/service launches, to enhance their presence in the cargo insurance market industry.
Allianz SE - Vendors offer specialized cargo coverage, including all-risks policies and tailored solutions for international trade, focusing on risk mitigation and financial indemnity for goods in transit.
The industry research and growth report includes detailed analyses of the competitive landscape of the market and information about key companies, including:
- Allianz SE
- American International Group
- AP Moller Maersk AS
- Assicurazioni Generali S.p.A
- AXA XL
- Berkshire Hathaway Insurance
- Chubb Ltd.
- CNA Financial Corp.
- Liberty Mutual Holding Co. Inc.
- Lloyds and Corp.
- Markel Corp.
- Munich Reinsurance Co.
- QBE Insurance Group Ltd.
- Starr International Co. Inc.
- Swiss Re Ltd.
- The Travelers Co. Inc.
- Tokio Marine Holdings Inc.
- TT Club Mutual Insurance N.V.
- UPS Capital Corp.
- Zurich Insurance Co. Ltd.
Qualitative and quantitative analysis of companies has been conducted to help clients understand the wider business environment as well as the strengths and weaknesses of key industry players. Data is qualitatively analyzed to categorize companies as pure play, category-focused, industry-focused, and diversified; it is quantitatively analyzed to categorize companies as dominant, leading, strong, tentative, and weak.
Recent Developments in the Cargo Insurance Market
- In May 2025, Zurich Insurance Group announced a strategic collaboration with a leading satellite imagery provider to enhance maritime loss assessment through high-resolution terminal monitoring.
- In May 2025, the shipping company Hapag-Lloyd implemented a mandatory real-time monitoring system for all high-value containerized pharmaceutical shipments to ensure temperature stability and physical security.
- In April 2025, Allianz Global Corporate and Specialty launched a comprehensive direct-to-customer digital portal specifically for small and medium enterprises engaged in international trade, allowing these businesses to purchase and manage cargo policies without an agent.
- In March 2025, the shipping company Mitsui O.S.K. Lines implemented a comprehensive carbon-intensity monitoring dashboard that provides real-time emissions data directly to its panel of insurance providers.
Research Analyst Overview: Cargo Insurance Market
The cargo insurance market is fundamentally reshaping from a reactive to a proactive model, where data-driven risk assessment is paramount. The integration of technology, including telematics and IoT sensors, is creating a new paradigm for underwriting, moving beyond historical data to real-time analysis.
Boardroom decisions now center on CAPEX for enhanced supply chain visibility to meet stringent regulatory compliance frameworks like Solvency II, which demand robust capital reserves against catastrophic events. Insurers are deploying blockchain for immutable bills of lading and leveraging parametric insurance triggers to automate claims management.
This shift is critical for covering everything from containerized cargo and project cargo to specialized air cargo insurance. For example, a shipper of liquid bulk cargo can now use real-time monitoring to secure better terms on an all-risks policy, demonstrating effective risk mitigation.
The challenge of cyber-enabled theft and fraud detection remains, but the focus on digital solutions and indemnity is transforming how general average and multimodal transport risks are handled.
Dive into Technavio’s robust research methodology, blending expert interviews, extensive data synthesis, and validated models for unparalleled Cargo Insurance Market insights. See full methodology.
| Market Scope | |
|---|---|
| Page number | 307 |
| Base year | 2025 |
| Historic period | 2020-2024 |
| Forecast period | 2026-2030 |
| Growth momentum & CAGR | Accelerate at a CAGR of 6.2% |
| Market growth 2026-2030 | USD 19014.9 million |
| Market structure | Fragmented |
| YoY growth 2025-2026(%) | 6.0% |
| Key countries | China, Japan, India, South Korea, Australia, Indonesia, Germany, UK, France, Italy, The Netherlands, Spain, US, Canada, Mexico, Saudi Arabia, UAE, South Africa, Egypt, Turkey, Brazil, Argentina and Colombia |
| Competitive landscape | Leading Companies, Market Positioning of Companies, Competitive Strategies, and Industry Risks |
Cargo Insurance Market: Key Questions Answered in This Report
-
What is the expected growth of the Cargo Insurance Market between 2026 and 2030?
-
The Cargo Insurance Market is expected to grow by USD 19.01 billion during 2026-2030, registering a CAGR of 6.2%. Year-over-year growth in 2026 is estimated at 6.0%%. This acceleration is shaped by proliferation of global e-commerce and cross-border trade, which is intensifying demand across multiple end-use verticals covered in the report.
-
-
What segmentation does the market report cover?
-
The report is segmented by Service Type (Marine cargo insurance, Land cargo insurance, Air cargo insurance, and Others), Type (Containerized cargo, Dry bulk cargo, Liquid bulk cargo, and Project cargo), Distribution Channel (Indirect, and Direct) and Geography (APAC, Europe, North America, Middle East and Africa, South America). Among these, the Marine cargo insurance segment is estimated to witness significant growth during the forecast period, driven by rising adoption across key application areas. Each segment includes detailed qualitative and quantitative analysis, along with historical data from 2020-2024 and forecasts through 2030 with year-over-year growth rates.
-
-
Which regions are analyzed in the report?
-
The report covers APAC, Europe, North America, Middle East and Africa and South America. APAC is estimated to contribute 45.3% to market growth during the forecast period. Country-level analysis includes China, Japan, India, South Korea, Australia, Indonesia, Germany, UK, France, Italy, The Netherlands, Spain, US, Canada, Mexico, Saudi Arabia, UAE, South Africa, Egypt, Turkey, Brazil, Argentina and Colombia, with dedicated market size tables and year-over-year growth for each.
-
-
What are the key growth drivers and market challenges?
-
The primary driver is proliferation of global e-commerce and cross-border trade, which is accelerating investment and industry demand. The main challenge is sophisticated cybersecurity threats and data vulnerabilities, creating operational barriers for key market participants. The report quantifies the impact of each driver and challenge across 2026 and 2030 with comparative analysis.
-
-
Who are the major players in the Cargo Insurance Market?
-
Key vendors include Allianz SE, American International Group, AP Moller Maersk AS, Assicurazioni Generali S.p.A, AXA XL, Berkshire Hathaway Insurance, Chubb Ltd., CNA Financial Corp., Liberty Mutual Holding Co. Inc., Lloyds and Corp., Markel Corp., Munich Reinsurance Co., QBE Insurance Group Ltd., Starr International Co. Inc., Swiss Re Ltd., The Travelers Co. Inc., Tokio Marine Holdings Inc., TT Club Mutual Insurance N.V., UPS Capital Corp. and Zurich Insurance Co. Ltd.. The report provides qualitative and quantitative analysis categorizing companies as dominant, leading, strong, tentative, and weak based on their market positioning. Company profiles include business segment analysis, SWOT assessment, key offerings, and recent strategic developments.
-
Cargo Insurance Market Research Insights
Market dynamics are increasingly shaped by the need for enhanced supply chain resilience, with a year-over-year growth of 6.0% highlighting the rising demand for comprehensive protection. Shippers are navigating complex international frameworks like the Hague-Visby Rules, which define carrier liability and create a need for robust insurance solutions.
The adoption of predictive risk analytics is becoming standard for mitigating losses, particularly for high-value containerized cargo. For example, in cold chain logistics insurance, data from IoT sensors is used for real-time cargo monitoring, ensuring that temperature-sensitive pharmaceuticals are not compromised during transit.
This move toward data-driven, proactive risk management allows insurers to offer more specialized cargo coverage while helping clients strengthen their operational continuity in a volatile global trade environment.
We can help! Our analysts can customize this cargo insurance market research report to meet your requirements.
 RIA -
RIA - 
