Cementless Total Knee Arthroplasty Market Size 2025-2029
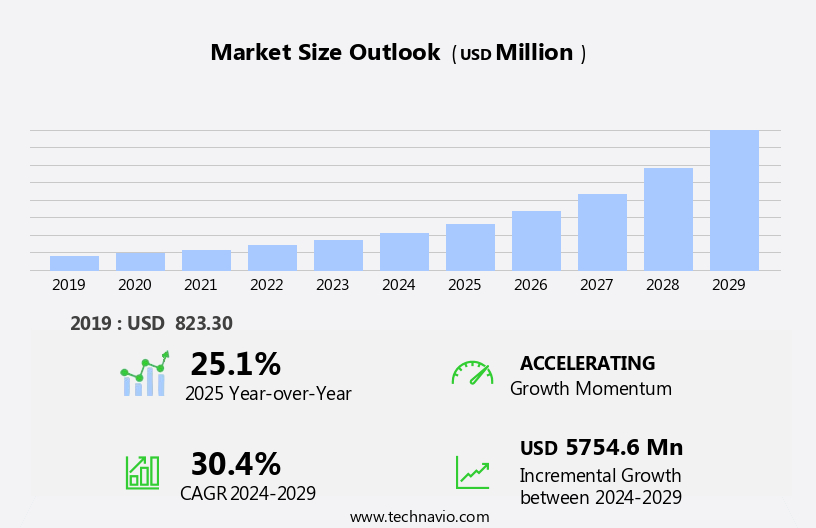
The cementless total knee arthroplasty market size is forecast to increase by USD 5.75 billion, at a CAGR of 30.4% between 2024 and 2029.
- The Cementless Total Knee Arthroplasty (TKA) market is experiencing significant growth, driven by the increasing number of people diagnosed with arthritis and the rising trend of outpatient knee replacement surgeries. These factors are expanding the patient pool for cementless TKA procedures, which offer several advantages over traditional cemented implants, such as improved bone preservation and faster recovery times. However, the high cost of cementless TKA remains a notable challenge for both patients and healthcare providers. This cost barrier may limit the market's growth potential and necessitate the exploration of cost-effective manufacturing methods and alternative financing options.
- To capitalize on the market's opportunities and navigate these challenges effectively, industry players should focus on innovation, cost reduction strategies, and collaborations to enhance their competitive position and cater to the evolving needs of patients and healthcare systems.
What will be the Size of the Cementless Total Knee Arthroplasty Market during the forecast period?
Explore in-depth regional segment analysis with market size data - historical 2019-2023 and forecasts 2025-2029 - in the full report.
Request Free Sample
The market continues to evolve, driven by advancements in biocompatible materials, hinge design, and regulatory standards. Healthcare utilization for total knee replacement (TKR) is on the rise, particularly among the geriatric population, due to the improvement in quality of life and functional outcomes. Implant wear remains a concern, leading to the development of new materials and technologies. Biomedical engineering innovations, such as cruciate-substituting and cruciate-retaining designs, offer enhanced knee stability and range of motion. The role of physical therapy in postoperative rehabilitation is increasingly recognized as crucial for optimal patient outcomes. Ce marking and regulatory standards ensure the safety and efficacy of knee implants, while infection prevention and pain management remain key areas of focus.
Knee deformity and periprosthetic fracture are common complications, necessitating ongoing research and development in this field. The role of evidence-based medicine and surgical expertise in TKR is paramount, with preoperative planning and hospital accreditation essential for successful outcomes. Computer-assisted surgery and navigation systems are transforming the surgical landscape, offering increased precision and accuracy. Material science continues to advance, with the development of new bone cement alternatives and the exploration of bone stock preservation techniques. Partial knee replacement and tibial tray designs are also gaining popularity, catering to the diverse needs of patients. The ongoing unfolding of market activities in the market reflects the dynamic nature of the healthcare industry, with a focus on improving patient outcomes and enhancing the quality of life for those suffering from knee joint diseases.
How is this Cementless Total Knee Arthroplasty Industry segmented?
The cementless total knee arthroplasty industry research report provides comprehensive data (region-wise segment analysis), with forecasts and estimates in "USD million" for the period 2025-2029, as well as historical data from 2019-2023 for the following segments.
- Product
- Fixed-bearing
- Mobile-bearing
- End-user
- Hospitals
- Orthopedic clinics
- Ambulatory surgical centers
- Material
- Alloy
- Ceramics
- Others
- Type
- Monoblock
- Modular
- Hybrid
- Geography
- North America
- US
- Canada
- Europe
- France
- Germany
- Italy
- Spain
- UK
- APAC
- China
- India
- Japan
- Rest of World (ROW)
- North America
By Product Insights
The fixed-bearing segment is estimated to witness significant growth during the forecast period.
In the realm of cementless total knee arthroplasty (TKA), clinical trials continue to explore advanced designs and materials to enhance patient satisfaction and functional outcomes. Orthopedic surgery, a critical component of joint replacement procedures, benefits from evidence-based medicine and innovative surgical techniques. Unicompartmental knee replacement, a partial alternative to TKA, is gaining popularity due to its potential for preserving bone stock and faster recovery. Patient demographics, particularly the geriatric population, drive the market's growth, necessitating surgical expertise and postoperative rehabilitation. Aseptic loosening, a concern for implant longevity, is being addressed through the use of biocompatible materials and advanced hinge designs.
FDA approval and regulatory standards ensure the safety and efficacy of knee arthroplasty devices. Biomedical engineering advances contribute to the development of cruciate-substituting and cruciate-retaining designs, catering to various patient needs. Health economics and healthcare utilization are significant factors influencing the market dynamics. Patient satisfaction, a crucial indicator, is closely monitored through range of motion assessments and pain management strategies. Implant wear, a common challenge, is being mitigated through the use of wear-resistant materials and improved component locking mechanisms. Navigation systems and computer-assisted surgery aid in precise implant positioning and alignment. Knee deformities, periprosthetic fractures, infection prevention, and rheumatoid arthritis are some conditions that TKA addresses, contributing to its significance in orthopedic care.
Total knee replacement, with its cruciate-substituting and cruciate-retaining designs, offers improved knee stability and quality of life. The femoral and patellar components, integral parts of the implant, undergo rigorous testing for durability and biocompatibility. The tibial tray, an essential element, is designed to ensure proper implant alignment and interaction with the bone. Regulatory standards, such as CE marking, ensure the safety and efficacy of these medical devices. Preoperative planning, a crucial aspect of surgical success, involves careful consideration of patient-specific factors and surgical expertise. Partial knee replacement, an alternative to TKA, offers advantages for certain patient populations. Material science continues to play a pivotal role in the development of advanced knee implants.
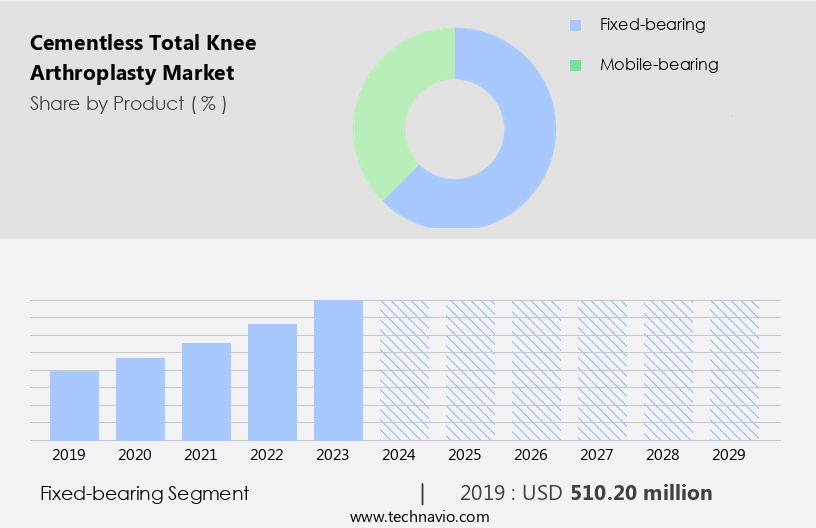
The Fixed-bearing segment was valued at USD 510.20 billion in 2019 and showed a gradual increase during the forecast period.
Regional Analysis
North America is estimated to contribute 40% to the growth of the global market during the forecast period.Technavio’s analysts have elaborately explained the regional trends and drivers that shape the market during the forecast period.
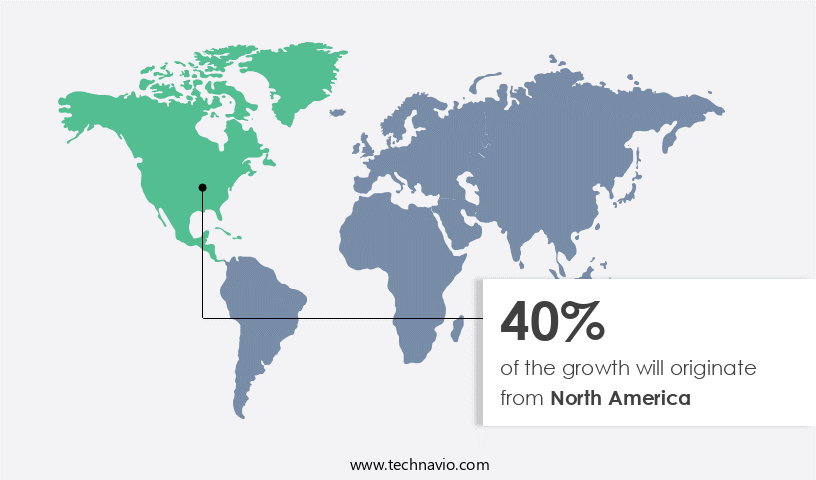
The market in North America is primarily driven by the high number of patients undergoing the procedure in the US and Canada due to publicly funded healthcare systems. The governments in these countries cover a significant portion of the costs for medical treatments, surgeries, and orthopedic implants, leading to a larger patient pool for total knee arthroplasty (TKA). Advanced medical facilities and increased awareness among healthcare professionals and patients further fuel the market growth. The prevalence of orthopedic conditions, such as osteoarthritis and rheumatoid arthritis, is rising, leading to an increased demand for joint replacement surgeries.
Product launches of advanced knee implants with cruciate-substituting, cruciate-retaining, and constrained designs, along with favorable reimbursement policies, are also contributing to market expansion. Biomedical engineering innovations, including the use of biocompatible materials, bone cement alternatives, and hinge designs, are improving functional outcomes and patient satisfaction. Additionally, initiatives to prevent complications such as aseptic loosening, infection, periprosthetic fractures, and knee deformities are gaining traction. The geriatric population's growing need for knee arthroplasty, along with the focus on pain management and postoperative rehabilitation, is further driving market growth. Regulatory standards, such as FDA approval and CE marking, ensure the safety and efficacy of knee implants.
Surgical expertise, hospital accreditation, and computer-assisted surgery are also essential factors contributing to the market's development. The market for partial knee replacement and navigation systems is also growing, offering opportunities for medical device manufacturers. The focus on health economics and quality of life, along with the importance of implant wear and knee stability, is shaping the market dynamics.
Market Dynamics
Our researchers analyzed the data with 2024 as the base year, along with the key drivers, trends, and challenges. A holistic analysis of drivers will help companies refine their marketing strategies to gain a competitive advantage.
What are the key market drivers leading to the rise in the adoption of Cementless Total Knee Arthroplasty Industry?
- The significant increase in arthritis diagnoses serves as the primary market driver, underpinned by a growing population aging and an elevated prevalence of obesity and sedentary lifestyles.
- Knee arthroplasty, also known as total knee replacement, is a medical device solution for individuals diagnosed with arthritis, a condition characterized by inflammation, pain, and stiffness of the joints. Osteoarthritis, the most common type of arthritis, affects the knees in approximately 20% of US adults, or around 53 million people, according to the Centers for Disease Control and Prevention (CDC). This condition occurs when the cartilage wears off over time, leading to joint damage and impaired function. Two primary designs for total knee replacement exist: cruciate-substituting and cruciate-retaining. The cruciate-substituting design eliminates the cruciate ligaments, while the cruciate-retaining design preserves them.
- Both designs utilize a femoral component and a patellar component. The surgical expertise required for implantation varies between designs. The choice between these designs depends on various factors, including the patient's anatomy, range of motion requirements, and postoperative rehabilitation needs. Health economics also plays a role in the decision-making process, as the cost and long-term outcomes of each design may differ. In conclusion, the demand for total knee replacement procedures is expected to increase due to the growing geriatric population and the prevalence of arthritis. The market for these medical devices continues to evolve, with ongoing research and development focusing on improving patient outcomes and reducing the need for postoperative rehabilitation.
What are the market trends shaping the Cementless Total Knee Arthroplasty Industry?
- The trend in the healthcare industry is shifting towards an increasing number of outpatient knee replacement surgeries. This outpatient approach offers several benefits, including reduced recovery time and lower costs, making it a preferred choice for many patients.
- The Cementless Total Knee Arthroplasty (TKA) market has witnessed significant growth due to the increasing number of outpatient knee replacement surgeries. Advancements in surgical techniques, implant designs, and postoperative care management have made outpatient TKA surgeries a preferred choice for patients. These surgeries offer several advantages, including improved outcomes and a quicker return to normal activities. The use of biocompatible materials and hinge designs in cementless implants ensures better integration with the bone, reducing the risk of implant wear and periprosthetic fracture. Moreover, the elimination of bone cement in the procedure enhances the quality of life for patients by minimizing the risk of complications such as allergic reactions and bone cement infection.
- Physical therapy and pain management are crucial components of the outpatient TKA process. The implementation of comprehensive pain management strategies, such as multimodal pain management, has significantly reduced the need for opioids and other narcotics. This, in turn, has led to a decrease in the length of hospital stays and the overall cost of the procedure. Regulatory standards, such as ce marking, ensure the safety and efficacy of cementless TKA implants. Knee deformities and other complex cases may still require inpatient care, but the majority of patients can undergo outpatient TKA procedures with minimal complications. The market for cementless TKA implants is expected to continue growing due to the increasing demand for minimally invasive surgeries and the advantages they offer over traditional inpatient procedures.
What challenges does the Cementless Total Knee Arthroplasty Industry face during its growth?
- The escalating cost of cementless total knee arthroplasty (TKA) represents a significant challenge to the growth of the orthopedic industry. This expense, which is a key consideration for healthcare providers and patients alike, necessitates ongoing research and innovation to improve the cost-effectiveness of cementless TKA technology.
- The market faces significant challenges, including the high cost of implants and surgery, which can be a barrier for many patients worldwide. In the US, the average cost of a cementless total knee arthroplasty (TKA) is approximately USD50,000. While US Medicare covers a significant portion of these costs for eligible patients, this is not the case for the majority of the global population. In countries such as India and Thailand, the cost of TKA is significantly lower than in the US and European countries. However, many people in these countries cannot afford these surgeries due to their low income.
- Furthermore, health insurance coverage is limited in most developing countries in Asia, Africa, and South America. Infection prevention, rheumatoid arthritis, preoperative planning, knee stability, hospital accreditation, computer-assisted surgery, material science, and knee implants are crucial factors driving market growth. Surgical techniques, partial knee replacement, and navigation systems also play essential roles in the market. Despite these challenges, advancements in technology and material science continue to improve the efficacy and safety of cementless TKA.
Exclusive Customer Landscape
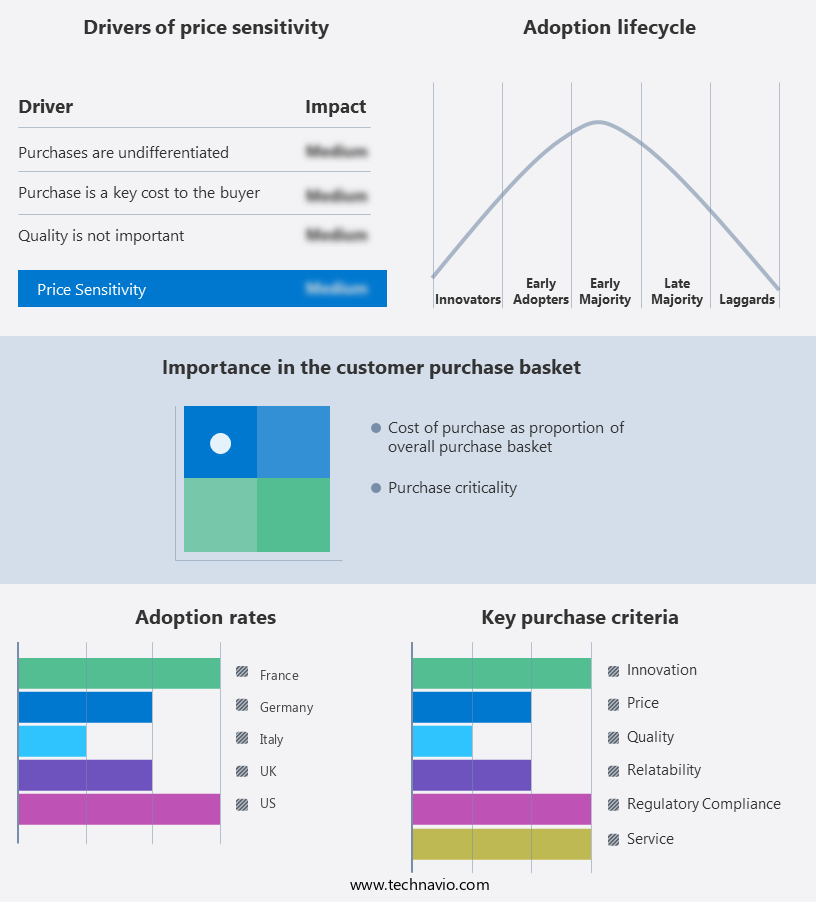
The cementless total knee arthroplasty market forecasting report includes the adoption lifecycle of the market, covering from the innovator’s stage to the laggard’s stage. It focuses on adoption rates in different regions based on penetration. Furthermore, the cementless total knee arthroplasty market report also includes key purchase criteria and drivers of price sensitivity to help companies evaluate and develop their market growth analysis strategies.
Customer Landscape
Key Companies & Market Insights
Companies are implementing various strategies, such as strategic alliances, cementless total knee arthroplasty market forecast, partnerships, mergers and acquisitions, geographical expansion, and product/service launches, to enhance their presence in the industry.
Aesculap Implants Systems LLC - The company specializes in cementless total knee arthroplasty solutions, featuring patient-specific implants engineered for cementless fixation. These advanced prostheses enhance surgical precision and patient outcomes by eliminating the need for cement during the implantation process. By utilizing cutting-edge technology to create customized implants, the company caters to the unique anatomical requirements of each patient, ensuring optimal fit and function. This innovative approach not only streamlines surgical procedures but also reduces the risk of complications associated with cemented implants.
The industry research and growth report includes detailed analyses of the competitive landscape of the market and information about key companies, including:
- Aesculap Implants Systems LLC
- Allegra Orthopaedics Ltd.
- Beijing Chunlizhengda Medical Instruments Co. Ltd.
- Conformis Inc.
- Corin Group Plc
- DJO Global Inc.
- Euromed Implants GmbH
- Exactech Inc.
- GROUP FH ORTHO
- Johnson and Johnson Services Inc.
- Mathys AG Bettlach
- Medacta International SA
- MicroPort Scientific Corp.
- Smith and Nephew plc
- Stryker Corp.
- Symbios Orthopedie SA
- United Orthopedic Corp.
- Waldemar Link GmbH and Co. KG
- X.NOV
- Zimmer Biomet Holdings Inc.
Qualitative and quantitative analysis of companies has been conducted to help clients understand the wider business environment as well as the strengths and weaknesses of key industry players. Data is qualitatively analyzed to categorize companies as pure play, category-focused, industry-focused, and diversified; it is quantitatively analyzed to categorize companies as dominant, leading, strong, tentative, and weak.
Recent Development and News in Cementless Total Knee Arthroplasty Market
- In March 2024, Stryker Corporation, a leading medical technology company, announced the launch of their new cementless total knee system, Triathlon Tritanium, featuring advanced MIS (Minimally Invasive Surgery) technology. This innovation aims to reduce patient recovery time and improve surgical precision (Stryker Corporation, 2024).
- In June 2024, Smith & Nephew, a global medical technology business, entered into a strategic partnership with OrthoSensor, a leader in real-time sensor technology for orthopedic procedures. This collaboration aims to integrate OrthoSensor's real-time monitoring systems into Smith & Nephew's cementless total knee implants, enhancing surgical accuracy and patient outcomes (Smith & Nephew, 2024).
- In November 2024, Zimmer Biomet Holdings, Inc., a major player in the orthopedic industry, completed the acquisition of K2M Group Holdings, Inc., a leading designer, developer, and manufacturer of minimally invasive spinal surgical solutions. This acquisition is expected to expand Zimmer Biomet's product portfolio and strengthen its presence in the orthopedic market (Zimmer Biomet Holdings, Inc., 2024).
- In February 2025, the U.S. Food and Drug Administration (FDA) granted 510(k) clearance to Medtronic plc for its cementless total knee system, the Signature Performance Total Knee. This approval marks a significant milestone for Medtronic, expanding its orthopedic offerings and positioning the company for growth in the market (Medtronic plc, 2025).
Research Analyst Overview
- The market is experiencing significant advancements driven by the integration of technology and personalized medicine. Healthcare costs remain a key consideration, leading to the adoption of minimally invasive techniques, such as arthroscopic surgery, and value-based care models. Bioresorbable materials and 3D printing are revolutionizing implant design, while predictive analytics and machine learning enable more accurate diagnosis and treatment planning. Ligament reconstruction, meniscus repair, and gene therapy are also gaining traction, enhancing patient outcomes. Health literacy and healthcare data security are crucial as technology becomes more prevalent.
- Reimbursement models and insurance coverage are evolving to accommodate these innovations, with a focus on data analytics and remote monitoring. Smart implants and wearable technology are transforming post-operative care and enabling more effective patient education. In the realm of healthcare policy, stakeholders are exploring the potential of stem cell therapy and healthcare access expansion.
Dive into Technavio’s robust research methodology, blending expert interviews, extensive data synthesis, and validated models for unparalleled Cementless Total Knee Arthroplasty Market insights. See full methodology.
|
Market Scope |
|
|
Report Coverage |
Details |
|
Page number |
235 |
|
Base year |
2024 |
|
Historic period |
2019-2023 |
|
Forecast period |
2025-2029 |
|
Growth momentum & CAGR |
Accelerate at a CAGR of 30.4% |
|
Market growth 2025-2029 |
USD 5754.6 million |
|
Market structure |
Fragmented |
|
YoY growth 2024-2025(%) |
25.1 |
|
Key countries |
US, Germany, Canada, UK, China, France, Italy, Japan, Spain, and India |
|
Competitive landscape |
Leading Companies, Market Positioning of Companies, Competitive Strategies, and Industry Risks |
What are the Key Data Covered in this Cementless Total Knee Arthroplasty Market Research and Growth Report?
- CAGR of the Cementless Total Knee Arthroplasty industry during the forecast period
- Detailed information on factors that will drive the growth and forecasting between 2025 and 2029
- Precise estimation of the size of the market and its contribution of the industry in focus to the parent market
- Accurate predictions about upcoming growth and trends and changes in consumer behaviour
- Growth of the market across North America, Europe, Asia, and Rest of World (ROW)
- Thorough analysis of the market’s competitive landscape and detailed information about companies
- Comprehensive analysis of factors that will challenge the cementless total knee arthroplasty market growth of industry companies
We can help! Our analysts can customize this cementless total knee arthroplasty market research report to meet your requirements.
 RIA -
RIA - 
