Knee Replacement Market Analysis North America, Europe, Asia, Rest of World (ROW) - US, Canada, Germany, France, China - Size and Forecast 2024-2028

Knee Replacement Market Analysis North America, Europe, Asia, Rest of World (ROW) - US, Canada, Germany, France, China - Size and Forecast 2024-2028

Published: Mar 2024 164 Pages SKU: IRTNTR40038

Market Overview at a Glance

$4.13 B
Market Opportunity
6.91%
CAGR
5.62
YoY growth 2023-2024(%)

Knee Replacement Market Size 2024-2028 

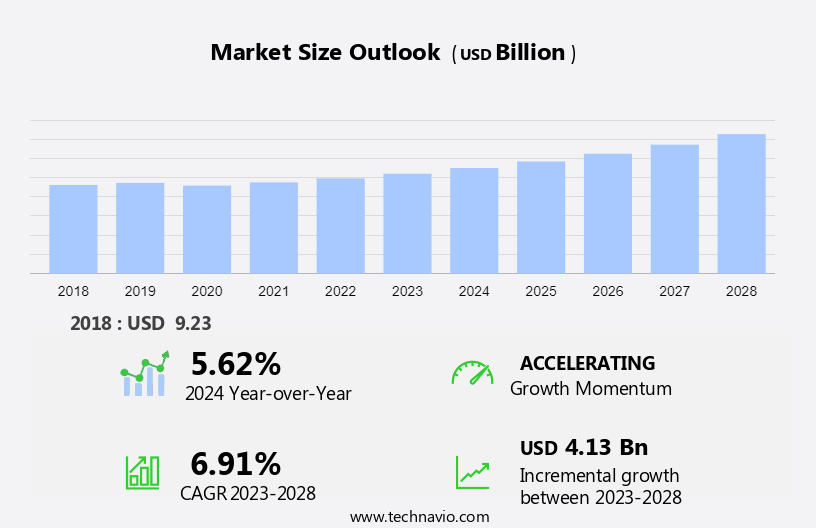
The knee replacement market size is forecast to increase by USD 4.13 billion at a CAGR of 6.91% between 2023 and 2028.

  • The market is experiencing significant growth due to several factors. One key driver is the increasing prevalence of rheumatic conditions, such as osteoarthritis and rheumatoid arthritis, which often require knee implants as a solution. Additionally, advancements in technology are playing a major role in market expansion. For instance, the use of 3D technology and modular implants is becoming more common, allowing for greater precision and customization in surgical procedures. Furthermore, the integration of smart implants, which can monitor patient health and provide real-time data to healthcare providers, is a promising trend. However, challenges remain, including the high cost of implants and decreasing healthcare reimbursements, which may limit access to these procedures for some patients. Overall, the market is poised for continued growth, driven by advances in technology and increasing demand for orthopedic solutions.

What will be the Size of the Market During the Forecast Period?

Knee Replacement Market Size

 Request Free Sample

  • The market represents a significant and growing sector within the healthcare industry, driven by the increasing prevalence of knee diseases such as osteoarthritis, psoriatic arthritis, and rheumatoid arthritis. These conditions often result in symptomatic knee osteoarthritis, leading individuals to seek relief through surgical interventions. The knee joint, a complex hinge mechanism, is prone to wear and tear due to various factors, including age, injury, and disease. When non-surgical treatments prove insufficient, artificial knee implants emerge as a viable solution. These implants, designed using advanced 3D technology, aim to restore function and alleviate pain. The market for knee implants encompasses a diverse range of products, including below-the-knee implants, smart implants, and modular implants. Below-the-knee implants cater to patients requiring extensive bone loss reconstruction, while smart implants integrate advanced technology to enhance patient outcomes.
  • Modular implants offer customizable solutions based on individual patient needs. The orthopedic surgeries market, which includes knee replacement procedures, continues to expand due to the increasing number of aging populations worldwide. The advent of ambulatory healthcare facilities has revolutionized the delivery of knee replacement services, offering patients convenience and cost savings. These facilities enable outpatient procedures, reducing hospital stays and expediting recovery. Advancements in technology, such as 3D printing and biocompatible materials, contribute to the development of more effective and durable knee implants.
  • Furthermore, the integration of tissues, including cartilage, into implant designs aims to improve joint function and longevity. Market dynamics, including regulatory approvals, pricing pressures, and competition, influence the market's growth trajectory. Collaborations between industry players and research institutions foster innovation, driving market expansion. In conclusion, the market reflects a dynamic and evolving industry, driven by the increasing prevalence of knee diseases and advancements in technology. As the demand for effective solutions to alleviate pain and restore function continues to grow, the market is poised for continued expansion.

How is this market segmented and which is the largest segment?

The market research report provides comprehensive data (region-wise segment analysis), with forecasts and estimates in "USD billion" for the period 2024-2028, as well as historical data from 2018-2022 for the following segments.

  • Product
    • TKR
    • RKR
    • PKR
  • End-user
    • Hospitals and specialty clinics
    • Ambulatory surgical clinics
  • Geography
    • North America
      • Canada
      • US
    • Europe
      • Germany
      • France
    • Asia
      • China
    • Rest of World (ROW)

By Product Insights

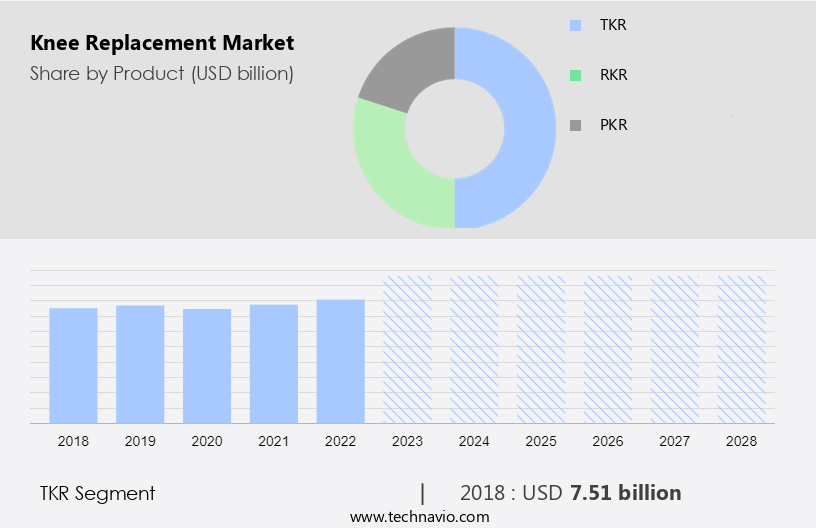
  • The TKR segment is estimated to witness significant growth during the forecast period.

The market encompasses various surgical techniques, including total knee replacement (TKR), which is a significant surgical procedure. Hospitals, orthopedic clinics, and ambulatory surgical centers are the primary end-users of these procedures. Hospitals lead the market due to their advanced infrastructure, skilled medical staff, and comprehensive services, including pre-operative assessment, surgical procedures, and post-operative care. TKR surgery involves replacing the damaged or worn-out parts of the knee joint, specifically the bottom part of the thigh bone (femur), the top of the shin bone (tibia), and the kneecap (patella), with artificial knee replacement implants. Knee osteoarthritis is a common condition leading to the need for these surgical procedures.

Further, according to the Centers for Disease Control and Prevention (CDC), approximately 14 million Americans have symptomatic osteoarthritis, making it a significant health concern. Surgical robots and artificial intelligence are increasingly being integrated into knee replacement surgeries to enhance precision and improve patient outcomes. TKR is a crucial intervention for managing knee osteoarthritis and restoring mobility and function.

Knee Replacement Market Size

Get a glance at the market report of share of various segments Request Free Sample

The TKR segment was valued at USD 7.51 billion in 2018 and showed a gradual increase during the forecast period.

Regional Analysis

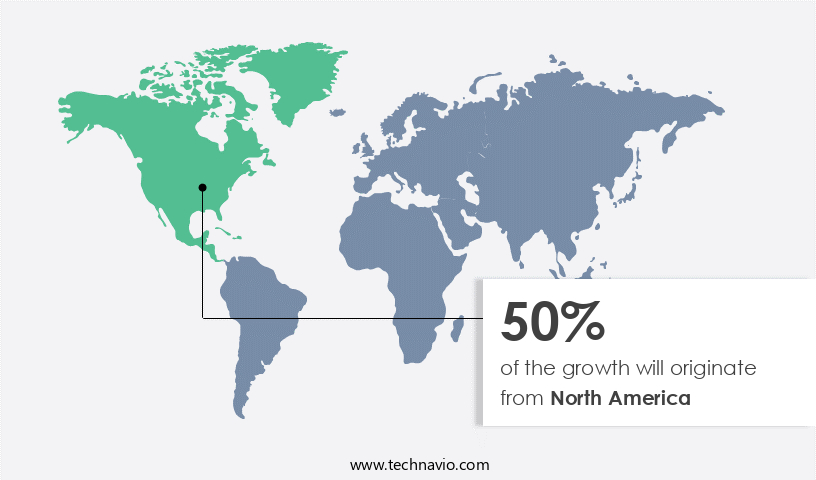
  • North America is estimated to contribute 50% to the growth of the global market during the forecast period.

Technavio's analysts have elaborately explained the regional trends and drivers that shape the market during the forecast period.

Knee Replacement Market Share by Geography

For more insights on the market share of various regions Request Free Sample

The North American region dominates The market due to several factors, including the high prevalence of knee diseases such as osteoarthritis, psoriatic arthritis, and rheumatoid arthritis. The US and Canada are the major contributors to the market in this region. The market's growth in North America is driven by the increasing adoption of advanced artificial knee implants, improved healthcare infrastructure, and the rising number of knee arthroplasty surgeries. Key players in the market include Johnson & Johnson Services Inc., Smith & Nephew plc, and Stryker Corp., which are at the forefront of providing innovative knee implant solutions to meet the growing demand.

These companies are investing significantly in research and development to introduce new and improved knee implants to cater to the evolving needs of patients. The market in North America is expected to continue its growth trajectory during the forecast period.

Market Dynamics

Our researchers analyzed the data with 2023 as the base year, along with the key drivers, trends, and challenges. A holistic analysis of drivers will help companies refine their marketing strategies to gain a competitive advantage.

What are the key market drivers leading to the rise in adoption of Knee Replacement Market?

Increasing government support for healthcare enabling better access to orthopedic procedures is the key driver of the market.

  • The market is experiencing significant growth due to the increasing prevalence of knee diseases, such as osteoarthritis, psoriatic arthritis, and rheumatoid arthritis. According to the Arthritis Foundation, symptomatic knee osteoarthritis affects over 15 million Americans. Knee arthroplasty surgery, which involves the replacement of damaged cartilages in the knee joint with artificial knee implants, has become a common treatment for these conditions. The market for knee implants includes various types, such as Fixed-bearing Implants, Mobile-bearing Implants, and Modular implants. Advancements in technology, including 3D technology and Smart implants, are driving innovation in the market. Orthopedic clinics and Ambulatory Surgical Centers are increasingly adopting surgical techniques like Partial Knee Replacement and Revision Knee Replacement to provide more personalized care to patients.

    Surgical robots and Artificial intelligence (AI) are also being integrated into knee replacement surgeries to improve accuracy and efficiency. The epidemics of obesity and bone-related ailments are also contributing to the growth of the market. Pain medications and co-occurring illnesses can lead to complications and the need for revision arthroplasty. Customized implants are also gaining popularity to address individual patient needs. The market for knee replacement implants is expected to continue growing due to the increasing demand for minimally invasive procedures and the aging population.

What are the market trends shaping the Knee Replacement Market?

Growing developments in global knee replacement market is the upcoming trend in the market.

  • The market is witnessing significant advancements due to the introduction of innovative technologies and surgical techniques in knee arthroplasty surgery. Osteoarthritis, psoriatic arthritis, and rheumatoid arthritis are common bone-related ailments leading to symptomatic knee osteoarthritis, necessitating knee replacement surgeries. The Arthritis Foundation reports a high prevalence of arthritis and rheumatic conditions in the US. Recent innovations include the VELYS Robotic-Assisted Solution by DePuy Synthes, which offers insightful analysis, adaptable implementation, and validated performance for optimized patient outcomes and operational efficiency. The Medacta Group S.A. Launched the GMK SpheriKA Knee Implant, designed to reduce post-operative knee discomfort and enhance patient satisfaction in daily activities after Total Knee Replacement (TKA) by ensuring optimal functional stability.
  • Moreover, advancements in 3D technology and artificial intelligence (AI) are leading to the development of smart implants, modular implants, and surgical robots for Orthopedic surgeries. These innovations cater to the increasing demand for minimally invasive procedures and customized implants in Ambulatory Surgical Centers (ASCs) and Orthopedic Clinics. Partial Knee Replacement (PKR) and Revision Knee Replacement are other trends in the market, with Fixed-bearing Implants and Mobile-bearing Implants being popular choices for patients. The market is expected to grow further due to the epidemics of obesity and the increasing number of co-occurring illnesses requiring knee replacement surgeries.

What challenges does Knee Replacement Market face during the growth?

High implant prices coupled with decreasing healthcare reimbursements is a key challenge affecting the market growth.

  • Knee arthroplasty surgery, also known as knee replacement, is a common orthopedic procedure for treating bone-related ailments such as osteoarthritis, psoriatic arthritis, and rheumatoid arthritis. This surgical intervention involves the replacement of damaged cartilages in the knee joint with artificial knee implants. According to the Arthritis Foundation, symptomatic knee osteoarthritis affects millions of Americans, making knee replacement surgeries a significant market. The prevalence of knee diseases continues to rise due to epidemics of obesity and aging populations. Knee replacement implants come in various types, including Fixed-bearing Implants, Mobile-bearing Implants, and Modular implants. Partial Knee Replacement and Revision Knee Replacement are also common procedures.
  • Ambulatory Surgical Centers and Orthopedic Clinics are increasingly offering these procedures to provide more affordable and accessible options for patients. In summary, the market is driven by the growing prevalence of arthritis and rheumatic conditions, the need for advanced implant technologies, and the increasing affordability of procedures through ambulatory surgery centers and clinics. Despite the high costs, the market is expected to grow due to the significant benefits these procedures offer for improving patients' quality of life.

Exclusive Customer Landscape

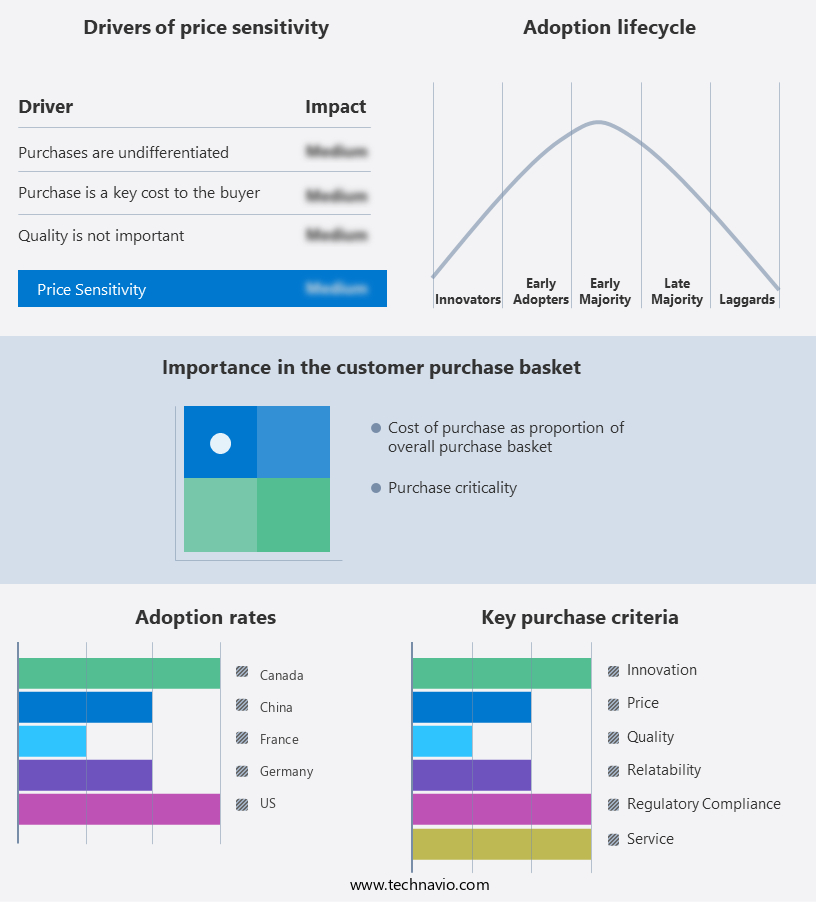
The market forecasting report includes the adoption lifecycle of the market, covering from the innovator's stage to the laggard's stage. It focuses on adoption rates in different regions based on penetration. Furthermore, the market report also includes key purchase criteria and drivers of price sensitivity to help companies evaluate and develop their market growth analysis strategies.

Knee Replacement Market Share by Geography

 Customer Landscape

Key Companies & Market Insights

Companies are implementing various strategies, such as strategic alliances, market forecast, partnerships, mergers and acquisitions, geographical expansion, and product/service launches, to enhance their presence in the market. The market research and growth report includes detailed analyses of the competitive landscape of the market and information about key companies, including:

  • ADLER ORTHO S.p.A.
  • Amplitude SAS
  • Arthrex Inc.
  • B.Braun SE
  • Conformis Inc.
  • Corin Group Plc
  • Enovis Corp.
  • Exactech Inc.
  • Fuse Medical Inc.
  • implantcast GmbH
  • Johnson and Johnson Services Inc.
  • Just Medical Devices Tianjin Co. Ltd
  • Limacorporate SpA
  • Medacta Group SA
  • Merete Technologies Inc.
  • MicroPort Scientific Corp.
  • Smith and Nephew plc
  • Stryker Corp.
  • Waldemar Link GmbH and Co. KG
  • Zimmer Biomet Holdings Inc.

Qualitative and quantitative analysis of companies has been conducted to help clients understand the wider business environment as well as the strengths and weaknesses of key market players. Data is qualitatively analyzed to categorize companies as pure play, category-focused, industry-focused, and diversified; it is quantitatively analyzed to categorize companies as dominant, leading, strong, tentative, and weak.

Research Analyst Overview

Knee arthroplasty surgery, also known as knee replacement, is a medical procedure that involves replacing damaged cartilages in the knee joint with artificial implants. This procedure is often recommended for individuals suffering from osteoarthritis, psoriatic arthritis, and rheumatoid arthritis. Symptomatic knee osteoarthritis and other bone-related ailments can cause significant pain and impact daily life. Artificial knee implants come in various types, including fixed-bearing and mobile-bearing implants. Fixed-bearing implants have a stationary plastic liner, while mobile-bearing implants allow for more natural knee movement. Orthopedic clinics and ambulatory surgical centers offer knee replacement surgeries using advanced surgical techniques and technologies, such as 3D technology and smart implants.

Consequently, these innovations enable customized implants and improved surgical precision. Knee diseases, including arthritis and rheumatic conditions, affect millions worldwide, with epidemics of obesity contributing to the increasing prevalence of osteoarthritis. Pain medications and co-occurring illnesses can complicate treatment, making advanced surgical procedures like knee replacement essential for many. Partial knee replacement and revision knee replacement are alternative options for those requiring less extensive procedures. Surgical robots and artificial intelligence are increasingly utilized in orthopedic surgeries to enhance accuracy and efficiency. The Arthritis Foundation and other organizations provide valuable resources for individuals considering knee replacement surgery. Consult with healthcare professionals to determine the best treatment plan for your unique needs.

Additionally, the knee replacement market is evolving with innovations in artificial knee implants, such as LPS-Mobile Bearing Knees and NexGen LPS-Flex Mobile, designed to offer improved mobility and reduce discomfort. With the prevalence of knee osteoarthritis rising, the demand for total knee replacement (TKR) and partial knee arthroplasty procedures is increasing. Less invasive surgical procedures, including robots-assisted knee replacement surgeries, are gaining popularity for their precision and quicker recovery times. Customized knee replacement implants and advancements in materials for knee replacement surgery are enhancing patient outcomes. The market also sees a growing interest in designs of knee implants, such as fixed bearing and mobile bearing implants, as well as medial pivotal implants. Robotics and the higher diagnosis rate of knee arthritis are driving further advancements in knee osteoarthritis treatment.

Market Scope

Report Coverage

Details

Page number

164

Base year

2023

Historic period

2018-2022

Forecast period

2024-2028

Growth momentum & CAGR

Accelerate at a CAGR of 6.91%

Market growth 2024-2028

USD 4.13 billion

Market structure

Fragmented

YoY growth 2023-2024(%)

5.62

Key countries

US, Canada, Germany, France, and China

Competitive landscape

Leading Companies, Market Positioning of Companies, Competitive Strategies, and Industry Risks

Request Free Sample

What are the Key Data Covered in this Market Research and Growth Report?

  • CAGR of the market during the forecast period
  • Detailed information on factors that will drive the market growth and forecasting between 2024 and 2028
  • Precise estimation of the size of the market  and its contribution of the market in focus to the parent market
  • Accurate predictions about upcoming market growth and trends and changes in consumer behaviour
  • Growth of the market across North America, Europe, Asia, and Rest of World (ROW)
  • Thorough analysis of the market's competitive landscape and detailed information about companies
  • Comprehensive analysis of factors that will challenge the growth of market companies

We can help! Our analysts can customize this market research report to meet your requirements. Get in touch

1 Executive Summary

  • 1.1 Market overview
    • Exhibit 01: Executive Summary – Chart on Market Overview
    • Exhibit 02: Executive Summary – Data Table on Market Overview
    • Exhibit 03: Executive Summary – Chart on Global Market Characteristics
    • Exhibit 04: Executive Summary – Chart on Market by Geography
    • Exhibit 05: Executive Summary – Chart on Market Segmentation by Product
    • Exhibit 06: Executive Summary – Chart on Market Segmentation by End-user
    • Exhibit 07: Executive Summary – Chart on Incremental Growth
    • Exhibit 08: Executive Summary – Data Table on Incremental Growth
    • Exhibit 09: Executive Summary – Chart on Vendor Market Positioning

2 Market Landscape

  • 2.1 Market ecosystem
    • Exhibit 10: Parent market
    • Exhibit 11: Market Characteristics

3 Market Sizing

  • 3.1 Market definition
    • Exhibit 12: Offerings of vendors included in the market definition
  • 3.2 Market segment analysis
    • Exhibit 13: Market segments
  • 3.3 Market size 2023
    • 3.4 Market outlook: Forecast for 2023-2028
      • Exhibit 14: Chart on Global - Market size and forecast 2023-2028 ($ billion)
      • Exhibit 15: Data Table on Global - Market size and forecast 2023-2028 ($ billion)
      • Exhibit 16: Chart on Global Market: Year-over-year growth 2023-2028 (%)
      • Exhibit 17: Data Table on Global Market: Year-over-year growth 2023-2028 (%)

    4 Historic Market Size

    • 4.1 Global knee replacement market 2018 - 2022
      • Exhibit 18: Historic Market Size – Data Table on global knee replacement market 2018 - 2022 ($ billion)
    • 4.2 Product Segment Analysis 2018 - 2022
      • Exhibit 19: Historic Market Size – Product Segment 2018 - 2022 ($ billion)
    • 4.3 End-user Segment Analysis 2018 - 2022
      • Exhibit 20: Historic Market Size – End-user Segment 2018 - 2022 ($ billion)
    • 4.4 Geography Segment Analysis 2018 - 2022
      • Exhibit 21: Historic Market Size – Geography Segment 2018 - 2022 ($ billion)
    • 4.5 Country Segment Analysis 2018 - 2022
      • Exhibit 22: Historic Market Size – Country Segment 2018 - 2022 ($ billion)

    5 Five Forces Analysis

    • 5.1 Five forces summary
      • Exhibit 23: Five forces analysis - Comparison between 2023 and 2028
    • 5.2 Bargaining power of buyers
      • Exhibit 24: Chart on Bargaining power of buyers – Impact of key factors 2023 and 2028
    • 5.3 Bargaining power of suppliers
      • Exhibit 25: Bargaining power of suppliers – Impact of key factors in 2023 and 2028
    • 5.4 Threat of new entrants
      • Exhibit 26: Threat of new entrants – Impact of key factors in 2023 and 2028
    • 5.5 Threat of substitutes
      • Exhibit 27: Threat of substitutes – Impact of key factors in 2023 and 2028
    • 5.6 Threat of rivalry
      • Exhibit 28: Threat of rivalry – Impact of key factors in 2023 and 2028
    • 5.7 Market condition
      • Exhibit 29: Chart on Market condition - Five forces 2023 and 2028

    6 Market Segmentation by Product

    • 6.1 Market segments
      • Exhibit 30: Chart on Product - Market share 2023-2028 (%)
      • Exhibit 31: Data Table on Product - Market share 2023-2028 (%)
    • 6.2 Comparison by Product
      • Exhibit 32: Chart on Comparison by Product
      • Exhibit 33: Data Table on Comparison by Product
    • 6.3 TKR - Market size and forecast 2023-2028
      • Exhibit 34: Chart on TKR - Market size and forecast 2023-2028 ($ billion)
      • Exhibit 35: Data Table on TKR - Market size and forecast 2023-2028 ($ billion)
      • Exhibit 36: Chart on TKR - Year-over-year growth 2023-2028 (%)
      • Exhibit 37: Data Table on TKR - Year-over-year growth 2023-2028 (%)
    • 6.4 RKR - Market size and forecast 2023-2028
      • Exhibit 38: Chart on RKR - Market size and forecast 2023-2028 ($ billion)
      • Exhibit 39: Data Table on RKR - Market size and forecast 2023-2028 ($ billion)
      • Exhibit 40: Chart on RKR - Year-over-year growth 2023-2028 (%)
      • Exhibit 41: Data Table on RKR - Year-over-year growth 2023-2028 (%)
    • 6.5 PKR - Market size and forecast 2023-2028
      • Exhibit 42: Chart on PKR - Market size and forecast 2023-2028 ($ billion)
      • Exhibit 43: Data Table on PKR - Market size and forecast 2023-2028 ($ billion)
      • Exhibit 44: Chart on PKR - Year-over-year growth 2023-2028 (%)
      • Exhibit 45: Data Table on PKR - Year-over-year growth 2023-2028 (%)
    • 6.6 Market opportunity by Product
      • Exhibit 46: Market opportunity by Product ($ billion)
      • Exhibit 47: Data Table on Market opportunity by Product ($ billion)

    7 Market Segmentation by End-user

    • 7.1 Market segments
      • Exhibit 48: Chart on End-user - Market share 2023-2028 (%)
      • Exhibit 49: Data Table on End-user - Market share 2023-2028 (%)
    • 7.2 Comparison by End-user
      • Exhibit 50: Chart on Comparison by End-user
      • Exhibit 51: Data Table on Comparison by End-user
    • 7.3 Hospitals and specialty clinics - Market size and forecast 2023-2028
      • Exhibit 52: Chart on Hospitals and specialty clinics - Market size and forecast 2023-2028 ($ billion)
      • Exhibit 53: Data Table on Hospitals and specialty clinics - Market size and forecast 2023-2028 ($ billion)
      • Exhibit 54: Chart on Hospitals and specialty clinics - Year-over-year growth 2023-2028 (%)
      • Exhibit 55: Data Table on Hospitals and specialty clinics - Year-over-year growth 2023-2028 (%)
    • 7.4 Ambulatory surgical clinics - Market size and forecast 2023-2028
      • Exhibit 56: Chart on Ambulatory surgical clinics - Market size and forecast 2023-2028 ($ billion)
      • Exhibit 57: Data Table on Ambulatory surgical clinics - Market size and forecast 2023-2028 ($ billion)
      • Exhibit 58: Chart on Ambulatory surgical clinics - Year-over-year growth 2023-2028 (%)
      • Exhibit 59: Data Table on Ambulatory surgical clinics - Year-over-year growth 2023-2028 (%)
    • 7.5 Market opportunity by End-user
      • Exhibit 60: Market opportunity by End-user ($ billion)
      • Exhibit 61: Data Table on Market opportunity by End-user ($ billion)

    8 Customer Landscape

    • 8.1 Customer landscape overview
      • Exhibit 62: Analysis of price sensitivity, lifecycle, customer purchase basket, adoption rates, and purchase criteria

    9 Geographic Landscape

    • 9.1 Geographic segmentation
      • Exhibit 63: Chart on Market share by geography 2023-2028 (%)
      • Exhibit 64: Data Table on Market share by geography 2023-2028 (%)
    • 9.2 Geographic comparison
      • Exhibit 65: Chart on Geographic comparison
      • Exhibit 66: Data Table on Geographic comparison
    • 9.3 North America - Market size and forecast 2023-2028
      • Exhibit 67: Chart on North America - Market size and forecast 2023-2028 ($ billion)
      • Exhibit 68: Data Table on North America - Market size and forecast 2023-2028 ($ billion)
      • Exhibit 69: Chart on North America - Year-over-year growth 2023-2028 (%)
      • Exhibit 70: Data Table on North America - Year-over-year growth 2023-2028 (%)
    • 9.4 Europe - Market size and forecast 2023-2028
      • Exhibit 71: Chart on Europe - Market size and forecast 2023-2028 ($ billion)
      • Exhibit 72: Data Table on Europe - Market size and forecast 2023-2028 ($ billion)
      • Exhibit 73: Chart on Europe - Year-over-year growth 2023-2028 (%)
      • Exhibit 74: Data Table on Europe - Year-over-year growth 2023-2028 (%)
    • 9.5 Asia - Market size and forecast 2023-2028
      • Exhibit 75: Chart on Asia - Market size and forecast 2023-2028 ($ billion)
      • Exhibit 76: Data Table on Asia - Market size and forecast 2023-2028 ($ billion)
      • Exhibit 77: Chart on Asia - Year-over-year growth 2023-2028 (%)
      • Exhibit 78: Data Table on Asia - Year-over-year growth 2023-2028 (%)
    • 9.6 Rest of World (ROW) - Market size and forecast 2023-2028
      • Exhibit 79: Chart on Rest of World (ROW) - Market size and forecast 2023-2028 ($ billion)
      • Exhibit 80: Data Table on Rest of World (ROW) - Market size and forecast 2023-2028 ($ billion)
      • Exhibit 81: Chart on Rest of World (ROW) - Year-over-year growth 2023-2028 (%)
      • Exhibit 82: Data Table on Rest of World (ROW) - Year-over-year growth 2023-2028 (%)
    • 9.7 US - Market size and forecast 2023-2028
      • Exhibit 83: Chart on US - Market size and forecast 2023-2028 ($ billion)
      • Exhibit 84: Data Table on US - Market size and forecast 2023-2028 ($ billion)
      • Exhibit 85: Chart on US - Year-over-year growth 2023-2028 (%)
      • Exhibit 86: Data Table on US - Year-over-year growth 2023-2028 (%)
    • 9.8 Canada - Market size and forecast 2023-2028
      • Exhibit 87: Chart on Canada - Market size and forecast 2023-2028 ($ billion)
      • Exhibit 88: Data Table on Canada - Market size and forecast 2023-2028 ($ billion)
      • Exhibit 89: Chart on Canada - Year-over-year growth 2023-2028 (%)
      • Exhibit 90: Data Table on Canada - Year-over-year growth 2023-2028 (%)
    • 9.9 China - Market size and forecast 2023-2028
      • Exhibit 91: Chart on China - Market size and forecast 2023-2028 ($ billion)
      • Exhibit 92: Data Table on China - Market size and forecast 2023-2028 ($ billion)
      • Exhibit 93: Chart on China - Year-over-year growth 2023-2028 (%)
      • Exhibit 94: Data Table on China - Year-over-year growth 2023-2028 (%)
    • 9.10 Germany - Market size and forecast 2023-2028
      • Exhibit 95: Chart on Germany - Market size and forecast 2023-2028 ($ billion)
      • Exhibit 96: Data Table on Germany - Market size and forecast 2023-2028 ($ billion)
      • Exhibit 97: Chart on Germany - Year-over-year growth 2023-2028 (%)
      • Exhibit 98: Data Table on Germany - Year-over-year growth 2023-2028 (%)
    • 9.11 France - Market size and forecast 2023-2028
      • Exhibit 99: Chart on France - Market size and forecast 2023-2028 ($ billion)
      • Exhibit 100: Data Table on France - Market size and forecast 2023-2028 ($ billion)
      • Exhibit 101: Chart on France - Year-over-year growth 2023-2028 (%)
      • Exhibit 102: Data Table on France - Year-over-year growth 2023-2028 (%)
    • 9.12 Market opportunity by geography
      • Exhibit 103: Market opportunity by geography ($ billion)
      • Exhibit 104: Data Tables on Market opportunity by geography ($ billion)

    10 Drivers, Challenges, and Trends

    • 10.1 Market drivers
      • 10.2 Market challenges
        • 10.3 Impact of drivers and challenges
          • Exhibit 105: Impact of drivers and challenges in 2023 and 2028
        • 10.4 Market trends

          11 Vendor Landscape

          • 11.1 Overview
            • 11.2 Vendor landscape
              • Exhibit 106: Overview on Criticality of inputs and Factors of differentiation
            • 11.3 Landscape disruption
              • Exhibit 107: Overview on factors of disruption
            • 11.4 Industry risks
              • Exhibit 108: Impact of key risks on business

            12 Vendor Analysis

            • 12.1 Vendors covered
              • Exhibit 109: Vendors covered
            • 12.2 Market positioning of vendors
              • Exhibit 110: Matrix on vendor position and classification
            • 12.3 ADLER ORTHO S.p.A.
              • Exhibit 111: ADLER ORTHO S.p.A. - Overview
              • Exhibit 112: ADLER ORTHO S.p.A. - Product / Service
              • Exhibit 113: ADLER ORTHO S.p.A. - Key offerings
            • 12.4 Amplitude SAS
              • Exhibit 114: Amplitude SAS - Overview
              • Exhibit 115: Amplitude SAS - Product / Service
              • Exhibit 116: Amplitude SAS - Key offerings
            • 12.5 Arthrex Inc.
              • Exhibit 117: Arthrex Inc. - Overview
              • Exhibit 118: Arthrex Inc. - Product / Service
              • Exhibit 119: Arthrex Inc. - Key offerings
            • 12.6 B.Braun SE
              • Exhibit 120: B.Braun SE - Overview
              • Exhibit 121: B.Braun SE - Business segments
              • Exhibit 122: B.Braun SE - Key offerings
              • Exhibit 123: B.Braun SE - Segment focus
            • 12.7 Conformis Inc.
              • Exhibit 124: Conformis Inc. - Overview
              • Exhibit 125: Conformis Inc. - Product / Service
              • Exhibit 126: Conformis Inc. - Key news
              • Exhibit 127: Conformis Inc. - Key offerings
            • 12.8 Corin Group Plc
              • Exhibit 128: Corin Group Plc - Overview
              • Exhibit 129: Corin Group Plc - Product / Service
              • Exhibit 130: Corin Group Plc - Key offerings
            • 12.9 Enovis Corp.
              • Exhibit 131: Enovis Corp. - Overview
              • Exhibit 132: Enovis Corp. - Business segments
              • Exhibit 133: Enovis Corp. - Key offerings
              • Exhibit 134: Enovis Corp. - Segment focus
            • 12.10 Exactech Inc.
              • Exhibit 135: Exactech Inc. - Overview
              • Exhibit 136: Exactech Inc. - Product / Service
              • Exhibit 137: Exactech Inc. - Key offerings
            • 12.11 Fuse Medical Inc.
              • Exhibit 138: Fuse Medical Inc. - Overview
              • Exhibit 139: Fuse Medical Inc. - Product / Service
              • Exhibit 140: Fuse Medical Inc. - Key offerings
            • 12.12 Johnson and Johnson Services Inc.
              • Exhibit 141: Johnson and Johnson Services Inc. - Overview
              • Exhibit 142: Johnson and Johnson Services Inc. - Business segments
              • Exhibit 143: Johnson and Johnson Services Inc. - Key news
              • Exhibit 144: Johnson and Johnson Services Inc. - Key offerings
              • Exhibit 145: Johnson and Johnson Services Inc. - Segment focus
            • 12.13 Medacta Group SA
              • Exhibit 146: Medacta Group SA - Overview
              • Exhibit 147: Medacta Group SA - Product / Service
              • Exhibit 148: Medacta Group SA - Key offerings
            • 12.14 MicroPort Scientific Corp.
              • Exhibit 149: MicroPort Scientific Corp. - Overview
              • Exhibit 150: MicroPort Scientific Corp. - Business segments
              • Exhibit 151: MicroPort Scientific Corp. - Key offerings
              • Exhibit 152: MicroPort Scientific Corp. - Segment focus
            • 12.15 Smith and Nephew plc
              • Exhibit 153: Smith and Nephew plc - Overview
              • Exhibit 154: Smith and Nephew plc - Business segments
              • Exhibit 155: Smith and Nephew plc - Key news
              • Exhibit 156: Smith and Nephew plc - Key offerings
              • Exhibit 157: Smith and Nephew plc - Segment focus
            • 12.16 Stryker Corp.
              • Exhibit 158: Stryker Corp. - Overview
              • Exhibit 159: Stryker Corp. - Business segments
              • Exhibit 160: Stryker Corp. - Key news
              • Exhibit 161: Stryker Corp. - Key offerings
              • Exhibit 162: Stryker Corp. - Segment focus
            • 12.17 Zimmer Biomet Holdings Inc.
              • Exhibit 163: Zimmer Biomet Holdings Inc. - Overview
              • Exhibit 164: Zimmer Biomet Holdings Inc. - Business segments
              • Exhibit 165: Zimmer Biomet Holdings Inc. - Key news
              • Exhibit 166: Zimmer Biomet Holdings Inc. - Key offerings
              • Exhibit 167: Zimmer Biomet Holdings Inc. - Segment focus

            13 Appendix

            • 13.1 Scope of the report
              • 13.2 Inclusions and exclusions checklist
                • Exhibit 168: Inclusions checklist
                • Exhibit 169: Exclusions checklist
              • 13.3 Currency conversion rates for US$
                • Exhibit 170: Currency conversion rates for US$
              • 13.4 Research methodology
                • Exhibit 171: Research methodology
                • Exhibit 172: Validation techniques employed for market sizing
                • Exhibit 173: Information sources
              • 13.5 List of abbreviations
                • Exhibit 174: List of abbreviations

              Research Methodology

              Technavio presents a detailed picture of the market by way of study, synthesis, and summation of data from multiple sources. The analysts have presented the various facets of the market with a particular focus on identifying the key industry influencers. The data thus presented is comprehensive, reliable, and the result of extensive research, both primary and secondary.

              INFORMATION SOURCES

              Primary sources

              • Manufacturers and suppliers
              • Channel partners
              • Industry experts
              • Strategic decision makers

              Secondary sources

              • Industry journals and periodicals
              • Government data
              • Financial reports of key industry players
              • Historical data
              • Press releases

              DATA ANALYSIS

              Data Synthesis

              • Collation of data
              • Estimation of key figures
              • Analysis of derived insights

              Data Validation

              • Triangulation with data models
              • Reference against proprietary databases
              • Corroboration with industry experts

              REPORT WRITING

              Qualitative

              • Market drivers
              • Market challenges
              • Market trends
              • Five forces analysis

              Quantitative

              • Market size and forecast
              • Market segmentation
              • Geographical insights
              • Competitive landscape

              Interested in this report?

              Get your sample now to see our research methodology and insights!

              Download Now

              Frequently Asked Questions

              Knee Replacement market growth will increase by $ 4.13 bn during 2024-2028.

              The Knee Replacement market is expected to grow at a CAGR of 6.91% during 2024-2028.

              Knee Replacement market is segmented by Product( TKR, RKR, PKR) End-user( Hospitals and specialty clinics, Ambulatory surgical clinics, Ambulatory surgical clinics, Rest of World (ROW))

              ADLER ORTHO S.p.A., Amplitude SAS, Arthrex Inc., B.Braun SE, Conformis Inc., Corin Group Plc, Enovis Corp., Exactech Inc., Fuse Medical Inc., implantcast GmbH, Johnson and Johnson Services Inc., Just Medical Devices Tianjin Co. Ltd, Limacorporate SpA, Medacta Group SA, Merete Technologies Inc., MicroPort Scientific Corp., Smith and Nephew plc, Stryker Corp., Waldemar Link GmbH and Co. KG, Zimmer Biomet Holdings Inc. are a few of the key vendors in the Knee Replacement market.

              North America will register the highest growth rate of 50% among the other regions. Therefore, the Knee Replacement market in North America is expected to garner significant business opportunities for the vendors during the forecast period.

              US, Canada, Germany, France, China

              • Increasing government support for healthcare enabling better access to orthopedic proceduresIncreasing government support for the healthcare industry is a significant driver for the global knee replacement market. Governments around the world are recognizing the growing need for healthcare is the driving factor this market.
              • including orthopedic procedures is the driving factor this market.
              • such as knee replacement surgeries is the driving factor this market.
              • due to the increasing geriatric population and the rising prevalence of orthopedic conditions like osteoarthritis. In response is the driving factor this market.
              • many governments are implementing policies to enhance access to healthcare services is the driving factor this market.
              • including orthopedic surgeries is the driving factor this market.
              • through increased funding is the driving factor this market.
              • subsidies is the driving factor this market.
              • and insurance coverage. This is making prosthetics or implant surgeries accessible to a greater number of people. For instance is the driving factor this market.
              • in Germany is the driving factor this market.
              • the Health Insurance Compulsory Law ensures that all residents are covered under a common health insurance program and are entitled to insurance benefits is the driving factor this market.
              • including universal access to medical specialists; physiotherapy; and medical aids is the driving factor this market.
              • such as prosthetics. Similarly is the driving factor this market.
              • in the US is the driving factor this market.
              • the government funds over 60% of the total healthcare expenditure is the driving factor this market.
              • making implant surgeries more affordable and accessible for the general population. By 2024 is the driving factor this market.
              • the public tax-funded healthcare expenditure in the US is expected to rise because of the increase in the governments contribution to healthcare funding. Several developed countries is the driving factor this market.
              • including Canada is the driving factor this market.
              • Sweden is the driving factor this market.
              • and the UK is the driving factor this market.
              • have similar universal healthcare programs that subsidize the cost of medical devices and arthroplasty. This is leading to an increased demand for knee replacement surgeries. Thus is the driving factor this market.
              • such factors are expected to drive the growth of the global knee replacement market during the forecast period. is the driving factor this market.

              The Knee Replacement market vendors should focus on grabbing business opportunities from the TKR segment as it accounted for the largest market share in the base year.