Bone Cement Market Size 2025-2029
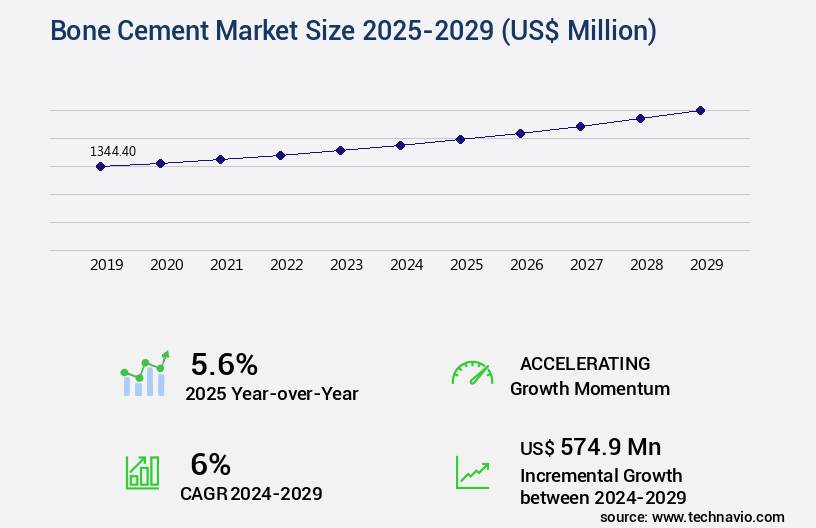
The bone cement market size is valued to increase USD 574.9 million, at a CAGR of 6% from 2024 to 2029. Growing prevalence of orthopedic disorders due to rise in trauma cases will drive the bone cement market.
Major Market Trends & Insights
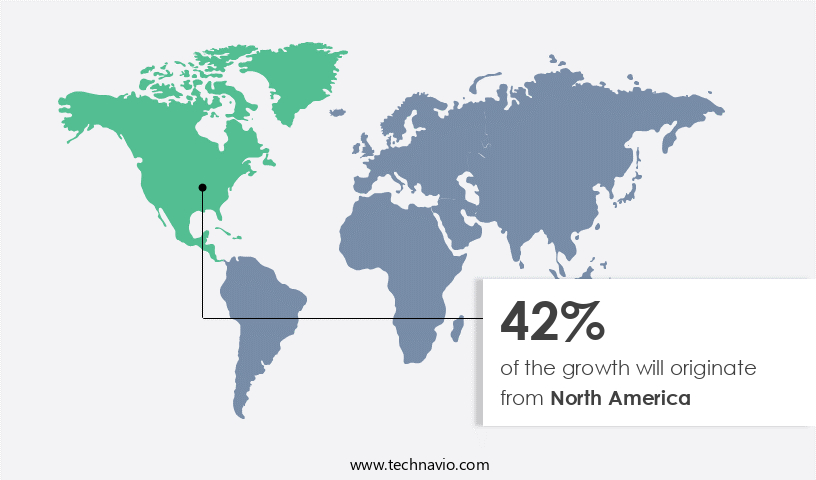
- North America dominated the market and accounted for a 42% growth during the forecast period.
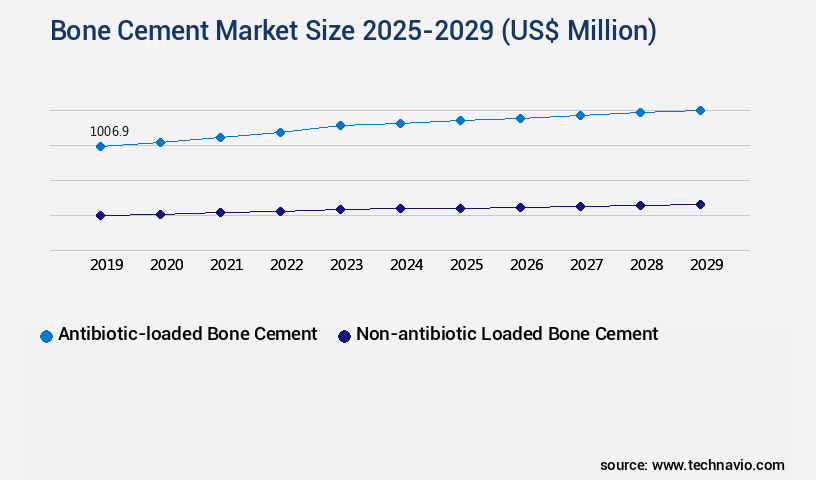
- By Product - Antibiotic-loaded bone cement segment was valued at USD 1006.90 million in 2023
- By End-user - Hospitals segment accounted for the largest market revenue share in 2023
Market Size & Forecast
- Market Opportunities: USD 68.27 million
- Market Future Opportunities: USD 574.90 million
- CAGR from 2024 to 2029: 6%
Market Summary
- The market has experienced significant expansion due to the increasing prevalence of orthopedic disorders, driven primarily by the rising number of trauma cases worldwide. This trend is further fueled by the growing focus on bioresorbable materials, which offer advantages such as reduced complications and improved patient outcomes. However, the use of bone cement is not without challenges. Complications, including cement leakage and allergic reactions, continue to pose significant hurdles for market growth. Despite these challenges, innovation remains a key driver, with ongoing research into advanced formulations and delivery systems aimed at enhancing the functionality and safety of bone cement.
- The market's future direction lies in the development of more effective, patient-specific solutions that address the unique needs of each patient, ultimately leading to better clinical outcomes and improved quality of life. According to a recent study, the market was valued at over USD 3 billion in 2020, underscoring its importance in the orthopedic industry.
What will be the Size of the Bone Cement Market during the forecast period?
Get Key Insights on Market Forecast (PDF) Request Free Sample
How is the Bone Cement Market Segmented ?
The bone cement industry research report provides comprehensive data (region-wise segment analysis), with forecasts and estimates in "USD million" for the period 2025-2029, as well as historical data from 2019-2023 for the following segments.
- Product
- Antibiotic-loaded bone cement
- Non-antibiotic loaded bone cement
- End-user
- Hospitals
- Clinics
- Ambulatory surgery centers
- Type
- PMMA cement
- Calcium phosphate cement
- Glass polyalkenoate cement
- Application
- Arthroplasty
- Kyphoplasty
- Vertebroplasty
- Others
- Geography
- North America
- US
- Canada
- Europe
- France
- Germany
- Italy
- UK
- APAC
- China
- India
- Japan
- South America
- Brazil
- Rest of World (ROW)
- North America
By Product Insights
The antibiotic-loaded bone cement segment is estimated to witness significant growth during the forecast period.
Bone cement, a crucial component in orthopedic procedures, continues to evolve with ongoing research and development. Its handling characteristics, including compressive strength and setting time kinetics, are essential for successful implant fixation. Porosity measurement and mixing technique play a significant role in cement polymerization, influencing the rheological properties and in vivo degradation rate. The kyphoplasty technique and syringe delivery system enable precise cement injection, while hydroxyapatite cement and calcium sulfate offer advantages in bone defect repair.
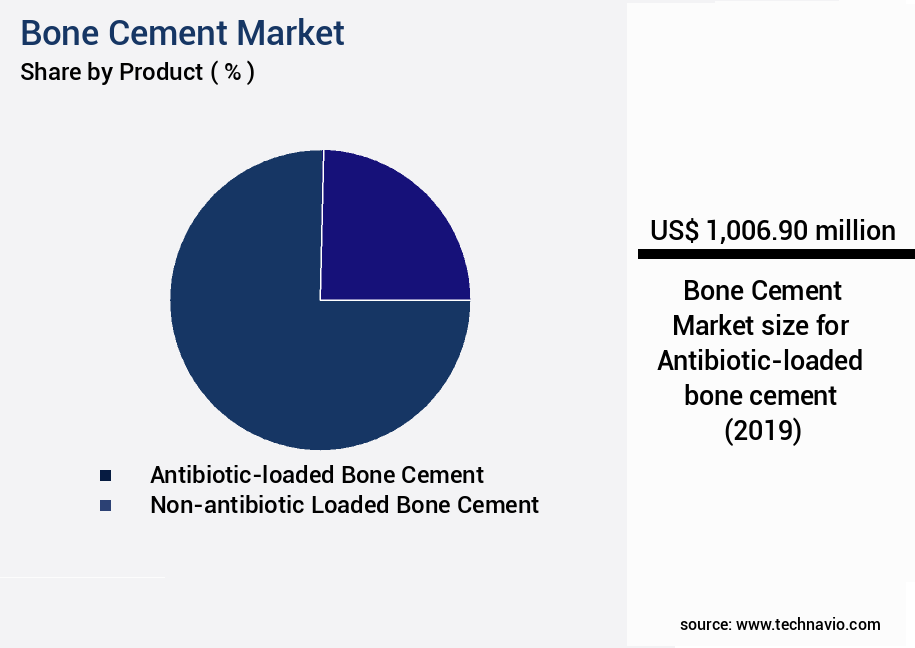
The Antibiotic-loaded bone cement segment was valued at USD 1006.90 million in 2019 and showed a gradual increase during the forecast period.
The use of antibiotic-loaded bone cement, a popular trend, enhances infection prevention and local drug delivery. The FDA approves premixed bone cement containing 0.5 g-1 g of antibiotics per 40 g of PMMA for second-stage reimplantation. This antibiotic elution property, influenced by cement porosity, improves infection treatment in complex musculoskeletal infections during joint arthroplasties and orthopedic surgeries. Biocompatibility testing, radiopaque additives, and polymerization inhibitors are other crucial factors in ensuring safe and effective surgical applications.
Regional Analysis
North America is estimated to contribute 42% to the growth of the global market during the forecast period. Technavio's analysts have elaborately explained the regional trends and drivers that shape the market during the forecast period.
See How Bone Cement Market Demand is Rising in North America Request Free Sample
The market is witnessing significant growth, with North America holding a substantial share due to the widespread adoption of minimally invasive procedures such as joint reconstruction, fusion procedures, and fractures. The region's dominance is attributed to the high prevalence of orthopaedic disorders and the increasing number of orthopaedic-related surgeries. According to recent studies, the number of orthopaedic procedures in the US alone is projected to reach over 5 million annually. In response, leading companies in the region are focusing on the development of highly biocompatible bone cement to cater to the growing patient base.
Furthermore, the presence of several well-established companies with their headquarters in the US enables them to effectively market their products in this region. The market's expansion is driven by the increasing geriatric population and the rising incidence of bone-related disorders.
Market Dynamics
Our researchers analyzed the data with 2024 as the base year, along with the key drivers, trends, and challenges. A holistic analysis of drivers will help companies refine their marketing strategies to gain a competitive advantage.
The market is experiencing significant growth due to the increasing demand for orthopedic and spinal surgical procedures. Bone cement plays a crucial role in these procedures as a bone void filler, providing mechanical strength and biocompatibility to the implant site. Polymethyl methacrylate (PMMA) cement is the most commonly used type in orthopedic applications, known for its excellent setting properties and high compressive strength. However, its degradation rate in vivo and potential toxicity have raised concerns, leading to the exploration of alternative cements like hydroxyapatite (HA) cement. HA cement exhibits improved biocompatibility and osteoconductivity, making it an attractive alternative. Calcium sulfate cement, another type of bone cement, offers a shorter setting time and better bone ingrowth. However, its lower mechanical strength and susceptibility to degradation limit its use in load-bearing applications. Radiopaque additives in bone cement enhance its visibility during surgical procedures, ensuring proper placement and reducing the risk of cement leakage. Rheological properties of bone cement, such as viscosity, are essential for easy handling and injection during surgical procedures. Bone cement's porosity measurement techniques and degradation products analysis are crucial for understanding its long-term performance in vivo. Biocompatibility testing of bone cement, including compressive strength, cement polymerization kinetics, and antibiotic loaded bone cement efficacy, are essential to ensure safety and efficacy. Innovations in bone cement include drug delivery systems, cement particle size distribution control, and viscosity control methods, which expand its applications and improve patient outcomes. Cement injection techniques in vertebroplasty and leakage prevention strategies are critical to minimize complications and optimize surgical outcomes. Overall, the market continues to evolve, driven by advancements in materials science and surgical techniques.
What are the key market drivers leading to the rise in the adoption of Bone Cement Industry?
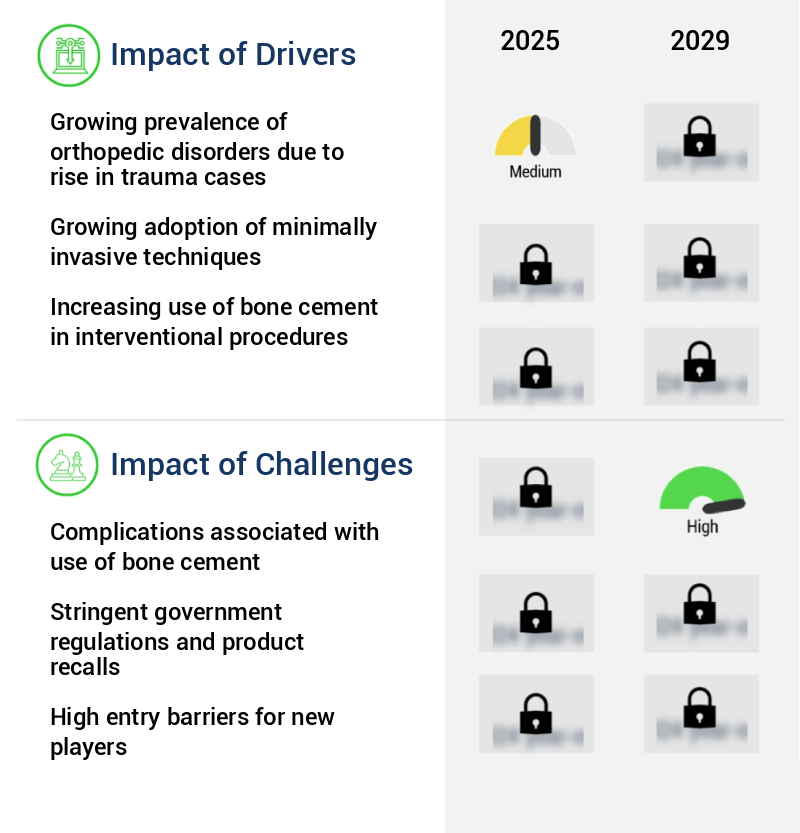
- The increasing prevalence of orthopedic disorders, primarily caused by the surge in trauma cases, serves as the primary driver for the market's growth.
- Trauma, a significant cause of disability and death, claims nearly 78,000 lives annually in the US among individuals under 45 years old. This accounts for a substantial portion of potential years of life lost for those below 65. Trauma-related injuries encompass various types, including spinal cord injuries, joint injuries, and abdominal injuries. Orthopedic surgeries, such as joint replacement and spinal cord fixation, are common interventions to address trauma-induced damage. The market, a critical component in these procedures, is evolving to meet the growing demand for advanced solutions.
- This market is expected to expand significantly, with orthopedic applications accounting for a substantial market share. The market is poised to reach approximately 3.5 billion units by 2027, exhibiting a robust growth trajectory.
What are the market trends shaping the Bone Cement Industry?
- The increasing emphasis on bioresorbable materials represents a significant market trend. This developing trend in materials science is gaining significant attention.
- The market is witnessing a significant shift towards the adoption of bioresorbable materials in bone cement formulations. Bioresorbable bone cements, which gradually degrade and get absorbed by the body, offer numerous benefits over traditional non-resorbable cements. These materials facilitate natural bone healing and remodeling, eliminating the need for implant removal surgeries and reducing long-term complications. One notable player in this field is Stryker Corporation, which has incorporated bioresorbable polymers into its bone cement products. This innovative formulation ensures initial stability for joint replacements while gradually degrading and allowing bone ingrowth. The use of bioresorbable bone cement is gaining traction in various sectors, including orthopedics and dental applications, due to its advantages in patient outcomes and overall clinical effectiveness.
What challenges does the Bone Cement Industry face during its growth?
- The use of bone cement in the orthopedic industry is accompanied by complications, which pose a significant challenge to the sector's growth.
- The market is undergoing significant evolution, with applications spanning various sectors, including orthopedics and dental. Despite developed economies' increasing preference for antibiotic-loaded bone cement to mitigate infection risks, emerging economies continue to utilize non-antibiotic bone cement due to cost considerations and associated complications. One such complication is Bone Cement Implantation Syndrome (BCIS), which poses a substantial challenge to the market's growth. BCIS, a rare but potentially life-threatening condition, can lead to intraoperative morbidity and mortality in individuals undergoing cemented bone surgery.
- Characterized by symptoms such as hypoxia, hypotension, and increased pulmonary vascular resistance, BCIS can result in cardiac arrest, loss of consciousness, or a combination of these features.
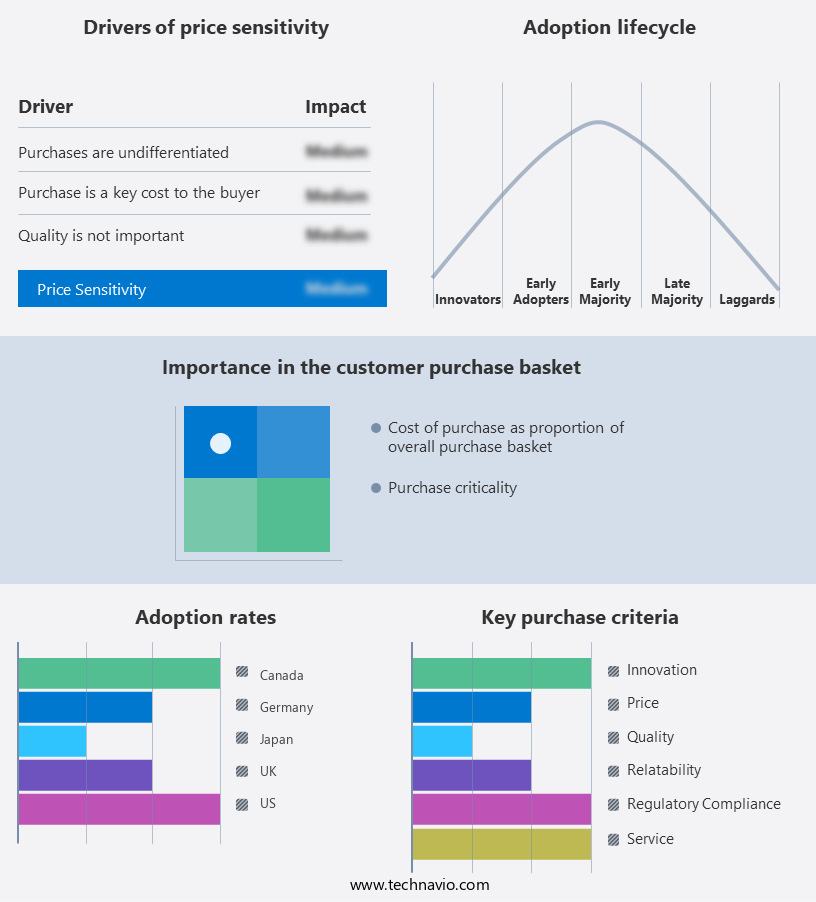
Exclusive Technavio Analysis on Customer Landscape
The bone cement market forecasting report includes the adoption lifecycle of the market, covering from the innovator's stage to the laggard's stage. It focuses on adoption rates in different regions based on penetration. Furthermore, the bone cement market report also includes key purchase criteria and drivers of price sensitivity to help companies evaluate and develop their market growth analysis strategies.
Customer Landscape of Bone Cement Industry
Competitive Landscape
Companies are implementing various strategies, such as strategic alliances, bone cement market forecast, partnerships, mergers and acquisitions, geographical expansion, and product/service launches, to enhance their presence in the industry.
aap Implantate AG - This company specializes in producing advanced bone cement solutions, such as OsteoCem, catering to the medical industry's demand for effective bone repair materials.
The industry research and growth report includes detailed analyses of the competitive landscape of the market and information about key companies, including:
- aap Implantate AG
- Alphatec Holdings Inc.
- Enovis Corp.
- EVOLUTIS SAS
- Exactech Inc.
- G21 Srl
- Globus Medical Inc.
- Heraeus Holding GmbH
- Johnson and Johnson Services Inc.
- Kyeron
- Medacta International SA
- Medtronic Plc
- Merit Medical Systems Inc.
- Olympus Corp.
- Smith and Nephew plc
- Stryker Corp.
- Synimed Synergie Ingenierie Medicale SARL
- Tecres Spa
- Teknimed
- Zimmer Biomet Holdings Inc.
Qualitative and quantitative analysis of companies has been conducted to help clients understand the wider business environment as well as the strengths and weaknesses of key industry players. Data is qualitatively analyzed to categorize companies as pure play, category-focused, industry-focused, and diversified; it is quantitatively analyzed to categorize companies as dominant, leading, strong, tentative, and weak.
Recent Development and News in Bone Cement Market
- In January 2024, Stryker Corporation, a leading medical technology company, announced the launch of its new generation of Vitoss Plus bone cement, which offers enhanced handling properties and improved bone ingrowth. This innovation was aimed at addressing the challenges of traditional bone cement and improving surgical outcomes (Stryker Corporation Press Release, 2024).
- In March 2024, Medtronic plc and 3D Systems entered into a strategic partnership to develop and commercialize 3D-printed bone cement implants. This collaboration aimed to leverage Medtronic's expertise in orthopedics and 3D Systems' advanced 3D printing technology to create customized bone cement implants for personalized patient care (Medtronic plc Press Release, 2024).
- In May 2024, Smith & Nephew reported the successful completion of a clinical trial for its new BIOACTIVE ELITE bone cement. The trial demonstrated a significant reduction in infection rates and improved bone ingrowth compared to traditional cement. This breakthrough innovation was expected to significantly impact the market share and set a new standard in bone cement technology (Smith & Nephew Press Release, 2024).
- In April 2025, Zimmer Biomet Holdings, Inc. announced the acquisition of OrthoGenesis Holdings, Inc., a leading provider of bone graft substitutes and regenerative solutions. This strategic acquisition was aimed at expanding Zimmer Biomet's portfolio of orthopedic products and enhancing its position in the bone graft substitutes market (Zimmer Biomet Holdings, Inc. Press Release, 2025).
Dive into Technavio's robust research methodology, blending expert interviews, extensive data synthesis, and validated models for unparalleled Bone Cement Market insights. See full methodology.
|
Market Scope |
|
|
Report Coverage |
Details |
|
Page number |
235 |
|
Base year |
2024 |
|
Historic period |
2019-2023 |
|
Forecast period |
2025-2029 |
|
Growth momentum & CAGR |
Accelerate at a CAGR of 6% |
|
Market growth 2025-2029 |
USD 574.9 million |
|
Market structure |
Fragmented |
|
YoY growth 2024-2025(%) |
5.6 |
|
Key countries |
US, Germany, Canada, UK, France, Japan, China, Italy, India, and Brazil |
|
Competitive landscape |
Leading Companies, Market Positioning of Companies, Competitive Strategies, and Industry Risks |
Research Analyst Overview
- The market continues to evolve, driven by advancements in implant fixation techniques and the development of new handling characteristics. These innovations aim to mitigate issues such as bone cement leakage and improve cement injection methods, ensuring optimal compressive strength and setting time kinetics. For instance, the kyphoplasty technique has gained popularity in spinal surgery due to its ability to reduce cement leakage by up to 70% compared to traditional vertebroplasty procedures. Moreover, the industry anticipates significant growth, with expectations of a 5% annual increase in demand for bone cement. This growth is attributed to the expanding applications of bone cement in fracture fixation, bone regeneration, and bone graft substitute, among others.
- In the realm of research and development, efforts are underway to enhance the rheological properties of cement through the use of polymethyl methacrylate and polymerization inhibitors. Additionally, the integration of drug delivery systems, antibiotic-loaded cement, and hydroxyapatite cement is revolutionizing the field of bone defect repair. Furthermore, the market is witnessing the introduction of advanced syringe delivery systems, enabling precise cement injection and minimizing the risk of complications. The osseointegration process is also being optimized through biocompatibility testing and the development of radiopaque additives, ensuring better tissue integration and improved surgical applications. Despite these advancements, challenges remain, including the need for viscosity control during cement polymerization and the ongoing investigation of cement degradation rates.
- Calcium sulfate and other bone cement alternatives are also gaining traction due to their unique properties and potential applications. In summary, the market is a dynamic and evolving landscape, driven by continuous innovation and the pursuit of optimal implant fixation, tissue integration, and bone regeneration. The integration of advanced technologies and materials is poised to revolutionize the field and address ongoing challenges, ensuring the ongoing success of this vital industry.
What are the Key Data Covered in this Bone Cement Market Research and Growth Report?
-
What is the expected growth of the Bone Cement Market between 2025 and 2029?
-
USD 574.9 million, at a CAGR of 6%
-
-
What segmentation does the market report cover?
-
The report is segmented by Product (Antibiotic-loaded bone cement and Non-antibiotic loaded bone cement), End-user (Hospitals, Clinics, and Ambulatory surgery centers), Type (PMMA cement, Calcium phosphate cement, and Glass polyalkenoate cement), Application (Arthroplasty, Kyphoplasty, Vertebroplasty, and Others), and Geography (North America, Europe, Asia, and Rest of World (ROW))
-
-
Which regions are analyzed in the report?
-
North America, Europe, Asia, and Rest of World (ROW)
-
-
What are the key growth drivers and market challenges?
-
Growing prevalence of orthopedic disorders due to rise in trauma cases, Complications associated with use of bone cement
-
-
Who are the major players in the Bone Cement Market?
-
aap Implantate AG, Alphatec Holdings Inc., Enovis Corp., EVOLUTIS SAS, Exactech Inc., G21 Srl, Globus Medical Inc., Heraeus Holding GmbH, Johnson and Johnson Services Inc., Kyeron, Medacta International SA, Medtronic Plc, Merit Medical Systems Inc., Olympus Corp., Smith and Nephew plc, Stryker Corp., Synimed Synergie Ingenierie Medicale SARL, Tecres Spa, Teknimed, and Zimmer Biomet Holdings Inc.
-
Market Research Insights
- The market for bone cement continues to evolve, with ongoing research and development in various areas. For instance, advancements in surgical techniques have led to improved bone remodeling and implant stability. In radiographic imaging, the use of advanced technologies has facilitated better assessment of cement setting and bone ingrowth. One notable example of market dynamics is the increase in demand for surface-modified bone cements, which have shown enhanced biocompatibility and improved mechanical properties. According to industry reports, the market is projected to grow by over 5% annually in the coming years, driven by the aging population, rising incidence of orthopedic disorders, and technological advancements.
- Moreover, the cement composition, including monomer content and polymer chemistry, plays a crucial role in cement degradation and inflammatory response. In vitro studies have shown that optimizing these factors can lead to better long-term stability and compressive modulus. Furthermore, rheological behavior, cell adhesion, and biomaterial interaction are other critical aspects that are being extensively researched to improve the overall performance of bone cements. Filler particles and degradation products also significantly impact the market, with ongoing efforts to minimize their negative effects on bone health and implant stability. Mechanical testing and mechanical properties, such as flexural strength and powder-liquid ratio, are essential considerations in the development and evaluation of new bone cement formulations.
We can help! Our analysts can customize this bone cement market research report to meet your requirements.
 RIA -
RIA - 
