
Chickpea Market Size 2024-2028
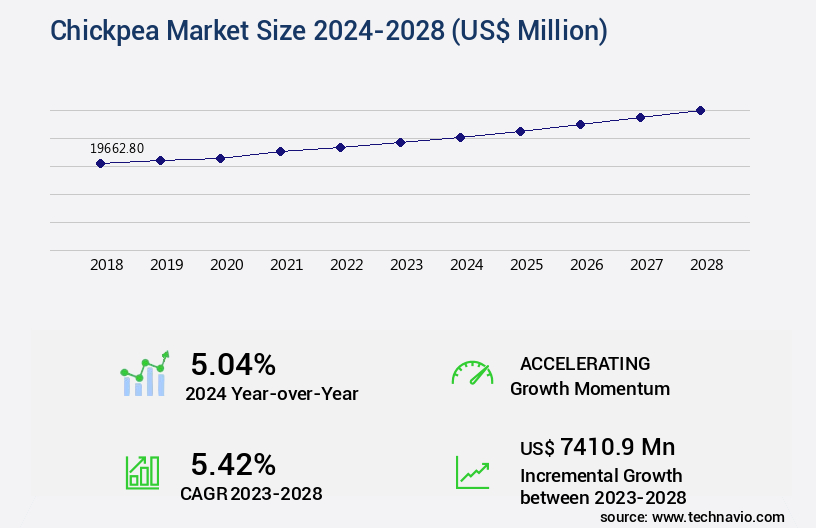
The chickpea market size is valued to increase by USD 7.41 billion, at a CAGR of 5.42% from 2023 to 2028. Increasing consumption of chickpeas as a snacking item will drive the chickpea market.
Market Insights
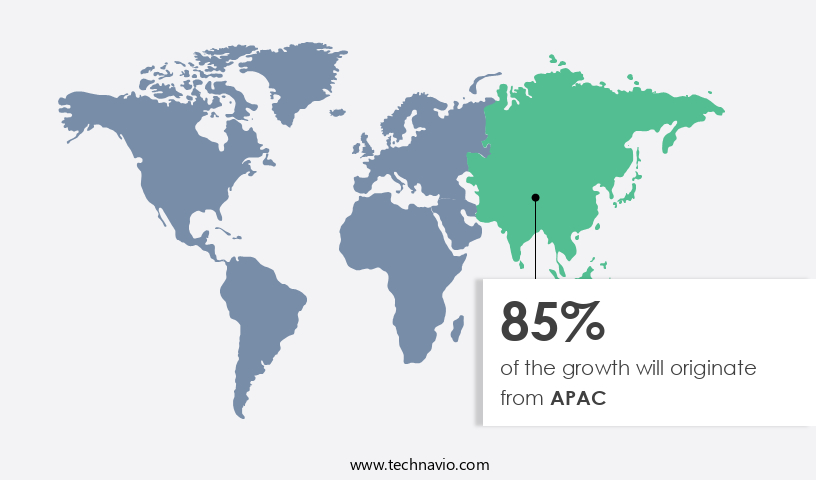
- APAC dominated the market and accounted for a 85% growth during the 2024-2028.
- By Distribution Channel - Offline segment was valued at USD 19.29 billion in 2022
- By Product - Desi chickpea segment accounted for the largest market revenue share in 2022
Market Size & Forecast
- Market Opportunities: USD 62.54 million
- Market Future Opportunities 2023: USD 7410.90 million
- CAGR from 2023 to 2028: 5.42%
Market Summary
- Chickpeas, a versatile and nutrient-dense legume, have gained significant attention in the global food market due to increasing consumer preferences for plant-based proteins and healthier snacking options. The expanding base of the vegan population and the growing trend of flexitarianism are key drivers fueling the demand for chickpeas. However, the production of chickpeas faces challenges due to uncertainty in rainfall patterns, which significantly impact crop yields in major producing countries like India and China. The market's growth is underpinned by its widespread use in various food applications, including hummus, falafel, and various savory and sweet dishes.
- Moreover, chickpeas' high protein and fiber content make them an attractive alternative to animal-derived protein sources. A real-world business scenario illustrating the market's dynamics revolves around a food processing company aiming to optimize its supply chain. To ensure a consistent and reliable supply of chickpeas, the company invests in long-term contracts with farmers and implements advanced weather forecasting technologies to mitigate risks associated with crop production. By doing so, the company secures its supply chain and maintains operational efficiency, ultimately delivering high-quality products to its customers.
What will be the size of the Chickpea Market during the forecast period?
Get Key Insights on Market Forecast (PDF) Request Free Sample
- The market continues to evolve, with consumer preferences shifting towards sustainable and climate-smart agriculture practices. Integrated pest management and irrigation scheduling are essential strategies for optimizing chickpea production. For instance, precision nutrient placement and fertilizer application methods can enhance crop yield and reduce nutritional deficiencies. Moreover, abiotic stress response is a critical area of research, as chickpeas are susceptible to drought and temperature fluctuations. In the realm of postharvest management, quality assessment methods and food processing techniques are crucial for maintaining food safety and extending shelf life. Remote sensing applications and data-driven decision making are increasingly adopted for efficient market access and food security.
- Climate-smart agriculture practices, such as soil microbial diversity and crop modeling, are essential for sustainable intensification and yield prediction. One notable trend in the market is the emphasis on biotic stress resistance. According to the Food and Agriculture Organization (FAO), chickpeas are the third most important food legume globally, with an estimated 14.6 million hectares cultivated in 2019. However, biotic stresses, such as diseases and pests, can significantly impact chickpea production. Therefore, investing in research and development for biotic stress resistance is a strategic priority for stakeholders in the market. In conclusion, the market is a dynamic and evolving landscape, with a focus on sustainable agriculture practices, postharvest management, and biotic stress resistance.
- By adopting these strategies, stakeholders can enhance chickpea production, improve food security, and ensure the long-term sustainability of the market.
Unpacking the Chickpea Market Landscape
Chickpeas, a staple legume in sustainable agriculture, exhibit superior seed quality parameters, with an average protein content of 21%, surpassing that of other common pulses. This nutritional advantage translates into improved return on investment for food manufacturers, catering to consumer demand for high-protein, plant-based options. Soil health indicators also benefit from chickpea cultivation, as they contribute to improved leaf area index, enhancing water use efficiency and promoting biodiversity through crop rotation systems. Furthermore, chickpeas' stress response pathways enable them to thrive in various climates, increasing yield improvement strategies in precision farming. Nutrient management practices, such as potassium fertilization and nitrogen fixation, bolster crop productivity while minimizing environmental impact. Breeding programs focus on genetic improvement, including disease resistance genes and carbohydrate metabolism, ensuring consistent harvests and reducing the need for pesticides. Chickpeas' fiber quality, sensory attributes, and mineral composition cater to diverse consumer preferences and dietary requirements, making them a valuable commodity in the global food market.
Key Market Drivers Fueling Growth
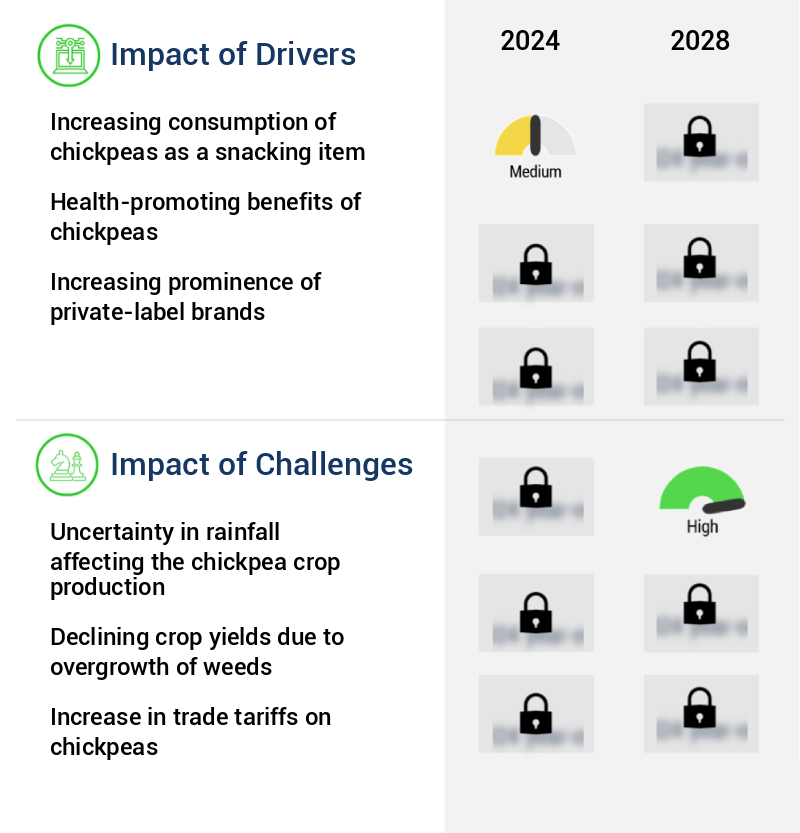
The significant rise in the consumption of chickpeas as a popular snacking option serves as the primary growth catalyst for the market.
- Chickpeas, a versatile legume, are gaining significant attention and acceptance across various sectors due to their nutritional benefits and ease of use. Rich in fiber, folate, protein, and zinc, chickpeas are increasingly being adopted as convenient and healthful snacks in numerous regions. In Turkey, roasted Kabuli chickpeas are a popular snack, salted and spiced with cloves. In Iran, roasted chickpeas are combined with raisins and salt to create a widely consumed mix. In South Asia, particularly India, chickpeas snacks hold immense popularity.
- The snack industry has witnessed notable advancements, with ready-to-eat chickpea products becoming increasingly accessible. These innovations have led to a reduction in preparation time and increased consumer convenience. Additionally, chickpeas' versatility extends to various culinary applications, further expanding their market reach.
Prevailing Industry Trends & Opportunities
The vegan population is experiencing significant growth, emerging as a notable market trend.
- The market is experiencing significant growth due to the expanding vegan population base and increasing consumer preference for plant-based proteins. In 2023, Europe counted 2.6 million vegans, equivalent to 3.2% of its total population, while the US had over 9 million vegans. This shift towards plant-based diets is driven by concerns over allergen exposure and the desire for optimal nutrition. Simultaneously, the rapidly expanding working population worldwide and their busy lifestyles have fueled the demand for convenient, nutritious food options.
- Chickpeas, a versatile and protein-rich legume, have gained popularity in various sectors, including food and beverage, cosmetics, and pharmaceuticals. Companies are innovating with chickpea-based products, leading to reduced reliance on traditional animal-derived protein sources. This trend is expected to continue, as the market for chickpea-based products is projected to grow at a robust rate.
Significant Market Challenges
The chickpea industry faces significant challenges due to the uncertainty and potential impact of variable rainfall amounts on crop production. This uncertainty negatively affects industry growth.
- The market exhibits an evolving nature, driven by its diverse applications across various sectors, including food, feed, and industrial uses. Desi and Kabuli chickpeas, the two major types, have distinct cultivation requirements. While India, Pakistan, and Turkey are significant producers, their yields are influenced by rainfall and soil conditions. These countries, which rely heavily on rainfall, face challenges due to water shortages and drought. In contrast, Iran, another major chickpea producer, primarily relies on rainfall for cultivation. The crop thrives in cool, wet conditions, with Desi chickpeas requiring a minimum annual rainfall of 350 mm and Kabuli chickpeas, 450 mm.
- These agricultural practices contribute to operational cost savings, with irrigation expenses minimized. Additionally, chickpeas' nutritional value, rich in protein and dietary fiber, makes them an essential food source, further boosting market growth. The crop's versatility in various industries, from food processing to animal feed, ensures a stable market demand.
In-Depth Market Segmentation: Chickpea Market
The chickpea industry research report provides comprehensive data (region-wise segment analysis), with forecasts and estimates in "USD million" for the period 2024-2028, as well as historical data from 2018-2022 for the following segments.
- Distribution Channel
- Offline
- Online
- Product
- Desi chickpea
- Kabuli chickpea
- Form
- Whole
- Split
- Flour (Besan)
- Processed (Canned, Roasted, Sprouted)
- Application
- Food & Beverages (Flour Production, Snacks, Hummus & Dips, Salads, Curries & Stews, Soups)
- Animal Feed
- Seed
- Nature
- Organic
- Conventional
- End-use Industry
- Household
- Foodservice
- Food Processing
- Geography
- North America
- US
- Canada
- Europe
- France
- Germany
- Italy
- UK
- Middle East and Africa
- Egypt
- KSA
- Oman
- UAE
- Turkey
- APAC
- China
- India
- Japan
- South America
- Argentina
- Brazil
- Rest of World (ROW)
- North America
By Distribution Channel Insights
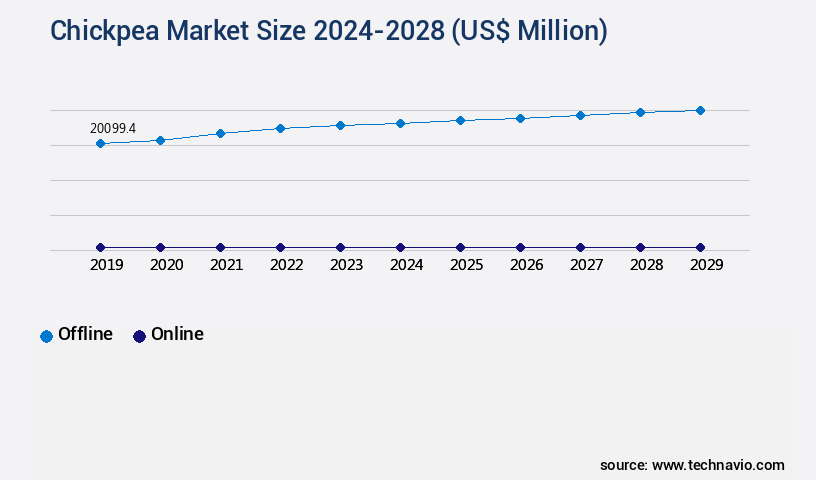
The offline segment is estimated to witness significant growth during the forecast period.
The market continues to evolve, with a focus on enhancing seed quality parameters and promoting sustainable agriculture. Soil health indicators play a crucial role in chickpea cultivation, and research emphasizes the importance of mineral composition, water use efficiency, and precision farming technologies for optimal yield improvement. Protein content, sensory attributes, and nutritional value remain key priorities, with ongoing efforts in genetic improvement through breeding programs and molecular markers. Stress response pathways, such as leaf area index and nitrogen fixation, are being explored to bolster resilience against drought and disease. Crop rotation systems and nutrient management practices are also essential for maintaining optimal growing conditions.
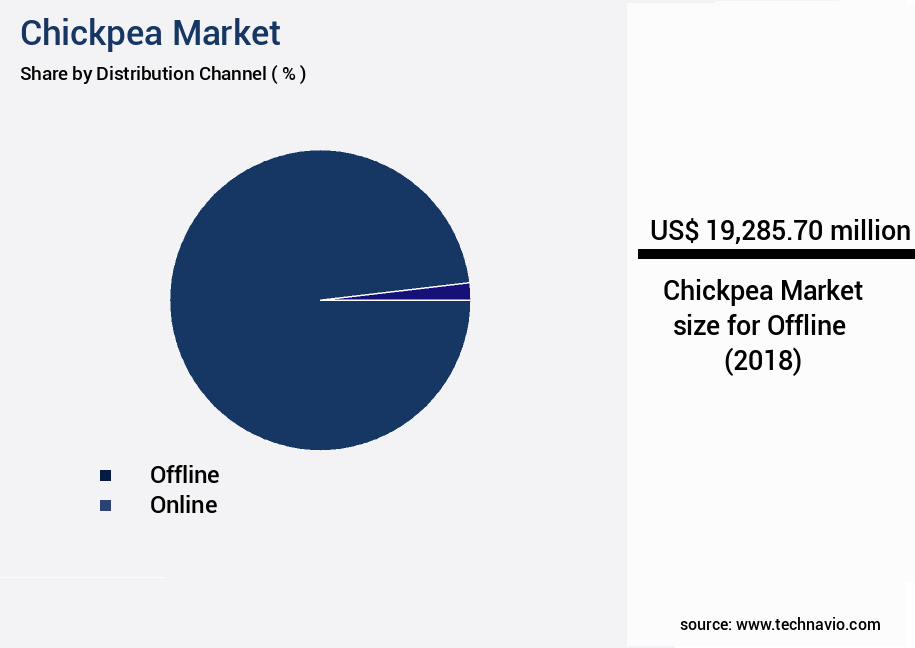
The Offline segment was valued at USD 19.29 billion in 2018 and showed a gradual increase during the forecast period.
Convenience and grocery stores, with their increasing numbers in major countries like the UK, China, India, and Japan, offer significant distribution channels for chickpeas. Supermarkets and hypermarkets, driven by attractive shelf displays and discounts, continue to be the most popular distribution channels. Additionally, advances in carbohydrate metabolism, potassium fertilization, germination rate, and grain filling contribute to the ongoing innovation in the market.
Regional Analysis
APAC is estimated to contribute 85% to the growth of the global market during the forecast period. Technavio's analysts have elaborately explained the regional trends and drivers that shape the market during the forecast period.
See How Chickpea Market Demand is Rising in APAC Request Free Sample
The market in the Asia-Pacific (APAC) region is experiencing significant growth, driven by increasing consumption and production in key countries. Chickpeas, a legume traditionally grown in temperate climates, offer numerous benefits, including improved soil properties and high nutritional value. South Asia leads the way in chickpea production and consumption within APAC, with India and Pakistan being major players. In fact, South Asia accounts for over 70% of the total chickpea production in the region. Australia is another significant producer, exporting a substantial amount to major consumers like India and the Gulf countries.
Farmers in South Asian countries have expanded the area under chickpeas cultivation, contributing to operational efficiency gains and cost reductions. The market's evolving nature and potential for farmers in the region underscore its importance and the significant role it plays in APAC's agricultural landscape.
Customer Landscape of Chickpea Industry
Competitive Intelligence by Technavio Analysis: Leading Players in the Chickpea Market
Companies are implementing various strategies, such as strategic alliances, chickpea market forecast, partnerships, mergers and acquisitions, geographical expansion, and product/service launches, to enhance their presence in the industry.
ABBOTT BLACKSTONE Co. Inc. - This company offers high-quality chickpeas for various culinary uses.
The industry research and growth report includes detailed analyses of the competitive landscape of the market and information about key companies, including:
- ABBOTT BLACKSTONE Co. Inc.
- AdasCan Grain Corp.
- AGT Food and Ingredients Inc.
- Anu Foods
- Ardent Mills LLC
- ATC Group India
- Bean Growers Australia Ltd.
- Cono Trading International AG
- DHAVAL AGRI EXPORT LLP
- GEEWIN EXIM
- Hippeas Inc.
- Nature Bio Foods Ltd.
- Nature Pulse Botanicals Pvt. Ltd.
- Organic Products India
- Popular Pulse Products Pvt. Ltd.
- Shri Mahavir Group
- Shubhlaxmi Industries
- SunOpta Inc.
- VAD Industries Pvt. Ltd.
- Woods Holding Group Pty. Ltd.
Qualitative and quantitative analysis of companies has been conducted to help clients understand the wider business environment as well as the strengths and weaknesses of key industry players. Data is qualitatively analyzed to categorize companies as pure play, category-focused, industry-focused, and diversified; it is quantitatively analyzed to categorize companies as dominant, leading, strong, tentative, and weak.
Recent Development and News in Chickpea Market
- In January 2025, Benson Foods, a leading chickpea processor, announced the launch of its new line of roasted chickpeas, "CrispyChick," at the Winter Fancy Food Show in San Francisco (Benson Foods Press Release). This innovative product expansion aimed to cater to the growing demand for plant-based snacks.
- In March 2025, Archer Daniels Midland Company (ADM) and Bunge Limited, two global agribusiness giants, entered into a strategic partnership to create a joint venture, PeaPak, focused on pea and chickpea processing (ADM Press Release). This collaboration aimed to strengthen their positions in the growing plant-based protein market.
- In May 2025, the European Commission approved the use of chickpeas as an ingredient in the production of bioethanol, paving the way for increased chickpea cultivation in Europe (European Commission Press Release). This regulatory approval was expected to boost the demand for chickpeas and create new opportunities for farmers and processors.
- In August 2024, Sabinsa Corporation, a leading herbal ingredients supplier, received a significant investment of USD20 million from its parent company, Sami-Sabinsa Group, to expand its chickpea extract production capacity (Sami-Sabinsa Press Release). This investment aimed to meet the growing demand for chickpea extracts, particularly in the functional food and beverage industry.
Dive into Technavio's robust research methodology, blending expert interviews, extensive data synthesis, and validated models for unparalleled Chickpea Market insights. See full methodology.
|
Market Scope |
|
|
Report Coverage |
Details |
|
Page number |
159 |
|
Base year |
2023 |
|
Historic period |
2018-2022 |
|
Forecast period |
2024-2028 |
|
Growth momentum & CAGR |
Accelerate at a CAGR of 5.42% |
|
Market growth 2024-2028 |
USD 7410.9 million |
|
Market structure |
Fragmented |
|
YoY growth 2023-2024(%) |
5.04 |
|
Key countries |
Burma (Myanmar), Turkey, US, Canada, Germany, UK, Italy, France, China, India, Japan, Brazil, Egypt, UAE, Oman, Argentina, KSA, UAE, Brazil, and Rest of World (ROW) |
|
Competitive landscape |
Leading Companies, Market Positioning of Companies, Competitive Strategies, and Industry Risks |
Why Choose Technavio for Chickpea Market Insights?
"Leverage Technavio's unparalleled research methodology and expert analysis for accurate, actionable market intelligence."
The market is a significant player in the global pulses sector, with increasing demand driven by its nutritional benefits and versatility. To optimize chickpea production and ensure sustainable farming practices, various strategies are being employed to enhance chickpea's productivity and resilience. One approach is to improve nitrogen use efficiency in chickpea farming through the application of nitrogen-fixing bacteria and efficient fertilizer management. Similarly, strategies to improve phosphorus acquisition in chickpea are crucial, as phosphorus is a limiting nutrient for chickpea growth. Another critical area of research is enhancing drought tolerance mechanisms in chickpea, given the increasing impact of climate change on agriculture. Assessing the impact of salinity on chickpea production is also essential, as salinity affects a significant portion of arable land worldwide. Managing fungal diseases in chickpea production is a significant challenge, and breeding for disease resistance is a key focus area. The effects of various irrigation methods on chickpea growth are also being evaluated, with precision agriculture technologies being explored to optimize water use and reduce wastage. Genetic diversity in chickpea germplasm is a valuable resource for breeding new varieties with improved protein and carbohydrate content. Molecular breeding techniques are being used to accelerate the breeding process and develop climate-resilient chickpea varieties. Evaluating seed quality traits and reducing postharvest losses are essential for ensuring a consistent supply chain and maintaining consumer confidence. Improving the nutritional value of chickpea-based products through value addition and consumer acceptance is also a critical business function. In comparison to traditional farming practices, sustainable intensification practices in chickpea farming, such as intercropping and crop rotation, can lead to a 20% increase in productivity while reducing the environmental footprint. By focusing on these areas, the market can ensure a sustainable and resilient supply chain, meeting the growing demand for this valuable crop.
What are the Key Data Covered in this Chickpea Market Research and Growth Report?
-
What is the expected growth of the Chickpea Market between 2024 and 2028?
-
USD 7.41 billion, at a CAGR of 5.42%
-
-
What segmentation does the market report cover?
-
The report is segmented by Distribution Channel (Offline and Online), Product (Desi chickpea and Kabuli chickpea), Geography (APAC, North America, Europe, Middle East and Africa, and South America), Form (Whole, Split, Flour (Besan), and Processed (Canned, Roasted, Sprouted)), Application (Food & Beverages (Flour Production, Snacks, Hummus & Dips, Salads, Curries & Stews, Soups), Animal Feed, and Seed), Nature (Organic and Conventional), and End-use Industry (Household, Foodservice, and Food Processing)
-
-
Which regions are analyzed in the report?
-
APAC, North America, Europe, Middle East and Africa, and South America
-
-
What are the key growth drivers and market challenges?
-
Increasing consumption of chickpeas as a snacking item, Uncertainty in rainfall affecting the chickpea crop production
-
-
Who are the major players in the Chickpea Market?
-
ABBOTT BLACKSTONE Co. Inc., AdasCan Grain Corp., AGT Food and Ingredients Inc., Anu Foods, Ardent Mills LLC, ATC Group India, Bean Growers Australia Ltd., Cono Trading International AG, DHAVAL AGRI EXPORT LLP, GEEWIN EXIM, Hippeas Inc., Nature Bio Foods Ltd., Nature Pulse Botanicals Pvt. Ltd., Organic Products India, Popular Pulse Products Pvt. Ltd., Shri Mahavir Group, Shubhlaxmi Industries, SunOpta Inc., VAD Industries Pvt. Ltd., and Woods Holding Group Pty. Ltd.
-
We can help! Our analysts can customize this chickpea market research report to meet your requirements.
 RIA -
RIA - 
