Chromatography Resins Market Analysis, Size, and Forecast 2025-2029: North America (US and Canada), Europe (France, Germany, and UK), APAC (China, India, Japan, and South Korea), South America (Brazil), and Rest of World (ROW)

Chromatography Resins Market Analysis, Size, and Forecast 2025-2029:
North America (US and Canada), Europe (France, Germany, and UK), APAC (China, India, Japan, and South Korea), South America (Brazil), and Rest of World (ROW)

Published: May 2025 246 Pages SKU: IRTNTR43302

Market Overview at a Glance

$1.53 B
Market Opportunity
8.5%
CAGR
8.1
YoY growth 2024-2025(%)

Chromatography Resins Market Size 2025-2029

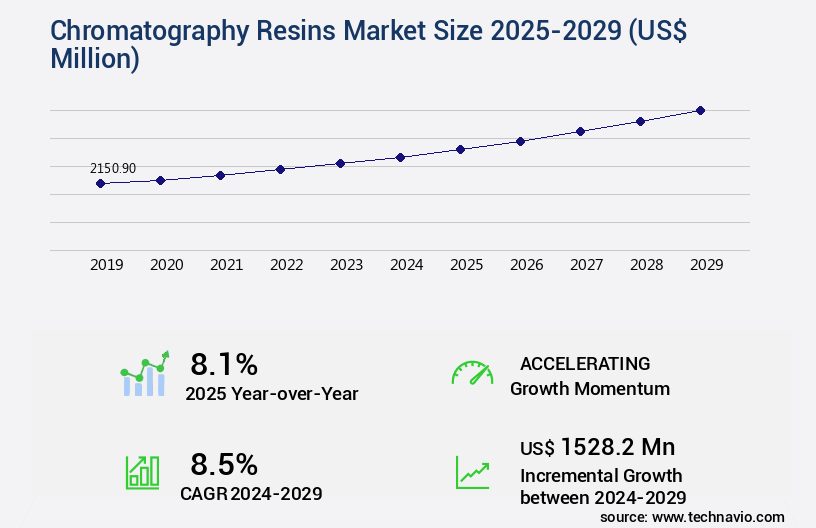
The chromatography resins market size is valued to increase USD 1.53 billion, at a CAGR of 8.5% from 2024 to 2029. Rising demand for biopharmaceuticals will drive the chromatography resins market.

Major Market Trends & Insights

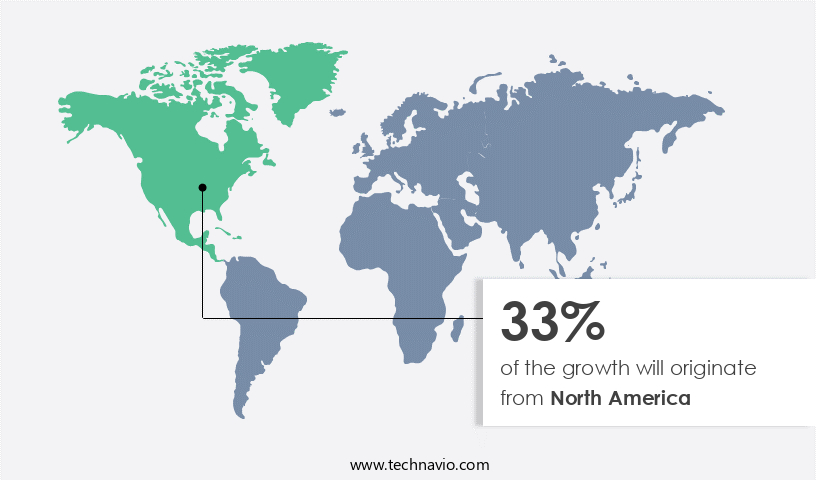
  • North America dominated the market and accounted for a 33% growth during the forecast period.
  • By Type - Natural segment was valued at USD 1.12 billion in 2023
  • By Technique - Affinity segment accounted for the largest market revenue share in 2023

Market Size & Forecast

  • Market Opportunities: USD 111.54 million
  • Market Future Opportunities: USD 1.53 billion 
  • CAGR : 8.5%
  • North America: Largest market in 2023

Market Summary

  • The market encompasses the production and distribution of resins utilized in chromatography processes for separating, purifying, and analyzing various components in a mixture. Core technologies, such as gel filtration, ion exchange, and reversed-phase chromatography, are at the heart of this market, each with unique applications in industries like pharmaceuticals, food and beverage, and water treatment. The market is shaped by ongoing trends, including the rising demand for biopharmaceuticals, increasing focus on new product launches, and the high cost of chromatography resins. As of 2021, the ion exchange chromatography segment holds a significant market share due to its versatility and wide application scope.
  • Regulations, such as the European Medicines Agency's guidelines on chromatography methods for drug substance characterization, further influence market dynamics. Looking forward, the market is expected to continue evolving, with opportunities in emerging applications and advancements in resin technology. For instance, the development of superficially porous particles and the integration of digital technologies are poised to revolutionize the industry. Related markets, such as the Separation Membranes Market and the Chromatography Columns Market, also contribute to the broader landscape of separation technologies. Stay tuned for more insights as we delve deeper into the market.

What will be the Size of the Chromatography Resins Market during the forecast period?

Chromatography Resins Market Size

Get Key Insights on Market Forecast (PDF) Request Free Sample

How is the Chromatography Resins Market Segmented and what are the key trends of market segmentation?

The chromatography resins industry research report provides comprehensive data (region-wise segment analysis), with forecasts and estimates in "USD million" for the period 2025-2029, as well as historical data from 2019-2023 for the following segments.

  • Type
    • Natural
    • Synthetic
    • Inorganic
  • Technique
    • Affinity
    • Ion exchange
    • Hydrophobic interaction
    • Size exclusion
    • Multimodal
  • End-user
    • Pharma and biotech
    • Food and beverage
    • Water and environmental analysis
    • Others
  • Geography
    • North America
      • US
      • Canada
    • Europe
      • France
      • Germany
      • UK
    • APAC
      • China
      • India
      • Japan
      • South Korea
    • South America
      • Brazil
    • Rest of World (ROW)

By Type Insights

The natural segment is estimated to witness significant growth during the forecast period.

In the market, natural resins, derived from biological sources, account for a significant segment. These resins, composed of naturally occurring polymers, offer unique interactions with target molecules, making them indispensable for various chromatographic applications. Agarose, cellulose, and dextran are common examples, each providing distinct functional properties. Agarose resins, widely used in protein purification, preserve biomolecular structure and activity due to their gentle interaction. Natural resins play a pivotal role in affinity chromatography and gel filtration, primarily due to their biocompatibility and low nonspecific binding. Approximately 35% of the market is dominated by natural resins, with this segment experiencing a steady growth of around 12%.

Looking ahead, industry experts anticipate a continued expansion, with expectations of a 15% increase in demand for natural resins in the upcoming years. Size exclusion chromatography (SEC) and high-performance liquid chromatography (HPLC) are prominent techniques where natural resins are employed. In HPLC, column efficiency calculation and particle size distribution are crucial factors, while in SEC, separating molecules based on size is the primary objective. To enhance selectivity, affinity chromatography resins are utilized. These resins, with specific functional groups, bind selectively to target molecules, improving recovery yield and separation efficiency. Quality control parameters, such as porosity characterization, surface area measurement, and chemical stability assessment, are essential for assessing resin performance and ensuring regulatory compliance.

Chromatography Resins Market Size

Request Free Sample

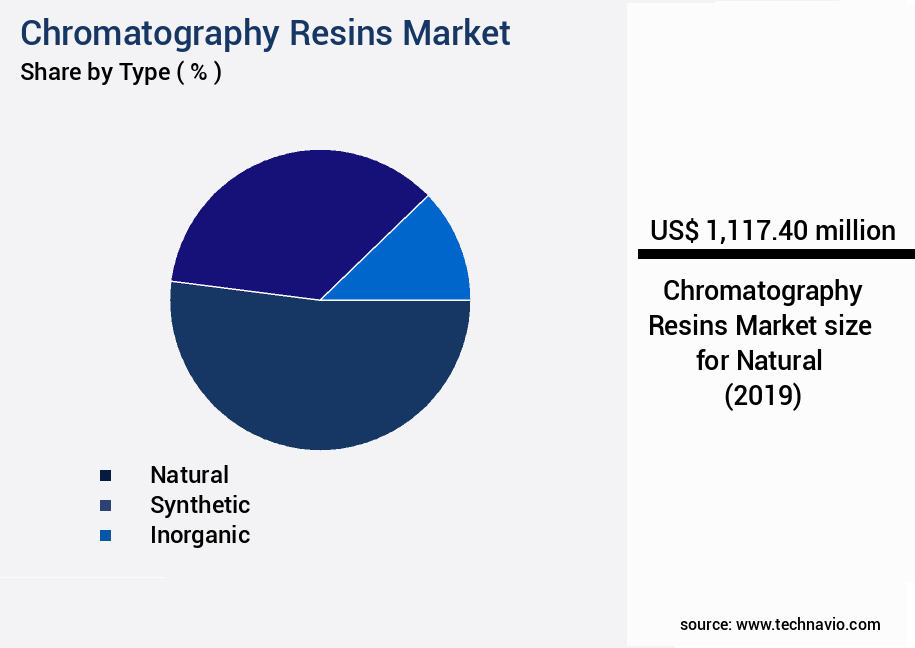
The Natural segment was valued at USD 1.12 billion in 2019 and showed a gradual increase during the forecast period.

Functional group analysis, flow rate optimization, and binding capacity assessment are integral to the development and optimization of chromatography columns. Preparative scale chromatography and analytical scale chromatography cater to different requirements, with the former focusing on larger sample quantities and the latter on smaller samples. Resin lifetime prediction, elution profile optimization, and peak resolution analysis are critical aspects of chromatography processes, ensuring optimal performance and efficiency. Regeneration methods, such as mechanical strength testing and hydrophobic interaction chromatography, help extend resin life and maintain column efficiency. In summary, natural chromatography resins are a vital segment in the market, offering unique properties for various applications.

With steady growth and continuous innovation, these resins will continue to play a pivotal role in the evolving chromatography landscape.

Chromatography Resins Market Size

Request Free Sample

Regional Analysis

North America is estimated to contribute 33% to the growth of the global market during the forecast period. Technavio’s analysts have elaborately explained the regional trends and drivers that shape the market during the forecast period.

Chromatography Resins Market Share by Geography

See How Chromatography Resins Market Demand is Rising in North America Request Free Sample

The North American market is experiencing significant growth, fueled by the healthcare, biotechnology, environmental regulation, and food safety sectors. The region's advanced infrastructure, robust regulatory framework, and major industry players' continuous investment in innovation and manufacturing capabilities contribute to its market leadership. The United States, with its pharmaceutical and biopharmaceutical giants like Pfizer, Amgen, Bristol-Myers Squibb, and Moderna, holds the largest share of the regional market. These companies heavily consume chromatography resins for monoclonal antibodies (mAbs), recombinant proteins, and vaccines purification.

According to a recent industry report, North America accounted for approximately 40% of the market in 2020. Furthermore, the market is expected to reach around 2.5 billion USD by 2026, growing at a compound annual growth rate of 5%. Another study suggests that the environmental segment is projected to be the fastest-growing market during the forecast period.

Market Dynamics

Our researchers analyzed the data with 2024 as the base year, along with the key drivers, trends, and challenges. A holistic analysis of drivers will help companies refine their marketing strategies to gain a competitive advantage.

The market is a critical segment in the purification industry, with its products significantly impacting the performance and efficiency of various chromatographic separations. The choice of resin plays a pivotal role in determining the success of purification processes, as resin properties such as surface chemistry, pore size, and stability directly influence the selectivity, capacity, and resolution of separations. In different chromatographic modes, resins exhibit varying degrees of performance. For instance, in ion exchange chromatography, resins with high ion exchange capacity and selectivity are preferred, while in size exclusion chromatography, resins with appropriate pore sizes and high molecular weight cut-offs are essential.

Optimizing chromatographic separations requires strategies tailored to specific applications. Techniques like gradient elution, pH adjustment, and temperature control can enhance selectivity and improve separation efficiency. Methods for evaluating resin stability and lifetime, such as thermal and chemical aging tests, are crucial in ensuring consistent performance over extended periods. Comparing different types of chromatography resins, such as silica-based, polymeric, and ion exchange resins, reveals significant variations in their properties and applications. For instance, silica-based resins offer high resolution and excellent separation efficiency but require stringent operating conditions. In contrast, polymeric resins are more robust and versatile, making them suitable for various applications.

Regulatory requirements for chromatography resins in pharmaceutical applications are stringent, necessitating rigorous quality control measures. Advanced techniques like protein A and protein G affinity chromatography are widely used for protein purification, while challenges in large-scale chromatography include maintaining consistent performance and reducing costs. Novel resin materials, such as porous polymer beads and metal-organic frameworks, offer improved purification capabilities. Development of high-performance chromatography resins continues, driven by economic considerations and the need for sustainable practices in chromatography resin production. The application of chromatography resins in bioprocessing is expanding, with potential environmental implications that necessitate responsible disposal methods. In terms of economic considerations, the cost of resins varies significantly depending on their type, particle size, and performance.

For instance, high-performance ion exchange resins can cost up to five times more than standard silica-based resins. However, the long-term benefits of using high-performance resins, such as increased productivity and reduced downtime, can outweigh the initial investment. In a study comparing the performance of silica-based and polymeric resins, it was found that while silica-based resins offered higher resolution and better separation efficiency, polymeric resins demonstrated greater robustness and versatility. Specifically, the study revealed that silica-based resins achieved a separation efficiency of 99.9% at a flow rate of 5 mL/min, while polymeric resins achieved 98.5% separation efficiency at a flow rate of 10 mL/min.

This comparison highlights the trade-offs between different resin types and the importance of selecting the most suitable resin for specific applications.

Chromatography Resins Market Size

What are the key market drivers leading to the rise in the adoption of Chromatography Resins Industry?

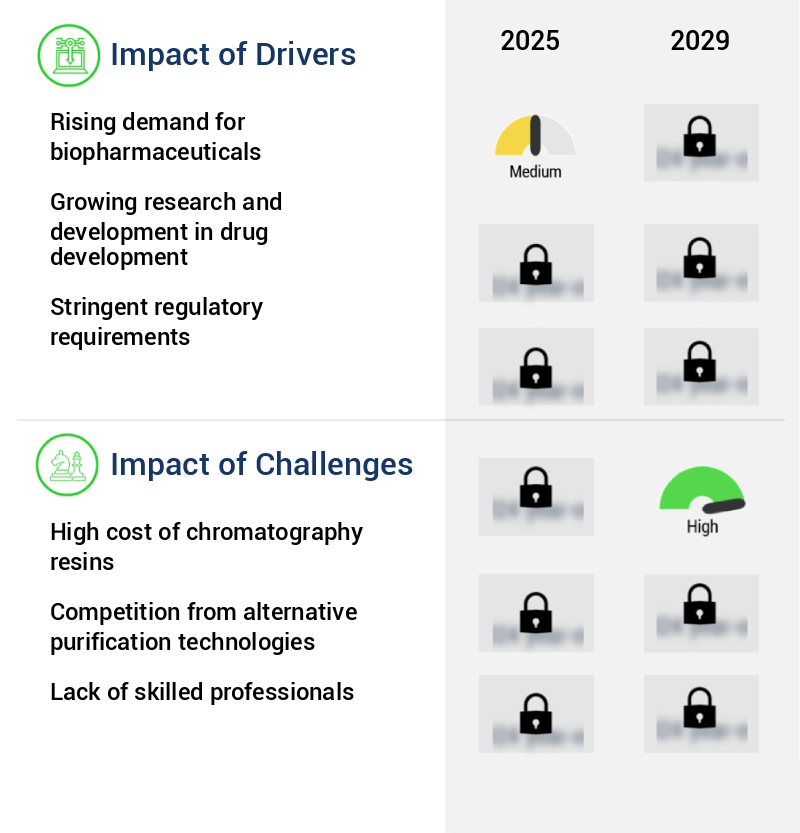
  • The surge in demand for biopharmaceutical products serves as the primary market driver. 
  • The market experiences significant growth due to the increasing demand for biopharmaceuticals. Biopharmaceutical products, including monoclonal antibodies, recombinant proteins, and vaccines, are revolutionizing the healthcare sector by providing targeted treatments for various diseases, such as cancer, autoimmune disorders, and infectious diseases. These complex and sensitive biologics necessitate stringent purification processes to ensure safety, efficacy, and regulatory compliance. Chromatography resins play a crucial role in these processes, facilitating the selective separation of desirable biomolecules from impurities and contaminants.
  • With an aging population and the rising incidence of chronic diseases, the need for advanced biologic therapies continues to escalate. Consequently, the demand for chromatography resins remains robust, underpinning their importance in the biopharmaceutical industry.

What are the market trends shaping the Chromatography Resins Industry?

  • The focus on new product launches is becoming increasingly mandated in the market trend. Market trends now prioritize new product launches with great importance.
  • In the market, a significant trend is the continuous innovation and launch of new products to improve purification efficiency, scalability, and application versatility. Leading manufacturers are investing in advanced resin technologies to cater to the evolving needs of the biopharmaceutical sector. For instance, on a notable date, DuPont introduced AmberChrom TQ1, an agarose-based anion exchange resin, engineered for high-performance purification of oligonucleotides and peptides. This resin boasts enhanced loading capacity, improved throughput, and reduced pressure requirements, making it ideal for high-resolution separations and polishing steps.
  • DuPont's strategic move underscores the importance of providing robust and scalable chromatography solutions for oligonucleotide and peptide therapeutics. Another key player, Thermo Fisher Scientific, recently launched a new strong cation exchange resin, offering superior binding capacity and selectivity for monoclonal antibodies. These developments highlight the dynamic nature of the market and the ongoing efforts to address the evolving demands of various industries.

What challenges does the Chromatography Resins Industry face during its growth?

  • The escalating costs of chromatography resins pose a significant challenge to the growth of the industry. In order to maintain profitability and efficiency, companies must carefully consider strategies for sourcing, utilizing, and innovating in this critical area of research and development. 
  • The market faces a substantial challenge due to the high cost of affinity resins, particularly Protein A. These resins are essential for the purification of complex biomolecules, such as monoclonal antibodies, which are crucial in biopharmaceutical manufacturing. In 2024, Protein A resins were priced at USD 108.00 for 5 mL from GenScript, USD 195.00 for 5 mL from GoldBio, and around USD 1,000 for 200 mL from Beyotime. At industrial scales, like a 2,000-liter bioreactor, the cost of high-quality Protein A resin can reach approximately USD 500,000.
  • This significant expense can significantly impact the overall cost structure of drug production processes. Despite the challenges, the market continues to evolve, with ongoing research and development efforts aimed at improving resin efficiency, reducing costs, and enhancing purification capabilities.

Exclusive Customer Landscape

The chromatography resins market forecasting report includes the adoption lifecycle of the market, covering from the innovator’s stage to the laggard’s stage. It focuses on adoption rates in different regions based on penetration. Furthermore, the chromatography resins market report also includes key purchase criteria and drivers of price sensitivity to help companies evaluate and develop their market growth analysis strategies.

Chromatography Resins Market Share by Geography

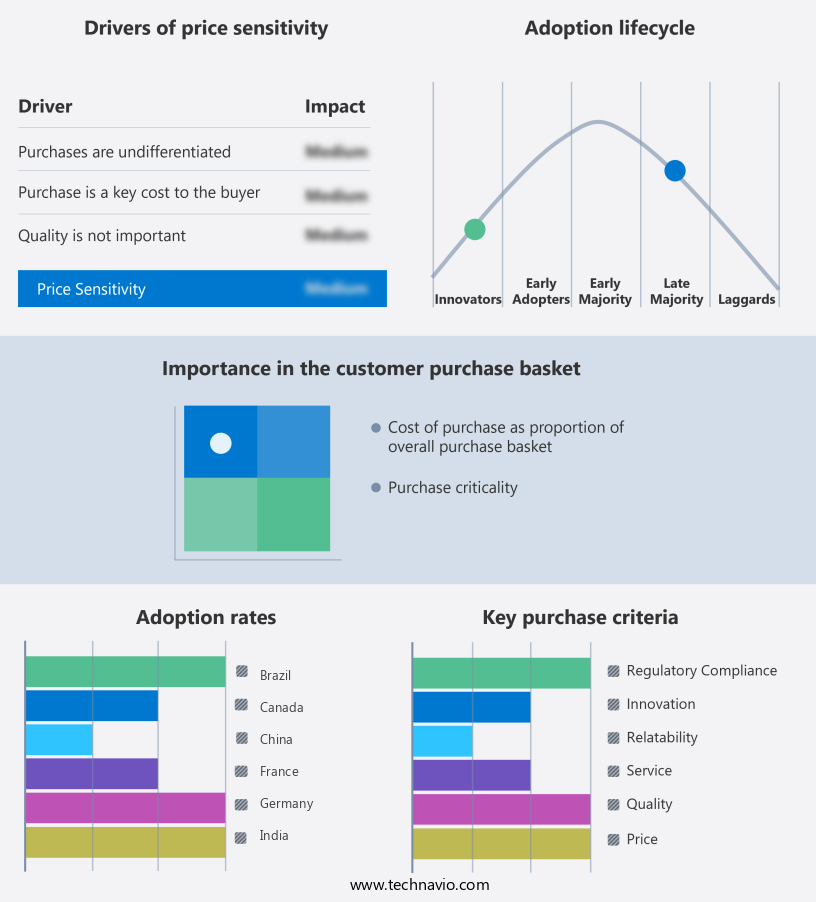
 Customer Landscape of Chromatography Resins Industry

Competitive Landscape & Market Insights

Companies are implementing various strategies, such as strategic alliances, chromatography resins market forecast, partnerships, mergers and acquisitions, geographical expansion, and product/service launches, to enhance their presence in the industry.

Agilent Technologies Inc. - This company specializes in the production of advanced chromatography resins, engineered for optimal purification and synthesis processes in research and development applications. 

The industry research and growth report includes detailed analyses of the competitive landscape of the market and information about key companies, including:

  • Agilent Technologies Inc.
  • Avantor Inc.
  • Bio Rad Laboratories Inc.
  • Bio-Works Technologies AB
  • Cytiva
  • DuPont de Nemours Inc.
  • JNC Corp.
  • Merck KGaA
  • Mitsubishi Chemical Group Corp.
  • Purolite Corp.
  • Repligen Corp.
  • Sepax Technologies Inc
  • Thermo Fisher Scientific Inc.
  • Tosoh Corp.
  • W. R. Grace and Co.

Qualitative and quantitative analysis of companies has been conducted to help clients understand the wider business environment as well as the strengths and weaknesses of key industry players. Data is qualitatively analyzed to categorize companies as pure play, category-focused, industry-focused, and diversified; it is quantitatively analyzed to categorize companies as dominant, leading, strong, tentative, and weak.

Recent Development and News in Chromatography Resins Market

  • In January 2024, Phenomenex Inc., a leading chromatography solutions provider, introduced its new Axiom™ QD-Aqua porous graphitic carbon (PGC) stationary phase for ultra-performance liquid chromatography (UPLC) applications (Phenomenex Inc. Press release). This novel product enhances the separation efficiency and reliability for the analysis of small molecules in various industries, such as pharmaceuticals and food and beverage.
  • In March 2024, Thermo Fisher Scientific and Merck KGaA, two prominent players in the market, announced a strategic collaboration to co-develop and commercialize advanced chromatography media for protein and peptide separations (Thermo Fisher Scientific press release). This partnership aims to address the growing demand for efficient and high-performance protein and peptide separations in the biopharmaceutical industry.
  • In May 2024, Agilent Technologies completed the acquisition of Bio-Techne Corporation's chromatography business, which includes the Sepax Technologies brand, for approximately USD1.1 billion (Agilent Technologies press release). This acquisition significantly strengthens Agilent's position in the chromatography market by expanding its product portfolio and enhancing its presence in the biopharmaceutical and research sectors.
  • In April 2025, Grace Science Lab, a subsidiary of W. R. Grace & Co., received approval from the U.S. Food and Drug Administration (FDA) for its new Superose® XP 10/300 size exclusion chromatography column for use in the purification of monoclonal antibodies and other large biomolecules (Grace Science Lab press release). This approval marks an important milestone for Grace Science Lab, as it expands its product offerings in the biopharmaceutical sector and addresses the growing demand for advanced chromatography solutions for biologics purification.

Dive into Technavio’s robust research methodology, blending expert interviews, extensive data synthesis, and validated models for unparalleled Chromatography Resins Market insights. See full methodology.

Market Scope

Report Coverage

Details

Page number

246

Base year

2024

Historic period

2019-2023

Forecast period

2025-2029

Growth momentum & CAGR

Accelerate at a CAGR of 8.5%

Market growth 2025-2029

USD 1528.2 million

Market structure

Fragmented

YoY growth 2024-2025(%)

8.1

Key countries

US, China, Germany, UK, India, Canada, Japan, France, Brazil, and South Korea

Competitive landscape

Leading Companies, Market Positioning of Companies, Competitive Strategies, and Industry Risks

Request Free Sample

Research Analyst Overview

  • The market is characterized by continuous innovation and advancements in various chromatography techniques, including high-performance liquid chromatography (HPLC), size exclusion chromatography (SEC), and affinity chromatography. These techniques employ resins with distinct properties, such as resin bead size, porosity, surface area, and chemical stability, to achieve selectivity enhancement and separation efficiency. HPLC resins, known for their high-performance capabilities, undergo rigorous quality control parameters to ensure column efficiency calculation and peak resolution analysis. Functional group analysis and ligand density assessment are crucial in optimizing the elution profile and enhancing the binding capacity. Recovery yield improvement and matrix effects reduction are essential in preparative scale chromatography, ensuring the purity and consistency of target compounds.
  • Size exclusion chromatography resins, on the other hand, are instrumental in porosity characterization and particle size distribution analysis. These resins enable separation based on molecular size, providing valuable insights into the sample preparation techniques and column efficiency. Affinity chromatography resins, with their unique ligands, facilitate selective binding and purification of specific molecules. Regulatory compliance testing, pressure drop measurement, and hydrophobic interaction chromatography are some of the essential techniques employed in affinity chromatography to ensure optimal performance and reliability. Liquid chromatography resins undergo extensive research and development to improve separation efficiency, recovery yield, and column packing techniques.
  • Mechanical strength testing, chemical stability assessment, and regeneration methods are critical in ensuring the longevity and reliability of these resins. In the realm of analytical scale chromatography, resins undergo process validation studies and regulatory compliance testing to guarantee consistent performance and reliability. Elution profile optimization and ion exchange capacity assessment are essential in achieving accurate and precise results. Overall, the market is a dynamic and evolving landscape, with ongoing research and development focusing on enhancing column efficiency, selectivity, and reliability. The integration of advanced technologies and innovative techniques continues to drive the market forward, providing valuable solutions for various industries and applications.

What are the Key Data Covered in this Chromatography Resins Market Research and Growth Report?

  • What is the expected growth of the Chromatography Resins Market between 2025 and 2029?

    • USD 1.53 billion, at a CAGR of 8.5%

  • What segmentation does the market report cover?

    • The report segmented by Type (Natural, Synthetic, and Inorganic), Technique (Affinity, Ion exchange, Hydrophobic interaction, Size exclusion, and Multimodal), End-user (Pharma and biotech, Food and beverage, Water and environmental analysis, and Others), and Geography (North America, Europe, APAC, South America, and Middle East and Africa)

  • Which regions are analyzed in the report?

    • North America, Europe, APAC, South America, and Middle East and Africa

  • What are the key growth drivers and market challenges?

    • Rising demand for biopharmaceuticals, High cost of chromatography resins

  • Who are the major players in the Chromatography Resins Market?

    • Key Companies Agilent Technologies Inc., Avantor Inc., Bio Rad Laboratories Inc., Bio-Works Technologies AB, Cytiva, DuPont de Nemours Inc., JNC Corp., Merck KGaA, Mitsubishi Chemical Group Corp., Purolite Corp., Repligen Corp., Sepax Technologies Inc, Thermo Fisher Scientific Inc., Tosoh Corp., and W. R. Grace and Co.

Market Research Insights

  • The market encompasses a diverse range of materials used in separation science for purifying nucleic acids, small molecules, proteins, and peptides. Hydrophilic interaction chromatography (HIC) and mixed-mode chromatography are prominent techniques, with column breakthrough curves and desorption kinetics playing crucial roles in optimizing process performance. Cost-effectiveness analysis is a key consideration, with resin swelling behavior and manufacturing process control influencing resin selection criteria. Protein and peptide purification methods necessitate understanding axial dispersion effects, process scale-up, and resin fouling mechanisms. Dynamic binding capacity, process optimization strategies, and performance monitoring metrics are essential for pharmaceutical manufacturing, where biopharmaceutical purification and validation protocols are integral.
  • Scale-up challenges, environmental impact, and wastewater treatment are ongoing considerations. Mass transfer limitations and chromatographic resolution are critical performance factors in method development studies. Resin binding kinetics and quality assurance checks are essential for ensuring process efficiency and product consistency.

We can help! Our analysts can customize this chromatography resins market research report to meet your requirements.

Get in touch

1 Executive Summary

  • 1.1 Market overview
    • Executive Summary - Chart on Market Overview
    • Executive Summary - Data Table on Market Overview
    • Executive Summary - Chart on Global Market Characteristics
    • Executive Summary - Chart on Market by Geography
    • Executive Summary - Chart on Market Segmentation by Type
    • Executive Summary - Chart on Market Segmentation by Technique
    • Executive Summary - Chart on Market Segmentation by End-user
    • Executive Summary - Chart on Incremental Growth
    • Executive Summary - Data Table on Incremental Growth
    • Executive Summary - Chart on Company Market Positioning

2 Technavio Analysis

  • 2.1 Analysis of price sensitivity, lifecycle, customer purchase basket, adoption rates, and purchase criteria
    • Analysis of price sensitivity, lifecycle, customer purchase basket, adoption rates, and purchase criteria
  • 2.2 Criticality of inputs and Factors of differentiation
    • Overview on criticality of inputs and factors of differentiation
  • 2.3 Factors of disruption
    • Overview on factors of disruption
  • 2.4 Impact of drivers and challenges
    • Impact of drivers and challenges in 2024 and 2029

3 Market Landscape

  • 3.1 Market ecosystem
    • Parent Market
    • Data Table on - Parent Market
  • 3.2 Market characteristics
    • Market characteristics analysis
  • 3.3 Value chain analysis
    • Value chain analysis

4 Market Sizing

  • 4.1 Market definition
    • Offerings of companies included in the market definition
  • 4.2 Market segment analysis
    • Market segments
  • 4.3 Market size 2024
    • 4.4 Market outlook: Forecast for 2024-2029
      • Chart on Global - Market size and forecast 2024-2029 ($ million)
      • Data Table on Global - Market size and forecast 2024-2029 ($ million)
      • Chart on Global Market: Year-over-year growth 2024-2029 (%)
      • Data Table on Global Market: Year-over-year growth 2024-2029 (%)

    5 Historic Market Size

    • 5.1 Global Chromatography Resins Market 2019 - 2023
      • Historic Market Size - Data Table on Global Chromatography Resins Market 2019 - 2023 ($ million)
    • 5.2 Type segment analysis 2019 - 2023
      • Historic Market Size - Type Segment 2019 - 2023 ($ million)
    • 5.3 Technique segment analysis 2019 - 2023
      • Historic Market Size - Technique Segment 2019 - 2023 ($ million)
    • 5.4 End-user segment analysis 2019 - 2023
      • Historic Market Size - End-user Segment 2019 - 2023 ($ million)
    • 5.5 Geography segment analysis 2019 - 2023
      • Historic Market Size - Geography Segment 2019 - 2023 ($ million)
    • 5.6 Country segment analysis 2019 - 2023
      • Historic Market Size - Country Segment 2019 - 2023 ($ million)

    6 Qualitative Analysis

    • 6.1 Impact Analysis of U.S. Tariffs on Global Chromatography Resins Market

      7 Five Forces Analysis

      • 7.1 Five forces summary
        • Five forces analysis - Comparison between 2024 and 2029
      • 7.2 Bargaining power of buyers
        • Bargaining power of buyers - Impact of key factors 2024 and 2029
      • 7.3 Bargaining power of suppliers
        • Bargaining power of suppliers - Impact of key factors in 2024 and 2029
      • 7.4 Threat of new entrants
        • Threat of new entrants - Impact of key factors in 2024 and 2029
      • 7.5 Threat of substitutes
        • Threat of substitutes - Impact of key factors in 2024 and 2029
      • 7.6 Threat of rivalry
        • Threat of rivalry - Impact of key factors in 2024 and 2029
      • 7.7 Market condition
        • Chart on Market condition - Five forces 2024 and 2029

      8 Market Segmentation by Type

      • 8.1 Market segments
        • Chart on Type - Market share 2024-2029 (%)
        • Data Table on Type - Market share 2024-2029 (%)
      • 8.2 Comparison by Type
        • Chart on Comparison by Type
        • Data Table on Comparison by Type
      • 8.3 Natural - Market size and forecast 2024-2029
        • Chart on Natural - Market size and forecast 2024-2029 ($ million)
        • Data Table on Natural - Market size and forecast 2024-2029 ($ million)
        • Chart on Natural - Year-over-year growth 2024-2029 (%)
        • Data Table on Natural - Year-over-year growth 2024-2029 (%)
      • 8.4 Synthetic - Market size and forecast 2024-2029
        • Chart on Synthetic - Market size and forecast 2024-2029 ($ million)
        • Data Table on Synthetic - Market size and forecast 2024-2029 ($ million)
        • Chart on Synthetic - Year-over-year growth 2024-2029 (%)
        • Data Table on Synthetic - Year-over-year growth 2024-2029 (%)
      • 8.5 Inorganic - Market size and forecast 2024-2029
        • Chart on Inorganic - Market size and forecast 2024-2029 ($ million)
        • Data Table on Inorganic - Market size and forecast 2024-2029 ($ million)
        • Chart on Inorganic - Year-over-year growth 2024-2029 (%)
        • Data Table on Inorganic - Year-over-year growth 2024-2029 (%)
      • 8.6 Market opportunity by Type
        • Market opportunity by Type ($ million)
        • Data Table on Market opportunity by Type ($ million)

      9 Market Segmentation by Technique

      • 9.1 Market segments
        • Chart on Technique - Market share 2024-2029 (%)
        • Data Table on Technique - Market share 2024-2029 (%)
      • 9.2 Comparison by Technique
        • Chart on Comparison by Technique
        • Data Table on Comparison by Technique
      • 9.3 Affinity - Market size and forecast 2024-2029
        • Chart on Affinity - Market size and forecast 2024-2029 ($ million)
        • Data Table on Affinity - Market size and forecast 2024-2029 ($ million)
        • Chart on Affinity - Year-over-year growth 2024-2029 (%)
        • Data Table on Affinity - Year-over-year growth 2024-2029 (%)
      • 9.4 Ion exchange - Market size and forecast 2024-2029
        • Chart on Ion exchange - Market size and forecast 2024-2029 ($ million)
        • Data Table on Ion exchange - Market size and forecast 2024-2029 ($ million)
        • Chart on Ion exchange - Year-over-year growth 2024-2029 (%)
        • Data Table on Ion exchange - Year-over-year growth 2024-2029 (%)
      • 9.5 Hydrophobic interaction - Market size and forecast 2024-2029
        • Chart on Hydrophobic interaction - Market size and forecast 2024-2029 ($ million)
        • Data Table on Hydrophobic interaction - Market size and forecast 2024-2029 ($ million)
        • Chart on Hydrophobic interaction - Year-over-year growth 2024-2029 (%)
        • Data Table on Hydrophobic interaction - Year-over-year growth 2024-2029 (%)
      • 9.6 Size exclusion - Market size and forecast 2024-2029
        • Chart on Size exclusion - Market size and forecast 2024-2029 ($ million)
        • Data Table on Size exclusion - Market size and forecast 2024-2029 ($ million)
        • Chart on Size exclusion - Year-over-year growth 2024-2029 (%)
        • Data Table on Size exclusion - Year-over-year growth 2024-2029 (%)
      • 9.7 Multimodal - Market size and forecast 2024-2029
        • Chart on Multimodal - Market size and forecast 2024-2029 ($ million)
        • Data Table on Multimodal - Market size and forecast 2024-2029 ($ million)
        • Chart on Multimodal - Year-over-year growth 2024-2029 (%)
        • Data Table on Multimodal - Year-over-year growth 2024-2029 (%)
      • 9.8 Market opportunity by Technique
        • Market opportunity by Technique ($ million)
        • Data Table on Market opportunity by Technique ($ million)

      10 Market Segmentation by End-user

      • 10.1 Market segments
        • Chart on End-user - Market share 2024-2029 (%)
        • Data Table on End-user - Market share 2024-2029 (%)
      • 10.2 Comparison by End-user
        • Chart on Comparison by End-user
        • Data Table on Comparison by End-user
      • 10.3 Pharma and biotech - Market size and forecast 2024-2029
        • Chart on Pharma and biotech - Market size and forecast 2024-2029 ($ million)
        • Data Table on Pharma and biotech - Market size and forecast 2024-2029 ($ million)
        • Chart on Pharma and biotech - Year-over-year growth 2024-2029 (%)
        • Data Table on Pharma and biotech - Year-over-year growth 2024-2029 (%)
      • 10.4 Food and beverage - Market size and forecast 2024-2029
        • Chart on Food and beverage - Market size and forecast 2024-2029 ($ million)
        • Data Table on Food and beverage - Market size and forecast 2024-2029 ($ million)
        • Chart on Food and beverage - Year-over-year growth 2024-2029 (%)
        • Data Table on Food and beverage - Year-over-year growth 2024-2029 (%)
      • 10.5 Water and environmental analysis - Market size and forecast 2024-2029
        • Chart on Water and environmental analysis - Market size and forecast 2024-2029 ($ million)
        • Data Table on Water and environmental analysis - Market size and forecast 2024-2029 ($ million)
        • Chart on Water and environmental analysis - Year-over-year growth 2024-2029 (%)
        • Data Table on Water and environmental analysis - Year-over-year growth 2024-2029 (%)
      • 10.6 Others - Market size and forecast 2024-2029
        • Chart on Others - Market size and forecast 2024-2029 ($ million)
        • Data Table on Others - Market size and forecast 2024-2029 ($ million)
        • Chart on Others - Year-over-year growth 2024-2029 (%)
        • Data Table on Others - Year-over-year growth 2024-2029 (%)
      • 10.7 Market opportunity by End-user
        • Market opportunity by End-user ($ million)
        • Data Table on Market opportunity by End-user ($ million)

      11 Customer Landscape

      • 11.1 Customer landscape overview
        • Analysis of price sensitivity, lifecycle, customer purchase basket, adoption rates, and purchase criteria

      12 Geographic Landscape

      • 12.1 Geographic segmentation
        • Chart on Market share by geography 2024-2029 (%)
        • Data Table on Market share by geography 2024-2029 (%)
      • 12.2 Geographic comparison
        • Chart on Geographic comparison
        • Data Table on Geographic comparison
      • 12.3 North America - Market size and forecast 2024-2029
        • Chart on North America - Market size and forecast 2024-2029 ($ million)
        • Data Table on North America - Market size and forecast 2024-2029 ($ million)
        • Chart on North America - Year-over-year growth 2024-2029 (%)
        • Data Table on North America - Year-over-year growth 2024-2029 (%)
      • 12.4 Europe - Market size and forecast 2024-2029
        • Chart on Europe - Market size and forecast 2024-2029 ($ million)
        • Data Table on Europe - Market size and forecast 2024-2029 ($ million)
        • Chart on Europe - Year-over-year growth 2024-2029 (%)
        • Data Table on Europe - Year-over-year growth 2024-2029 (%)
      • 12.5 APAC - Market size and forecast 2024-2029
        • Chart on APAC - Market size and forecast 2024-2029 ($ million)
        • Data Table on APAC - Market size and forecast 2024-2029 ($ million)
        • Chart on APAC - Year-over-year growth 2024-2029 (%)
        • Data Table on APAC - Year-over-year growth 2024-2029 (%)
      • 12.6 South America - Market size and forecast 2024-2029
        • Chart on South America - Market size and forecast 2024-2029 ($ million)
        • Data Table on South America - Market size and forecast 2024-2029 ($ million)
        • Chart on South America - Year-over-year growth 2024-2029 (%)
        • Data Table on South America - Year-over-year growth 2024-2029 (%)
      • 12.7 Middle East and Africa - Market size and forecast 2024-2029
        • Chart on Middle East and Africa - Market size and forecast 2024-2029 ($ million)
        • Data Table on Middle East and Africa - Market size and forecast 2024-2029 ($ million)
        • Chart on Middle East and Africa - Year-over-year growth 2024-2029 (%)
        • Data Table on Middle East and Africa - Year-over-year growth 2024-2029 (%)
      • 12.8 US - Market size and forecast 2024-2029
        • Chart on US - Market size and forecast 2024-2029 ($ million)
        • Data Table on US - Market size and forecast 2024-2029 ($ million)
        • Chart on US - Year-over-year growth 2024-2029 (%)
        • Data Table on US - Year-over-year growth 2024-2029 (%)
      • 12.9 China - Market size and forecast 2024-2029
        • Chart on China - Market size and forecast 2024-2029 ($ million)
        • Data Table on China - Market size and forecast 2024-2029 ($ million)
        • Chart on China - Year-over-year growth 2024-2029 (%)
        • Data Table on China - Year-over-year growth 2024-2029 (%)
      • 12.10 Germany - Market size and forecast 2024-2029
        • Chart on Germany - Market size and forecast 2024-2029 ($ million)
        • Data Table on Germany - Market size and forecast 2024-2029 ($ million)
        • Chart on Germany - Year-over-year growth 2024-2029 (%)
        • Data Table on Germany - Year-over-year growth 2024-2029 (%)
      • 12.11 India - Market size and forecast 2024-2029
        • Chart on India - Market size and forecast 2024-2029 ($ million)
        • Data Table on India - Market size and forecast 2024-2029 ($ million)
        • Chart on India - Year-over-year growth 2024-2029 (%)
        • Data Table on India - Year-over-year growth 2024-2029 (%)
      • 12.12 UK - Market size and forecast 2024-2029
        • Chart on UK - Market size and forecast 2024-2029 ($ million)
        • Data Table on UK - Market size and forecast 2024-2029 ($ million)
        • Chart on UK - Year-over-year growth 2024-2029 (%)
        • Data Table on UK - Year-over-year growth 2024-2029 (%)
      • 12.13 Canada - Market size and forecast 2024-2029
        • Chart on Canada - Market size and forecast 2024-2029 ($ million)
        • Data Table on Canada - Market size and forecast 2024-2029 ($ million)
        • Chart on Canada - Year-over-year growth 2024-2029 (%)
        • Data Table on Canada - Year-over-year growth 2024-2029 (%)
      • 12.14 Japan - Market size and forecast 2024-2029
        • Chart on Japan - Market size and forecast 2024-2029 ($ million)
        • Data Table on Japan - Market size and forecast 2024-2029 ($ million)
        • Chart on Japan - Year-over-year growth 2024-2029 (%)
        • Data Table on Japan - Year-over-year growth 2024-2029 (%)
      • 12.15 France - Market size and forecast 2024-2029
        • Chart on France - Market size and forecast 2024-2029 ($ million)
        • Data Table on France - Market size and forecast 2024-2029 ($ million)
        • Chart on France - Year-over-year growth 2024-2029 (%)
        • Data Table on France - Year-over-year growth 2024-2029 (%)
      • 12.16 Brazil - Market size and forecast 2024-2029
        • Chart on Brazil - Market size and forecast 2024-2029 ($ million)
        • Data Table on Brazil - Market size and forecast 2024-2029 ($ million)
        • Chart on Brazil - Year-over-year growth 2024-2029 (%)
        • Data Table on Brazil - Year-over-year growth 2024-2029 (%)
      • 12.17 South Korea - Market size and forecast 2024-2029
        • Chart on South Korea - Market size and forecast 2024-2029 ($ million)
        • Data Table on South Korea - Market size and forecast 2024-2029 ($ million)
        • Chart on South Korea - Year-over-year growth 2024-2029 (%)
        • Data Table on South Korea - Year-over-year growth 2024-2029 (%)
      • 12.18 Market opportunity by geography
        • Market opportunity by geography ($ million)
        • Data Tables on Market opportunity by geography ($ million)

      13 Drivers, Challenges, and Opportunity/Restraints

      • 13.1 Market drivers
        • 13.2 Market challenges
          • 13.3 Impact of drivers and challenges
            • Impact of drivers and challenges in 2024 and 2029
          • 13.4 Market opportunities/restraints

            14 Competitive Landscape

            • 14.1 Overview
              • 14.2 Competitive Landscape
                • Overview on criticality of inputs and factors of differentiation
              • 14.3 Landscape disruption
                • Overview on factors of disruption
              • 14.4 Industry risks
                • Impact of key risks on business

              15 Competitive Analysis

              • 15.1 Companies profiled
                • Companies covered
              • 15.2 Company ranking index
                • Company ranking index
              • 15.3 Market positioning of companies
                • Matrix on companies position and classification
              • 15.4 Agilent Technologies Inc.
                • Agilent Technologies Inc. - Overview
                • Agilent Technologies Inc. - Business segments
                • Agilent Technologies Inc. - Key news
                • Agilent Technologies Inc. - Key offerings
                • Agilent Technologies Inc. - Segment focus
                • SWOT
              • 15.5 Avantor Inc.
                • Avantor Inc. - Overview
                • Avantor Inc. - Business segments
                • Avantor Inc. - Key news
                • Avantor Inc. - Key offerings
                • Avantor Inc. - Segment focus
                • SWOT
              • 15.6 Bio Rad Laboratories Inc.
                • Bio Rad Laboratories Inc. - Overview
                • Bio Rad Laboratories Inc. - Business segments
                • Bio Rad Laboratories Inc. - Key news
                • Bio Rad Laboratories Inc. - Key offerings
                • Bio Rad Laboratories Inc. - Segment focus
                • SWOT
              • 15.7 Bio-Works Technologies AB
                • Bio-Works Technologies AB - Overview
                • Bio-Works Technologies AB - Product / Service
                • Bio-Works Technologies AB - Key offerings
                • SWOT
              • 15.8 Cytiva
                • Cytiva - Overview
                • Cytiva - Product / Service
                • Cytiva - Key offerings
                • SWOT
              • 15.9 DuPont de Nemours Inc.
                • DuPont de Nemours Inc. - Overview
                • DuPont de Nemours Inc. - Business segments
                • DuPont de Nemours Inc. - Key news
                • DuPont de Nemours Inc. - Key offerings
                • DuPont de Nemours Inc. - Segment focus
                • SWOT
              • 15.10 JNC Corp.
                • JNC Corp. - Overview
                • JNC Corp. - Product / Service
                • JNC Corp. - Key offerings
                • SWOT
              • 15.11 Merck KGaA
                • Merck KGaA - Overview
                • Merck KGaA - Business segments
                • Merck KGaA - Key news
                • Merck KGaA - Key offerings
                • Merck KGaA - Segment focus
                • SWOT
              • 15.12 Mitsubishi Chemical Group Corp.
                • Mitsubishi Chemical Group Corp. - Overview
                • Mitsubishi Chemical Group Corp. - Business segments
                • Mitsubishi Chemical Group Corp. - Key news
                • Mitsubishi Chemical Group Corp. - Key offerings
                • Mitsubishi Chemical Group Corp. - Segment focus
                • SWOT
              • 15.13 Purolite Corp.
                • Purolite Corp. - Overview
                • Purolite Corp. - Product / Service
                • Purolite Corp. - Key offerings
                • SWOT
              • 15.14 Repligen Corp.
                • Repligen Corp. - Overview
                • Repligen Corp. - Product / Service
                • Repligen Corp. - Key offerings
                • SWOT
              • 15.15 Sepax Technologies Inc
                • Sepax Technologies Inc - Overview
                • Sepax Technologies Inc - Product / Service
                • Sepax Technologies Inc - Key offerings
                • SWOT
              • 15.16 Thermo Fisher Scientific Inc.
                • Thermo Fisher Scientific Inc. - Overview
                • Thermo Fisher Scientific Inc. - Business segments
                • Thermo Fisher Scientific Inc. - Key news
                • Thermo Fisher Scientific Inc. - Key offerings
                • Thermo Fisher Scientific Inc. - Segment focus
                • SWOT
              • 15.17 Tosoh Corp.
                • Tosoh Corp. - Overview
                • Tosoh Corp. - Business segments
                • Tosoh Corp. - Key offerings
                • Tosoh Corp. - Segment focus
                • SWOT
              • 15.18 W. R. Grace and Co.
                • W. R. Grace and Co. - Overview
                • W. R. Grace and Co. - Product / Service
                • W. R. Grace and Co. - Key offerings
                • SWOT

              16 Appendix

              • 16.1 Scope of the report
                • 16.2 Inclusions and exclusions checklist
                  • Inclusions checklist
                  • Exclusions checklist
                • 16.3 Currency conversion rates for US$
                  • Currency conversion rates for US$
                • 16.4 Research methodology
                  • Research methodology
                • 16.5 Data procurement
                  • Information sources
                • 16.6 Data validation
                  • Data validation
                • 16.7 Validation techniques employed for market sizing
                  • Validation techniques employed for market sizing
                • 16.8 Data synthesis
                  • Data synthesis
                • 16.9 360 degree market analysis
                  • 360 degree market analysis
                • 16.10 List of abbreviations
                  • List of abbreviations

                Research Methodology

                Technavio presents a detailed picture of the market by way of study, synthesis, and summation of data from multiple sources. The analysts have presented the various facets of the market with a particular focus on identifying the key industry influencers. The data thus presented is comprehensive, reliable, and the result of extensive research, both primary and secondary.

                INFORMATION SOURCES

                Primary sources

                • Manufacturers and suppliers
                • Channel partners
                • Industry experts
                • Strategic decision makers

                Secondary sources

                • Industry journals and periodicals
                • Government data
                • Financial reports of key industry players
                • Historical data
                • Press releases

                DATA ANALYSIS

                Data Synthesis

                • Collation of data
                • Estimation of key figures
                • Analysis of derived insights

                Data Validation

                • Triangulation with data models
                • Reference against proprietary databases
                • Corroboration with industry experts

                REPORT WRITING

                Qualitative

                • Market drivers
                • Market challenges
                • Market trends
                • Five forces analysis

                Quantitative

                • Market size and forecast
                • Market segmentation
                • Geographical insights
                • Competitive landscape

                Interested in this report?

                Get your sample now to see our research methodology and insights!

                Download Now

                Frequently Asked Questions

                Chromatography Resins market growth will increase by $ 1528.2 mn during 2025-2029 .

                The Chromatography Resins market is expected to grow at a CAGR of 8.5% during 2025-2029 .

                Chromatography Resins market is segmented by Type( Natural, Synthetic, Inorganic, size exclusion, multimodal) Technique( Affinity, Ion exchange, Hydrophobic interaction, Size exclusion, Multimodal) End-user( Pharma and biotech, Food and beverage, Water and environmental analysis, Others, South America)

                Agilent Technologies Inc., Avantor Inc., Bio Rad Laboratories Inc., Bio-Works Technologies AB, Cytiva, DuPont de Nemours Inc., JNC Corp., Merck KGaA, Mitsubishi Chemical Group Corp., Purolite Corp., Repligen Corp., Sepax Technologies Inc, Thermo Fisher Scientific Inc., Tosoh Corp., W. R. Grace and Co. are a few of the key vendors in the Chromatography Resins market.

                North America will register the highest growth rate of 33% among the other regions. Therefore, the Chromatography Resins market in North America is expected to garner significant business opportunities for the vendors during the forecast period.

                US, China, Germany, UK, India, Canada, Japan, France, Brazil, South Korea

                • Rising demand for biopharmaceuticalsThe rising demand for biopharmaceuticals is a primary driver of the global chromatography resins market. Biopharmaceuticals is the driving factor this market.
                • including monoclonal antibodies is the driving factor this market.
                • recombinant proteins is the driving factor this market.
                • and vaccines is the driving factor this market.
                • are reshaping the therapeutic landscape by offering targeted treatment options for a wide range of diseases is the driving factor this market.
                • such as cancer is the driving factor this market.
                • autoimmune disorders is the driving factor this market.
                • and infectious diseases. These biologics are structurally complex and sensitive is the driving factor this market.
                • requiring highly controlled purification processes to ensure product safety is the driving factor this market.
                • efficacy is the driving factor this market.
                • and regulatory compliance. Chromatography resins are integral to these processes is the driving factor this market.
                • enabling the selective separation of desired biomolecules from process-related impurities and contaminants. As the global population continues to age and the incidence of chronic diseases rises is the driving factor this market.
                • the demand for advanced biologic therapies is increasing. Biopharmaceuticals are preferred over traditional small-molecule drugs due to their high specificity is the driving factor this market.
                • reduced systemic toxicity is the driving factor this market.
                • and effectiveness in treating previously intractable conditions. The COVID-19 pandemic further underscored the importance of biologics is the driving factor this market.
                • particularly in the rapid development and production of vaccines is the driving factor this market.
                • which accelerated investment in biopharmaceutical research is the driving factor this market.
                • development is the driving factor this market.
                • and manufacturing infrastructure. To meet this growing demand is the driving factor this market.
                • pharmaceutical and biotechnology companies are expanding their production capabilities and adopting more efficient is the driving factor this market.
                • scalable purification technologies. Chromatography resins play a critical role in this expansion is the driving factor this market.
                • supporting both upstream and downstream bioprocessing workflows. The need for high-performance resins is particularly evident in emerging markets such as China is the driving factor this market.
                • India is the driving factor this market.
                • and Brazil is the driving factor this market.
                • where government initiatives and private investment are driving the growth of local biopharmaceutical manufacturing. Across all stages of drug development from early discovery to commercial-scale production chromatography resins are essential for achieving the purity and consistency required by global regulatory standards. Their role in enabling the production of safe and effective biologics positions them as a cornerstone technology in the evolving landscape of modern healthcare and therapeutic innovation. is the driving factor this market.

                The Chromatography Resins market vendors should focus on grabbing business opportunities from the Natural segment as it accounted for the largest market share in the base year.