Cinnamon Market Analysis, Size, and Forecast 2024-2028: North America (US and Canada), Europe (France, Germany, Italy, and UK), Middle East and Africa (Egypt, KSA, Oman, and UAE), APAC (China, India, Indonesia, Japan, Sri Lanka, and Vietnam), South America (Argentina and Brazil), and Rest of World (ROW)

Cinnamon Market Analysis, Size, and Forecast 2024-2028:
North America (US and Canada), Europe (France, Germany, Italy, and UK), Middle East and Africa (Egypt, KSA, Oman, and UAE), APAC (China, India, Indonesia, Japan, Sri Lanka, and Vietnam), South America (Argentina and Brazil), and Rest of World (ROW)

Published: May 2024 162 Pages SKU: IRTNTR45093

Market Overview at a Glance

$412.9 Mn
Market Opportunity
7.97%
CAGR
7.22
YoY growth 2023-2024(%)

Cinnamon Market Size 2024-2028

The cinnamon market size is forecast to increase by USD 412.9 million, at a CAGR of 7.97% between 2023 and 2028.

  • The market is driven by the increasing recognition of its health benefits, particularly in the areas of diabetes management and inflammation reduction. Ceylon cinnamon, also known as true cinnamon, is a premium variety widely used in the food, cosmetics, essential oil, and nutraceutical sectors. This trend is further amplified by the expanding application of cinnamon in the pharmaceutical industry, where it is used as an active ingredient in various formulations. However, market participants face challenges in navigating complex international food standards and export regulations, which can hinder the growth of the market. Compliance with these constraints requires significant resources and expertise, posing operational challenges for both producers and traders.
  • To capitalize on the market's potential, companies must invest in research and development to create innovative cinnamon-based products that cater to evolving consumer preferences and adhere to stringent regulatory requirements. Additionally, strategic partnerships and collaborations with regulatory bodies and industry associations can help streamline the compliance process and ensure a competitive edge in the market.

What will be the Size of the Cinnamon Market during the forecast period?

Cinnamon Market Size

Explore in-depth regional segment analysis with market size data - historical 2018-2022 and forecasts 2024-2028 - in the full report.  
Request Free Sample

Cinnamon, a versatile and sought-after spice, continues to captivate various sectors with its dynamic market activities. From pharmaceutical applications to culinary uses, the evolving nature of this market is shaped by ongoing research and development. Cinnamon's active components, including cinnamaldehyde, polyphenols, and antioxidants, are subject to rigorous quality assessment, ensuring consistency and efficacy. Cultivation practices, such as sustainable farming and disease resistance, influence ingredient sourcing and the antioxidant capacity assay. The anti-inflammatory effects of cinnamon are a focus in pharmaceutical applications, while aroma compounds and spice blends cater to the culinary industry. Cinnamon's extraction methods, including oil distillation and bark extraction, are continually refined to optimize yield and improve processing techniques.

The supply chain is shaped by global demand, with various countries contributing to the genetic diversity of cinnamon. Cinnamon's health benefits, including blood sugar regulation and antimicrobial properties, fuel innovation in food applications and cosmetics. Sustainability and pest management are essential considerations in the cinnamon industry, ensuring a high-quality product with a long shelf life. The continuous unfolding of market activities and evolving patterns in the market reflect the ongoing research and development in this dynamic sector.

How is this Cinnamon Industry segmented?

The cinnamon industry research report provides comprehensive data (region-wise segment analysis), with forecasts and estimates in "USD million" for the period 2024-2028, as well as historical data from 2018-2022 for the following segments.

  • Product
    • Cassia cinnamon
    • Ceylon cinnamon
  • Application
    • Residential
    • Commercial
  • Form
    • Quills
    • Chips
    • Powder
    • Oil
    • Extracts
    • Others
  • Nature
    • Organic
    • Conventional
  • Distribution Channel
    • Hypermarkets
    • Supermarkets
    • Online Retailers
    • Convenience Stores
    • Specialty Stores
  • Geography
    • North America
      • US
      • Canada
    • Europe
      • France
      • Germany
      • Italy
      • UK
    • Middle East and Africa
      • Egypt
      • KSA
      • Oman
      • UAE
    • APAC
      • China
      • India
      • Indonesia
      • Japan
      • Sri Lanka
      • Vietnam
    • South America
      • Argentina
      • Brazil
    • Rest of World (ROW)

By Product Insights

The cassia cinnamon segment is estimated to witness significant growth during the forecast period.

Cinnamon, a versatile spice derived from the inner bark of several trees, is renowned for its distinct flavor and aroma. Three primary varieties dominate the market: Indonesian, Saigon, and Chinese cinnamon. Indonesian cinnamon, the most widely used in the Cassia cinnamon segment, is sourced primarily from Indonesia. It is characterized by its sweet and mild taste, making it an ideal choice for baking and beverages. Saigon cinnamon, grown mainly in Vietnam, is known for its strong and spicy flavor. This variety is employed not only in culinary applications but also in the pharmaceutical sector for medicinal purposes, particularly for diabetes and arthritis.

Chinese cinnamon, predominantly produced in China, is used extensively in traditional Chinese medicine for treating ailments such as cough and fever. The cultivation practices for cinnamon involve careful harvesting of the bark, which undergoes various processing techniques, including sun-drying, steaming, and grinding, to produce ground cinnamon powder or cinnamon sticks. The extraction methods for cinnamon oil involve distillation, which yields cassia essential oil and cinnamon bark extract. The antioxidant capacity of cinnamon is attributed to its active components, including polyphenols and cinnamaldehyde content. These properties contribute to cinnamon's health benefits, such as antimicrobial properties, blood sugar regulation, and anti-inflammatory effects.

Cinnamon's applications extend beyond the culinary realm. It is used in cosmetics for its aroma compounds and antioxidant properties. The sustainability of cinnamon production is a concern, with efforts being made to optimize yield and employ pest management techniques. The supply chain for cinnamon involves various stakeholders, from farmers to processors, traders, and end-users. The market for cinnamon continues to evolve, with ongoing research into its genetic diversity, health benefits, and potential applications in various industries.

Cinnamon Market Size

Request Free Sample

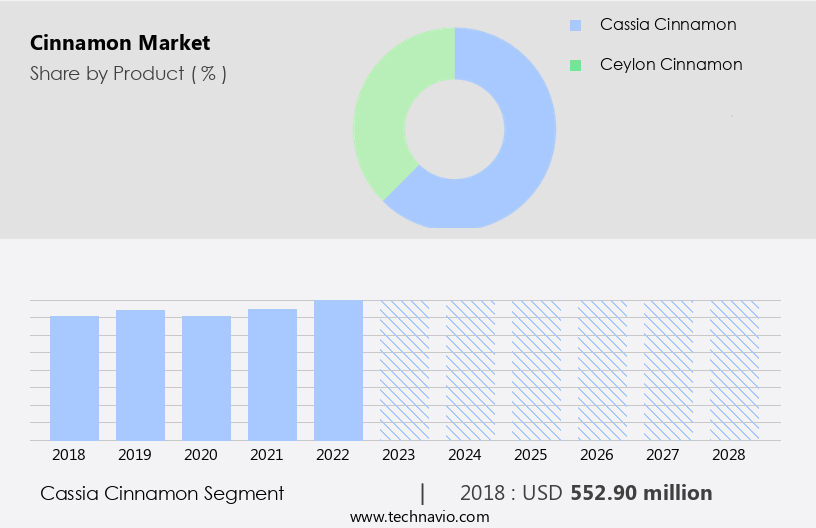
The Cassia cinnamon segment was valued at USD 552.90 million in 2018 and showed a gradual increase during the forecast period.

Regional Analysis

APAC is estimated to contribute 74% to the growth of the global market during the forecast period.Technavio’s analysts have elaborately explained the regional trends and drivers that shape the market during the forecast period.

Cinnamon Market Share by Geography

 Request Free Sample

Cinnamon, a versatile spice widely used in various cuisines, particularly in Asia, is gaining increasing recognition for its health benefits and diverse applications. Cassia cinnamon, predominantly used in Indian cooking, has seen popularity surge in recent years. However, growing concerns over its health implications are likely to influence market dynamics. Meanwhile, the expanding use of cinnamon in pharmaceuticals and cosmetics sectors has propelled market growth. Cultivated for centuries in traditional Chinese and Indian medicine, cinnamon's health benefits include aiding indigestion, regulating blood sugar, and exhibiting anti-inflammatory properties. Cinnamon's antioxidant capacity, attributed to its polyphenols and cinnamaldehyde content, is another significant factor driving demand.

Sustainable cultivation practices, pest management, and optimization of yield are crucial considerations in the cinnamon supply chain. The versatile spice is also used in beverages, food applications, and as a flavoring agent in various spice blends. Cinnamon's aroma compounds and flavor profiles contribute to its widespread appeal. In the cosmetics industry, cinnamon oil distillation and extraction methods are used to derive essential oils and bark extracts for various applications. The market for cinnamon continues to evolve, with ongoing research into its health benefits and expanding applications.

Market Dynamics

The Cinnamon Market is thriving as demand for cinnamon, particularly Ceylon cinnamon and organic cinnamon, surges among cinnamon for health-conscious consumers. Cinnamon in baking and cinnamon in beverages enhance culinary applications, while cinnamon supplements and cinnamon supplements for blood sugar support cater to wellness trends. Cinnamon clean label and cinnamon sustainable sourcing appeal to eco-conscious buyers, supported by cinnamon sustainable production methods. Cinnamon oil and cinnamon powder add versatility to products, driving growth in the cinnamon organic market. Cinnamon for digestive health and best Ceylon cinnamon for health benefits attract health-focused consumers, while cinnamon for clean label food products and organic cinnamon for baking recipes boost market appeal, ensuring robust expansion.

Our researchers analyzed the data with 2023 as the base year, along with the key drivers, trends, and challenges. A holistic analysis of drivers will help companies refine their marketing strategies to gain a competitive advantage.

What are the key market drivers leading to the rise in the adoption of Cinnamon Industry?

  • The significant rise in public awareness regarding the health advantages of incorporating cinnamon into one's diet serves as the primary catalyst for the market's growth. 
  • Cinnamon, a popular spice known for its distinctive flavor and aroma, has gained significant attention in the food and pharmaceutical industries due to its numerous health benefits. The spice is widely used in culinary applications, enhancing the taste of various dishes. However, its utility extends beyond the kitchen, as cinnamon is also employed in the production of pharmaceutical products. Cinnamon's antibacterial and antifungal properties make it an effective preservative for food and beverage products. Cinnamaldehyde, a primary flavor compound found in cinnamon bark extract and cassia essential oil, plays a crucial role in preventing unwanted blood platelet clotting, making it an anti-inflammatory agent.
  • Furthermore, research suggests that cinnamon helps regulate blood sugar levels in individuals with type-2 diabetes and reduces the risk of heart disease and colon cancer due to its rich manganese, calcium, and dietary fiber content. In the beverage industry, cinnamon is a popular addition to teas, coffees, and hot cocoas, offering a warm and comforting taste while providing potential health benefits. Cinnamon's versatility and health advantages make it an essential ingredient in various food applications, including baked goods, cereals, and savory dishes. As consumer awareness about nutrition and healthy food choices continues to grow, the demand for high-quality cinnamon is expected to increase.

What are the market trends shaping the Cinnamon Industry?

  • The increasing utilization of cinnamon in pharmaceuticals represents a significant market trend. This spice's application in the healthcare industry is becoming more prevalent due to its numerous health benefits.
  • Cinnamon, a popular spice known for its distinctive aroma and flavor, is gaining recognition in the medical and pharmaceutical industries due to its antimicrobial properties. The primary active component responsible for these benefits is cinnamaldehyde, which makes up 60-90% of essential oils extracted from the plant. This organic compound not only enhances the taste and smell of cinnamon but also exhibits potential as a replacement for antibiotics, particularly against bacteria that have developed resistance. Cinnamon's antimicrobial properties stem from its ability to disrupt bacterial biofilms, which contribute to various infections. The antioxidant capacity of cinnamon has also been assessed through various studies, further highlighting its potential health benefits.
  • The sourcing of cinnamon ingredients is crucial in maintaining their therapeutic properties. Cultivation practices play a significant role in ensuring the quality and consistency of cinnamon. Several extraction methods, such as steam distillation and solvent extraction, are employed to obtain cinnamon essential oils rich in cinnamaldehyde content. Cinnamon spice blends and aroma compounds are widely used in food and beverage industries. However, the medical applications of cinnamon are increasingly gaining attention due to its anti-inflammatory effects and potential as a natural antibiotic alternative.

What challenges does the Cinnamon Industry face during its growth?

  • Adhering to compliance constraints with international food standards and export regulations is a significant challenge that can impede industry growth. Ensuring adherence to these regulations involves rigorous testing, documentation, and certification processes, which can add time and cost to the production and export of food products. Failure to comply can result in fines, recalls, or even the revocation of export licenses, making it a critical issue for food industry professionals to address. 
  • Cinnamon, a popular spice known for its distinctive aroma and health benefits, faces challenges in the global market due to supply chain issues and stringent import regulations. Major exporting countries, such as Sri Lanka, struggle to meet buyer specifications, hampering growth. Importing countries, particularly those in Western Europe, enforce rigorous product quality and supplier standards. The European Spice Association (ESA) established the Quality Minima Document (QMD) in 2015, setting compliance requirements for spices and herbs sold in the European market.
  • Exporters must also adhere to the General Food Law (GFL), the EU's food safety regulation. Cinnamon's genetic diversity and processing techniques contribute to its health benefits, including antimicrobial properties and blood sugar regulation. The polyphenols in ground cinnamon powder are responsible for these advantages. Sustainability is another crucial factor in the market, with a growing emphasis on ethical sourcing and eco-friendly production methods.

Exclusive Customer Landscape

The cinnamon market forecasting report includes the adoption lifecycle of the market, covering from the innovator’s stage to the laggard’s stage. It focuses on adoption rates in different regions based on penetration. Furthermore, the cinnamon market report also includes key purchase criteria and drivers of price sensitivity to help companies evaluate and develop their market growth analysis strategies.

Cinnamon Market Share by Geography

 Customer Landscape

Key Companies & Market Insights

Companies are implementing various strategies, such as strategic alliances, cinnamon market forecast, partnerships, mergers and acquisitions, geographical expansion, and product/service launches, to enhance their presence in the industry.

Biofoods Pvt. Ltd. - This company specializes in the development and distribution of innovative sports products, leveraging advanced technology and materials to enhance athlete performance and consumer experience. Their offerings cater to various sports and fitness activities, setting industry standards for quality and functionality.

The industry research and growth report includes detailed analyses of the competitive landscape of the market and information about key companies, including:

  • Biofoods Pvt. Ltd.
  • Cell Foods
  • Ceylon Spice Co.
  • Cinnamon Exports Pvt Ltd.
  • EHL Ltd.
  • Elite Spice Inc.
  • EOAS Organics Pvt Ltd.
  • First Spice Mixing Co.
  • Goya Foods Inc.
  • HDDES Group
  • McCormick and Co. Inc.
  • Organic Spices Inc.
  • Ozone Naturals
  • Sauer Brands Inc.
  • SDS Spices
  • Taj Agro International
  • The Bart Ingredients Co.
  • The Great American Spice Co.
  • True Ceylon Spices
  • Vijaya Enterprises

Qualitative and quantitative analysis of companies has been conducted to help clients understand the wider business environment as well as the strengths and weaknesses of key industry players. Data is qualitatively analyzed to categorize companies as pure play, category-focused, industry-focused, and diversified; it is quantitatively analyzed to categorize companies as dominant, leading, strong, tentative, and weak.

Recent Development and News in Cinnamon Market

  • In January 2024, the market announced the launch of its innovative new product, "Cinnamon Boost," a cinnamon extract supplement, at the Nutraceutical Business World Expo. This launch marked a strategic shift towards expanding the company's product portfolio beyond traditional spice offerings (Source: the market Press Release).
  • In March 2024, the market entered into a major collaboration with leading food and beverage manufacturer, Fusion Foods, to develop and market cinnamon-infused food and beverage products. This strategic partnership aimed to capitalize on the growing demand for functional foods and beverages (Source: Fusion Foods Press Release).
  • In August 2024, the market secured a significant investment of USD15 million in a Series B funding round, led by venture capital firm, Growth Equity Partners. The funds were earmarked for research and development, marketing, and expanding production capacity (Source: SEC Filing).
  • In May 2025, the market received regulatory approval from the European Union for its cinnamon extract supplements, marking its entry into the European market. This expansion was expected to contribute significantly to the company's revenue growth (Source: European Commission Press Release).

Research Analyst Overview

  • In the dynamic and complex market, various components play pivotal roles. Cinnamon flavor enhancers, such as cinnamyl alcohol and methyl cinnamaldehyde, are in high demand for their ability to enhance food and beverage products' taste profiles. Cinnamic acid derivatives, a crucial part of cinnamon oleoresin, are essential for creating consistent product quality. Processing optimization and regulatory compliance are key areas of focus for market participants. Sustainable sourcing and waste management are essential for maintaining a responsible value chain. Cinnamon ingredient labeling and product standardization are vital for consumer trust and market transparency. Quality control and packaging solutions are crucial for maintaining the sensory properties of cinnamon end-product formulations.
  • Innovation and flavor stability studies are ongoing to expand cinnamon's applications and cater to evolving consumer preferences. Organic cinnamon certification and sensory analysis ensure authenticity and consistency in the market. Market segmentation based on consumer perception and adulteration detection methods are essential for effective pricing strategies. Cinnamon aroma profiles and end-use applications continue to drive market growth. The cinnamon value chain encompasses various stakeholders, from farmers to manufacturers and retailers, all working together to meet the growing demand for this versatile and beloved spice.

Dive into Technavio’s robust research methodology, blending expert interviews, extensive data synthesis, and validated models for unparalleled Cinnamon Market insights. See full methodology.

Market Scope

Report Coverage

Details

Page number

162

Base year

2023

Historic period

2018-2022

Forecast period

2024-2028

Growth momentum & CAGR

Accelerate at a CAGR of 7.97%

Market growth 2024-2028

USD 412.9 million

Market structure

Fragmented

YoY growth 2023-2024(%)

7.22

Key countries

US, Canada, Germany, UK, Italy, France, China, India, Japan, Brazil, Egypt, UAE, Oman, Argentina, KSA, UAE, Brazil, Rest of World (ROW), Indonesia, Vietnam, and Sri Lanka

Competitive landscape

Leading Companies, Market Positioning of Companies, Competitive Strategies, and Industry Risks

Request Free Sample

What are the Key Data Covered in this Cinnamon Market Research and Growth Report?

  • CAGR of the Cinnamon industry during the forecast period
  • Detailed information on factors that will drive the growth and forecasting between 2024 and 2028
  • Precise estimation of the size of the market and its contribution of the industry in focus to the parent market
  • Accurate predictions about upcoming growth and trends and changes in consumer behaviour
  • Growth of the market across APAC, North America, Europe, South America, and Middle East and Africa
  • Thorough analysis of the market’s competitive landscape and detailed information about companies
  • Comprehensive analysis of factors that will challenge the cinnamon market growth of industry companies

We can help! Our analysts can customize this cinnamon market research report to meet your requirements.

Get in touch

1 Executive Summary

  • 1.1 Market overview
    • Executive Summary - Chart on Market Overview
    • Executive Summary - Data Table on Market Overview
    • Executive Summary - Chart on Global Market Characteristics
    • Executive Summary - Chart on Market by Geography
    • Executive Summary - Chart on Market Segmentation by Product
    • Executive Summary - Chart on Market Segmentation by Application
    • Executive Summary - Chart on Incremental Growth
    • Executive Summary - Data Table on Incremental Growth
    • Executive Summary - Chart on Company Market Positioning

2 Market Landscape

  • 2.1 Market ecosystem
    • Parent Market
    • Data Table on - Parent Market
  • 2.2 Market characteristics
    • Market characteristics analysis
  • 2.3 Value chain analysis
    • Value Chain Analysis

3 Market Sizing

  • 3.1 Market definition
    • Offerings of companies included in the market definition
  • 3.2 Market segment analysis
    • Market segments
  • 3.3 Market size 2023
    • 3.4 Market outlook: Forecast for 2023-2028
      • Chart on Global - Market size and forecast 2023-2028 ($ million)
      • Data Table on Global - Market size and forecast 2023-2028 ($ million)
      • Chart on Global Market: Year-over-year growth 2023-2028 (%)
      • Data Table on Global Market: Year-over-year growth 2023-2028 (%)

    4 Historic Market Size

    • 4.1 Global Cinnamon Market 2018 - 2022
      • Historic Market Size - Data Table on Global Cinnamon Market 2018 - 2022 ($ million)
    • 4.2 Product segment analysis 2018 - 2022
      • Historic Market Size - Product Segment 2018 - 2022 ($ million)
    • 4.3 Application segment analysis 2018 - 2022
      • Historic Market Size - Application Segment 2018 - 2022 ($ million)
    • 4.4 Geography segment analysis 2018 - 2022
      • Historic Market Size - Geography Segment 2018 - 2022 ($ million)
    • 4.5 Country segment analysis 2018 - 2022
      • Historic Market Size - Country Segment 2018 - 2022 ($ million)

    5 Five Forces Analysis

    • 5.1 Five forces summary
      • Five forces analysis - Comparison between 2023 and 2028
    • 5.2 Bargaining power of buyers
      • Bargaining power of buyers - Impact of key factors 2023 and 2028
    • 5.3 Bargaining power of suppliers
      • Bargaining power of suppliers - Impact of key factors in 2023 and 2028
    • 5.4 Threat of new entrants
      • Threat of new entrants - Impact of key factors in 2023 and 2028
    • 5.5 Threat of substitutes
      • Threat of substitutes - Impact of key factors in 2023 and 2028
    • 5.6 Threat of rivalry
      • Threat of rivalry - Impact of key factors in 2023 and 2028
    • 5.7 Market condition
      • Chart on Market condition - Five forces 2023 and 2028

    6 Market Segmentation by Product

    • 6.1 Market segments
      • Chart on Product - Market share (2023-2028) (%)
      • Data Table on Product - Market share (2023-2028) (%)
    • 6.2 Comparison by Product
      • Chart on Comparison by Product
      • Data Table on Comparison by Product
    • 6.3 Cassia cinnamon - Market size and forecast (2023-2028)
      • Chart on Cassia cinnamon - Market size and forecast (2023-2028) ($ million)
      • Data Table on Cassia cinnamon - Market size and forecast (2023-2028) ($ million)
      • Chart on Cassia cinnamon - Year-over-year growth (2023-2028) (%)
      • Data Table on Cassia cinnamon - Year-over-year growth (2023-2028) (%)
    • 6.4 Ceylon cinnamon - Market size and forecast (2023-2028)
      • Chart on Ceylon cinnamon - Market size and forecast (2023-2028) ($ million)
      • Data Table on Ceylon cinnamon - Market size and forecast (2023-2028) ($ million)
      • Chart on Ceylon cinnamon - Year-over-year growth (2023-2028) (%)
      • Data Table on Ceylon cinnamon - Year-over-year growth (2023-2028) (%)
    • 6.5 Market opportunity by Product
      • Market opportunity by Product ($ million)
      • Data Table on Market opportunity by Product ($ million)

    7 Market Segmentation by Application

    • 7.1 Market segments
      • Chart on Application - Market share (2023-2028) (%)
      • Data Table on Application - Market share (2023-2028) (%)
    • 7.2 Comparison by Application
      • Chart on Comparison by Application
      • Data Table on Comparison by Application
    • 7.3 Residential - Market size and forecast (2023-2028)
      • Chart on Residential - Market size and forecast (2023-2028) ($ million)
      • Data Table on Residential - Market size and forecast (2023-2028) ($ million)
      • Chart on Residential - Year-over-year growth (2023-2028) (%)
      • Data Table on Residential - Year-over-year growth (2023-2028) (%)
    • 7.4 Commercial - Market size and forecast (2023-2028)
      • Chart on Commercial - Market size and forecast (2023-2028) ($ million)
      • Data Table on Commercial - Market size and forecast (2023-2028) ($ million)
      • Chart on Commercial - Year-over-year growth (2023-2028) (%)
      • Data Table on Commercial - Year-over-year growth (2023-2028) (%)
    • 7.5 Market opportunity by Application
      • Market opportunity by Application ($ million)
      • Data Table on Market opportunity by Application ($ million)

    8 Market Segmentation by Form

    • 8.1 Market segments
      • Chart on Form - Market share (2023-2028) (%)
      • Data Table on Form - Market share (2023-2028) (%)
    • 8.2 Comparison by Form
      • Chart on Comparison by Form
      • Data Table on Comparison by Form
    • 8.3 Quills - Market size and forecast (2023-2028)
      • Chart on Quills - Market size and forecast (2023-2028) ($ million)
      • Data Table on Quills - Market size and forecast (2023-2028) ($ million)
      • Chart on Quills - Year-over-year growth (2023-2028) (%)
      • Data Table on Quills - Year-over-year growth (2023-2028) (%)
    • 8.4 Chips - Market size and forecast (2023-2028)
      • Chart on Chips - Market size and forecast (2023-2028) ($ million)
      • Data Table on Chips - Market size and forecast (2023-2028) ($ million)
      • Chart on Chips - Year-over-year growth (2023-2028) (%)
      • Data Table on Chips - Year-over-year growth (2023-2028) (%)
    • 8.5 Powder - Market size and forecast (2023-2028)
      • Chart on Powder - Market size and forecast (2023-2028) ($ million)
      • Data Table on Powder - Market size and forecast (2023-2028) ($ million)
      • Chart on Powder - Year-over-year growth (2023-2028) (%)
      • Data Table on Powder - Year-over-year growth (2023-2028) (%)
    • 8.6 Oil - Market size and forecast (2023-2028)
      • Chart on Oil - Market size and forecast (2023-2028) ($ million)
      • Data Table on Oil - Market size and forecast (2023-2028) ($ million)
      • Chart on Oil - Year-over-year growth (2023-2028) (%)
      • Data Table on Oil - Year-over-year growth (2023-2028) (%)
    • 8.7 Extracts - Market size and forecast (2023-2028)
      • Chart on Extracts - Market size and forecast (2023-2028) ($ million)
      • Data Table on Extracts - Market size and forecast (2023-2028) ($ million)
      • Chart on Extracts - Year-over-year growth (2023-2028) (%)
      • Data Table on Extracts - Year-over-year growth (2023-2028) (%)
    • 8.8 Others - Market size and forecast (2023-2028)
      • Chart on Others - Market size and forecast (2023-2028) ($ million)
      • Data Table on Others - Market size and forecast (2023-2028) ($ million)
      • Chart on Others - Year-over-year growth (2023-2028) (%)
      • Data Table on Others - Year-over-year growth (2023-2028) (%)
    • 8.9 Market opportunity by Form
      • Market opportunity by Form ($ million)
      • Data Table on Market opportunity by Form ($ million)

    9 Market Segmentation by Nature

    • 9.1 Market segments
      • Chart on Nature - Market share (2023-2028) (%)
      • Data Table on Nature - Market share (2023-2028) (%)
    • 9.2 Comparison by Nature
      • Chart on Comparison by Nature
      • Data Table on Comparison by Nature
    • 9.3 Organic - Market size and forecast (2023-2028)
      • Chart on Organic - Market size and forecast (2023-2028) ($ million)
      • Data Table on Organic - Market size and forecast (2023-2028) ($ million)
      • Chart on Organic - Year-over-year growth (2023-2028) (%)
      • Data Table on Organic - Year-over-year growth (2023-2028) (%)
    • 9.4 Conventional - Market size and forecast (2023-2028)
      • Chart on Conventional - Market size and forecast (2023-2028) ($ million)
      • Data Table on Conventional - Market size and forecast (2023-2028) ($ million)
      • Chart on Conventional - Year-over-year growth (2023-2028) (%)
      • Data Table on Conventional - Year-over-year growth (2023-2028) (%)
    • 9.5 Market opportunity by Nature
      • Market opportunity by Nature ($ million)
      • Data Table on Market opportunity by Nature ($ million)

    10 Market Segmentation by Distribution Channel

    • 10.1 Market segments
      • Chart on Distribution Channel - Market share (2023-2028) (%)
      • Data Table on Distribution Channel - Market share (2023-2028) (%)
    • 10.2 Comparison by Distribution Channel
      • Chart on Comparison by Distribution Channel
      • Data Table on Comparison by Distribution Channel
    • 10.3 Hypermarkets - Market size and forecast (2023-2028)
      • Chart on Hypermarkets - Market size and forecast (2023-2028) ($ million)
      • Data Table on Hypermarkets - Market size and forecast (2023-2028) ($ million)
      • Chart on Hypermarkets - Year-over-year growth (2023-2028) (%)
      • Data Table on Hypermarkets - Year-over-year growth (2023-2028) (%)
    • 10.4 Supermarkets - Market size and forecast (2023-2028)
      • Chart on Supermarkets - Market size and forecast (2023-2028) ($ million)
      • Data Table on Supermarkets - Market size and forecast (2023-2028) ($ million)
      • Chart on Supermarkets - Year-over-year growth (2023-2028) (%)
      • Data Table on Supermarkets - Year-over-year growth (2023-2028) (%)
    • 10.5 Online Retailers - Market size and forecast (2023-2028)
      • Chart on Online Retailers - Market size and forecast (2023-2028) ($ million)
      • Data Table on Online Retailers - Market size and forecast (2023-2028) ($ million)
      • Chart on Online Retailers - Year-over-year growth (2023-2028) (%)
      • Data Table on Online Retailers - Year-over-year growth (2023-2028) (%)
    • 10.6 Convenience Stores - Market size and forecast (2023-2028)
      • Chart on Convenience Stores - Market size and forecast (2023-2028) ($ million)
      • Data Table on Convenience Stores - Market size and forecast (2023-2028) ($ million)
      • Chart on Convenience Stores - Year-over-year growth (2023-2028) (%)
      • Data Table on Convenience Stores - Year-over-year growth (2023-2028) (%)
    • 10.7 Specialty Stores - Market size and forecast (2023-2028)
      • Chart on Specialty Stores - Market size and forecast (2023-2028) ($ million)
      • Data Table on Specialty Stores - Market size and forecast (2023-2028) ($ million)
      • Chart on Specialty Stores - Year-over-year growth (2023-2028) (%)
      • Data Table on Specialty Stores - Year-over-year growth (2023-2028) (%)
    • 10.8 Market opportunity by Distribution Channel
      • Market opportunity by Distribution Channel ($ million)
      • Data Table on Market opportunity by Distribution Channel ($ million)

    11 Customer Landscape

    • 11.1 Customer landscape overview
      • Analysis of price sensitivity, lifecycle, customer purchase basket, adoption rates, and purchase criteria

    12 Geographic Landscape

    • 12.1 Geographic segmentation
      • Chart on Market share by geography 2023-2028 (%)
      • Data Table on Market share by geography 2023-2028 (%)
    • 12.2 Geographic comparison
      • Chart on Geographic comparison
      • Data Table on Geographic comparison
    • 12.3 APAC - Market size and forecast 2023-2028
      • Chart on APAC - Market size and forecast 2023-2028 ($ million)
      • Data Table on APAC - Market size and forecast 2023-2028 ($ million)
      • Chart on APAC - Year-over-year growth 2023-2028 (%)
      • Data Table on APAC - Year-over-year growth 2023-2028 (%)
    • 12.4 North America - Market size and forecast 2023-2028
      • Chart on North America - Market size and forecast 2023-2028 ($ million)
      • Data Table on North America - Market size and forecast 2023-2028 ($ million)
      • Chart on North America - Year-over-year growth 2023-2028 (%)
      • Data Table on North America - Year-over-year growth 2023-2028 (%)
    • 12.5 Europe - Market size and forecast 2023-2028
      • Chart on Europe - Market size and forecast 2023-2028 ($ million)
      • Data Table on Europe - Market size and forecast 2023-2028 ($ million)
      • Chart on Europe - Year-over-year growth 2023-2028 (%)
      • Data Table on Europe - Year-over-year growth 2023-2028 (%)
    • 12.6 South America - Market size and forecast 2023-2028
      • Chart on South America - Market size and forecast 2023-2028 ($ million)
      • Data Table on South America - Market size and forecast 2023-2028 ($ million)
      • Chart on South America - Year-over-year growth 2023-2028 (%)
      • Data Table on South America - Year-over-year growth 2023-2028 (%)
    • 12.7 Middle East and Africa - Market size and forecast 2023-2028
      • Chart on Middle East and Africa - Market size and forecast 2023-2028 ($ million)
      • Data Table on Middle East and Africa - Market size and forecast 2023-2028 ($ million)
      • Chart on Middle East and Africa - Year-over-year growth 2023-2028 (%)
      • Data Table on Middle East and Africa - Year-over-year growth 2023-2028 (%)
    • 12.8 Indonesia - Market size and forecast 2023-2028
      • Chart on Indonesia - Market size and forecast 2023-2028 ($ million)
      • Data Table on Indonesia - Market size and forecast 2023-2028 ($ million)
      • Chart on Indonesia - Year-over-year growth 2023-2028 (%)
      • Data Table on Indonesia - Year-over-year growth 2023-2028 (%)
    • 12.9 China - Market size and forecast 2023-2028
      • Chart on China - Market size and forecast 2023-2028 ($ million)
      • Data Table on China - Market size and forecast 2023-2028 ($ million)
      • Chart on China - Year-over-year growth 2023-2028 (%)
      • Data Table on China - Year-over-year growth 2023-2028 (%)
    • 12.10 Vietnam - Market size and forecast 2023-2028
      • Chart on Vietnam - Market size and forecast 2023-2028 ($ million)
      • Data Table on Vietnam - Market size and forecast 2023-2028 ($ million)
      • Chart on Vietnam - Year-over-year growth 2023-2028 (%)
      • Data Table on Vietnam - Year-over-year growth 2023-2028 (%)
    • 12.11 Sri Lanka - Market size and forecast 2023-2028
      • Chart on Sri Lanka - Market size and forecast 2023-2028 ($ million)
      • Data Table on Sri Lanka - Market size and forecast 2023-2028 ($ million)
      • Chart on Sri Lanka - Year-over-year growth 2023-2028 (%)
      • Data Table on Sri Lanka - Year-over-year growth 2023-2028 (%)
    • 12.12 India - Market size and forecast 2023-2028
      • Chart on India - Market size and forecast 2023-2028 ($ million)
      • Data Table on India - Market size and forecast 2023-2028 ($ million)
      • Chart on India - Year-over-year growth 2023-2028 (%)
      • Data Table on India - Year-over-year growth 2023-2028 (%)
    • 12.13 Market opportunity by geography
      • Market opportunity by geography ($ million)
      • Data Tables on Market opportunity by geography ($ million)
    • 12.14 US - Market size and forecast (2023-2028)
      • Chart on US - Market size and forecast (2023-2028) ($ million)
      • Data Table on US - Market size and forecast (2023-2028) ($ million)
      • Chart on US - Year-over-year growth (2023-2028) (%)
      • Data Table on US - Year-over-year growth (2023-2028) (%)
    • 12.15 Canada - Market size and forecast (2023-2028)
      • Chart on Canada - Market size and forecast (2023-2028) ($ million)
      • Data Table on Canada - Market size and forecast (2023-2028) ($ million)
      • Chart on Canada - Year-over-year growth (2023-2028) (%)
      • Data Table on Canada - Year-over-year growth (2023-2028) (%)
    • 12.16 Germany - Market size and forecast (2023-2028)
      • Chart on Germany - Market size and forecast (2023-2028) ($ million)
      • Data Table on Germany - Market size and forecast (2023-2028) ($ million)
      • Chart on Germany - Year-over-year growth (2023-2028) (%)
      • Data Table on Germany - Year-over-year growth (2023-2028) (%)
    • 12.17 UK - Market size and forecast (2023-2028)
      • Chart on UK - Market size and forecast (2023-2028) ($ million)
      • Data Table on UK - Market size and forecast (2023-2028) ($ million)
      • Chart on UK - Year-over-year growth (2023-2028) (%)
      • Data Table on UK - Year-over-year growth (2023-2028) (%)
    • 12.18 Italy - Market size and forecast (2023-2028)
      • Chart on Italy - Market size and forecast (2023-2028) ($ million)
      • Data Table on Italy - Market size and forecast (2023-2028) ($ million)
      • Chart on Italy - Year-over-year growth (2023-2028) (%)
      • Data Table on Italy - Year-over-year growth (2023-2028) (%)
    • 12.19 France - Market size and forecast (2023-2028)
      • Chart on France - Market size and forecast (2023-2028) ($ million)
      • Data Table on France - Market size and forecast (2023-2028) ($ million)
      • Chart on France - Year-over-year growth (2023-2028) (%)
      • Data Table on France - Year-over-year growth (2023-2028) (%)
    • 12.20 Japan - Market size and forecast (2023-2028)
      • Chart on Japan - Market size and forecast (2023-2028) ($ million)
      • Data Table on Japan - Market size and forecast (2023-2028) ($ million)
      • Chart on Japan - Year-over-year growth (2023-2028) (%)
      • Data Table on Japan - Year-over-year growth (2023-2028) (%)
    • 12.21 Brazil - Market size and forecast (2023-2028)
      • Chart on Brazil - Market size and forecast (2023-2028) ($ million)
      • Data Table on Brazil - Market size and forecast (2023-2028) ($ million)
      • Chart on Brazil - Year-over-year growth (2023-2028) (%)
      • Data Table on Brazil - Year-over-year growth (2023-2028) (%)
    • 12.22 Egypt - Market size and forecast (2023-2028)
      • Chart on Egypt - Market size and forecast (2023-2028) ($ million)
      • Data Table on Egypt - Market size and forecast (2023-2028) ($ million)
      • Chart on Egypt - Year-over-year growth (2023-2028) (%)
      • Data Table on Egypt - Year-over-year growth (2023-2028) (%)
    • 12.23 UAE - Market size and forecast (2023-2028)
      • Chart on UAE - Market size and forecast (2023-2028) ($ million)
      • Data Table on UAE - Market size and forecast (2023-2028) ($ million)
      • Chart on UAE - Year-over-year growth (2023-2028) (%)
      • Data Table on UAE - Year-over-year growth (2023-2028) (%)
    • 12.24 Oman - Market size and forecast (2023-2028)
      • Chart on Oman - Market size and forecast (2023-2028) ($ million)
      • Data Table on Oman - Market size and forecast (2023-2028) ($ million)
      • Chart on Oman - Year-over-year growth (2023-2028) (%)
      • Data Table on Oman - Year-over-year growth (2023-2028) (%)
    • 12.25 Argentina - Market size and forecast (2023-2028)
      • Chart on Argentina - Market size and forecast (2023-2028) ($ million)
      • Data Table on Argentina - Market size and forecast (2023-2028) ($ million)
      • Chart on Argentina - Year-over-year growth (2023-2028) (%)
      • Data Table on Argentina - Year-over-year growth (2023-2028) (%)
    • 12.26 KSA - Market size and forecast (2023-2028)
      • Chart on KSA - Market size and forecast (2023-2028) ($ million)
      • Data Table on KSA - Market size and forecast (2023-2028) ($ million)
      • Chart on KSA - Year-over-year growth (2023-2028) (%)
      • Data Table on KSA - Year-over-year growth (2023-2028) (%)
    • 12.27 Rest of World (ROW) - Market size and forecast (2023-2028)
      • Chart on Rest of World (ROW) - Market size and forecast (2023-2028) ($ million)
      • Data Table on Rest of World (ROW) - Market size and forecast (2023-2028) ($ million)
      • Chart on Rest of World (ROW) - Year-over-year growth (2023-2028) (%)
      • Data Table on Rest of World (ROW) - Year-over-year growth (2023-2028) (%)

    13 Drivers, Challenges, and Opportunity/Restraints

    • 13.1 Market drivers
      • 13.2 Market challenges
        • 13.3 Impact of drivers and challenges
          • Impact of drivers and challenges in 2023 and 2028
        • 13.4 Market opportunities/restraints

          14 Competitive Landscape

          • 14.1 Overview
            • 14.2 Competitive Landscape
              • Overview on criticality of inputs and factors of differentiation
            • 14.3 Landscape disruption
              • Overview on factors of disruption
            • 14.4 Industry risks
              • Impact of key risks on business

            15 Competitive Analysis

            • 15.1 Companies profiled
              • Companies covered
            • 15.2 Market positioning of companies
              • Matrix on companies position and classification
            • 15.3 Biofoods Pvt. Ltd.
              • Biofoods Pvt. Ltd. - Overview
              • Biofoods Pvt. Ltd. - Product / Service
              • Biofoods Pvt. Ltd. - Key offerings
            • 15.4 Cell Foods
              • Cell Foods - Overview
              • Cell Foods - Product / Service
              • Cell Foods - Key offerings
            • 15.5 Cinnamon Exports Pvt Ltd.
              • Cinnamon Exports Pvt Ltd. - Overview
              • Cinnamon Exports Pvt Ltd. - Product / Service
              • Cinnamon Exports Pvt Ltd. - Key offerings
            • 15.6 EHL Ltd.
              • EHL Ltd. - Overview
              • EHL Ltd. - Product / Service
              • EHL Ltd. - Key offerings
            • 15.7 Elite Spice Inc.
              • Elite Spice Inc. - Overview
              • Elite Spice Inc. - Product / Service
              • Elite Spice Inc. - Key offerings
            • 15.8 EOAS Organics Pvt Ltd.
              • EOAS Organics Pvt Ltd. - Overview
              • EOAS Organics Pvt Ltd. - Product / Service
              • EOAS Organics Pvt Ltd. - Key offerings
            • 15.9 First Spice Mixing Co.
              • First Spice Mixing Co. - Overview
              • First Spice Mixing Co. - Product / Service
              • First Spice Mixing Co. - Key offerings
            • 15.10 Goya Foods Inc.
              • Goya Foods Inc. - Overview
              • Goya Foods Inc. - Product / Service
              • Goya Foods Inc. - Key offerings
            • 15.11 HDDES Group
              • HDDES Group - Overview
              • HDDES Group - Product / Service
              • HDDES Group - Key offerings
            • 15.12 McCormick and Co. Inc.
              • McCormick and Co. Inc. - Overview
              • McCormick and Co. Inc. - Business segments
              • McCormick and Co. Inc. - Key news
              • McCormick and Co. Inc. - Key offerings
              • McCormick and Co. Inc. - Segment focus
            • 15.13 Organic Spices Inc.
              • Organic Spices Inc. - Overview
              • Organic Spices Inc. - Product / Service
              • Organic Spices Inc. - Key offerings
            • 15.14 Ozone Naturals
              • Ozone Naturals - Overview
              • Ozone Naturals - Product / Service
              • Ozone Naturals - Key offerings
            • 15.15 Sauer Brands Inc.
              • Sauer Brands Inc. - Overview
              • Sauer Brands Inc. - Product / Service
              • Sauer Brands Inc. - Key offerings
            • 15.16 SDS Spices
              • SDS Spices - Overview
              • SDS Spices - Product / Service
              • SDS Spices - Key offerings
            • 15.17 Taj Agro International
              • Taj Agro International - Overview
              • Taj Agro International - Product / Service
              • Taj Agro International - Key offerings

            16 Appendix

            • 16.1 Scope of the report
              • 16.2 Inclusions and exclusions checklist
                • Inclusions checklist
                • Exclusions checklist
              • 16.3 Currency conversion rates for US$
                • Currency conversion rates for US$
              • 16.4 Research methodology
                • Research methodology
              • 16.5 Data procurement
                • Information sources
              • 16.6 Data validation
                • Data validation
              • 16.7 Validation techniques employed for market sizing
                • Validation techniques employed for market sizing
              • 16.8 Data synthesis
                • Data synthesis
              • 16.9 360 degree market analysis
                • 360 degree market analysis
              • 16.10 List of abbreviations
                • List of abbreviations

              Research Methodology

              Technavio presents a detailed picture of the market by way of study, synthesis, and summation of data from multiple sources. The analysts have presented the various facets of the market with a particular focus on identifying the key industry influencers. The data thus presented is comprehensive, reliable, and the result of extensive research, both primary and secondary.

              INFORMATION SOURCES

              Primary sources

              • Manufacturers and suppliers
              • Channel partners
              • Industry experts
              • Strategic decision makers

              Secondary sources

              • Industry journals and periodicals
              • Government data
              • Financial reports of key industry players
              • Historical data
              • Press releases

              DATA ANALYSIS

              Data Synthesis

              • Collation of data
              • Estimation of key figures
              • Analysis of derived insights

              Data Validation

              • Triangulation with data models
              • Reference against proprietary databases
              • Corroboration with industry experts

              REPORT WRITING

              Qualitative

              • Market drivers
              • Market challenges
              • Market trends
              • Five forces analysis

              Quantitative

              • Market size and forecast
              • Market segmentation
              • Geographical insights
              • Competitive landscape

              Interested in this report?

              Get your sample now to see our research methodology and insights!

              Download Now

              Frequently Asked Questions

              Cinnamon market growth will increase by $ 412.9 mn during 2024-2028 .

              The Cinnamon market is expected to grow at a CAGR of 7.97% during 2024-2028 .

              Cinnamon market is segmented by Product( Cassia cinnamon, Ceylon cinnamon) Application( Residential, Commercial, Europe, South America, MEA)

              Biofoods Pvt. Ltd., Cell Foods, Ceylon Spice Co., Cinnamon Exports Pvt Ltd., EHL Ltd., Elite Spice Inc., EOAS Organics Pvt Ltd., First Spice Mixing Co., Goya Foods Inc., HDDES Group, McCormick and Co. Inc., Organic Spices Inc., Ozone Naturals, Sauer Brands Inc., SDS Spices, Taj Agro International, The Bart Ingredients Co., The Great American Spice Co., True Ceylon Spices, Vijaya Enterprises are a few of the key vendors in the Cinnamon market.

              APAC will register the highest growth rate of 74% among the other regions. Therefore, the Cinnamon market in APAC is expected to garner significant business opportunities for the vendors during the forecast period.

              US, Canada, Germany, UK, Italy, France, China, India, Japan, Brazil, Egypt, UAE, Oman, Argentina, KSA, UAE, Brazil, Rest of World (ROW), Indonesia, Vietnam, Sri Lanka

              • Rising awareness about health benefits of cinnamonDue to the growing concern about nutrition and healthy food habits is the driving factor this market.
              • cinnamon has found increased applications in the food and beverage sector. Cinnamon is widely used as a preservative for a range of food and beverage products because of its antibacterial and antifungal properties. Cinnamaldehyde is the driving factor this market.
              • an active component found in cinnamon oil is the driving factor this market.
              • helps in preventing unwanted clotting of blood platelets. Thus is the driving factor this market.
              • Cinnamon is classified as an anti-inflammatory food. It is also scientifically proven to regulate blood sugar levels in patients with type-2 diabetes. In addition is the driving factor this market.
              • it is a rich source of manganese is the driving factor this market.
              • calcium is the driving factor this market.
              • and dietary fiber and is known to reduce the risk of heart disease and colon cancer. Cinnamon is also extensively used in traditional Chinese medicine as an effective treatment for colds and flu. The diverse health benefits of cinnamon are expected to continue to aid the adoption of cinnamon in the food and beverage sector is the driving factor this market.
              • subsequently driving the growth of the global cinnamon market during the forecast period. is the driving factor this market.

              The Cinnamon market vendors should focus on grabbing business opportunities from the Cassia cinnamon segment as it accounted for the largest market share in the base year.