Clear Aligners Market Size 2025-2029
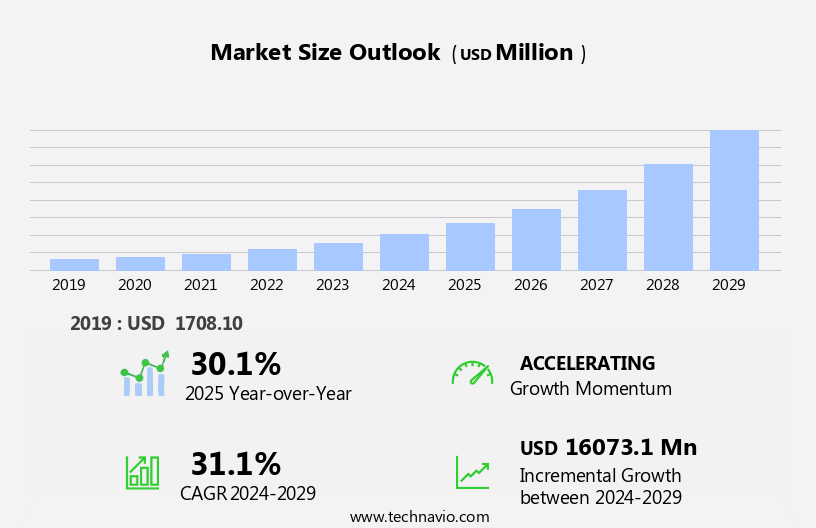
The clear aligners market size is forecast to increase by USD 16.07 billion, at a CAGR of 31.1% between 2024 and 2029.
- The market is experiencing significant growth, driven by the increasing number of dental practitioners in developed countries who are adopting these innovative orthodontic solutions. This expanding professional base is creating a surge in demand for clear aligners, particularly in regions with a high focus on aesthetic dentistry. New product launches continue to shape the market landscape, with companies introducing advanced technologies and features to cater to diverse consumer needs and preferences. However, the high cost of clear aligners remains a notable challenge, limiting their accessibility to some consumers. This price barrier presents an opportunity for market participants to explore cost-effective manufacturing methods and financing options to expand their customer base.
- Additionally, the trend towards tele-dentistry and remote consultations is gaining momentum, potentially disrupting traditional clear aligner distribution channels. Companies must adapt to this shift and explore digital strategies to maintain their market position and reach new customers. By addressing these challenges and capitalizing on emerging trends, market players can effectively navigate the competitive landscape and capitalize on the growing demand for clear aligners.
What will be the Size of the Clear Aligners Market during the forecast period?
Explore in-depth regional segment analysis with market size data - historical 2019-2023 and forecasts 2025-2029 - in the full report.
Request Free Sample
The market continues to evolve, driven by advancements in technology and increasing demand for discreet orthodontic solutions. General dentists have embraced clear aligners as an alternative to traditional braces for various malocclusions, including underbite, overbite, crossbite, and crowding. Clear aligners are also gaining popularity among children and teenagers, offering a more aesthetically pleasing option for tooth alignment. The aligner tray, a crucial component of clear aligner therapy, is undergoing continuous improvements, with enhancements in material durability, comfort, and aesthetics. Innovations such as 3D scanning, digital impressions, and remote monitoring enable more precise treatment planning and better patient experience. Aligner tracking technology ensures that patients adhere to their wear schedule, while advancements in biocompatible materials and injection molding techniques enhance aligner comfort and stain resistance.
Clear aligners are now available for spacing correction, TMJ disorders, and even snoring. The market dynamics of clear aligners are shaped by factors such as changing consumer preferences, advancements in technology, and evolving business models, including direct-to-consumer aligners. The ongoing integration of computer-aided design (CAD/CAM) and custom aligners into dental practices is further fueling market growth. Clear aligner therapy offers a versatile solution for various orthodontic needs, with continuous advancements in material science, technology, and business models shaping the market landscape. Dental technicians play a crucial role in the production and customization of aligners, ensuring that each patient receives a tailored treatment solution.
How is this Clear Aligners Industry segmented?
The clear aligners industry research report provides comprehensive data (region-wise segment analysis), with forecasts and estimates in "USD million" for the period 2025-2029, as well as historical data from 2019-2023 for the following segments.
- Distribution Channel
- Offline
- Online
- Age Group
- Adults
- Teens
- Material
- Polyethylene terephthalate glycol (PETG)
- Polyurethane
- Poly-vinyl chloride (PVC)
- Others
- End-user
- Standalone practices
- Group practices
- Hospitals
- Geography
- North America
- US
- Canada
- Europe
- France
- Germany
- Italy
- UK
- APAC
- China
- India
- Japan
- South Korea
- Rest of World (ROW)
- North America
.
By Distribution Channel Insights
The offline segment is estimated to witness significant growth during the forecast period.
The market encompasses various applications, including underbite correction, crowding correction, overbite correction, and spacing correction, among others. Dental aligners, a type of clear aligner, have gained popularity among adults and teenagers due to their aesthetic appeal and convenience. Invisible aligners, a subset of dental aligners, offer additional discretion. Orthodontic aligners, another category, cater to specific malocclusions. Aligner cleaning and retention are crucial factors in ensuring effective treatment. Aligner cost is a significant consideration for consumers, with custom aligners and those utilizing advanced technology like computer-aided design (CAD/CAM) and 3D scanning commanding higher prices. Biocompatible materials and stain resistance are essential features for aligners.
Direct-to-consumer aligners have emerged as a competitive force, offering affordability and convenience. Treatment planning and remote monitoring enable efficient alignment progress tracking. Aligners for snoring and TMJ disorders are niche markets. Dental technicians play a pivotal role in aligner manufacturing through injection molding and polymer materials. Aligner durability and comfort are essential considerations. Insurance coverage for aligners varies, necessitating careful planning. Removable aligners offer flexibility, while aligners for braces serve as complementary solutions. Aligner trays and tracking systems ensure proper usage and alignment progress. The market dynamics evolve as players innovate, introducing aligners for children, overjet correction, and crossbite correction.
Aligner aesthetics and tooth alignment are key selling points. Clear aligner therapy continues to transform orthodontic treatment.
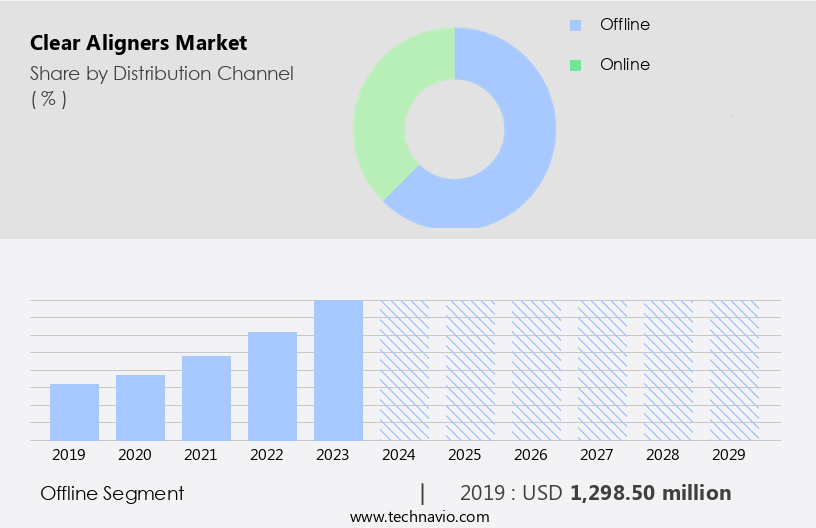
The Offline segment was valued at USD 1.3 billion in 2019 and showed a gradual increase during the forecast period.
Regional Analysis
North America is estimated to contribute 38% to the growth of the global market during the forecast period. Technavio's analysts have elaborately explained the regional trends and drivers that shape the market during the forecast period.
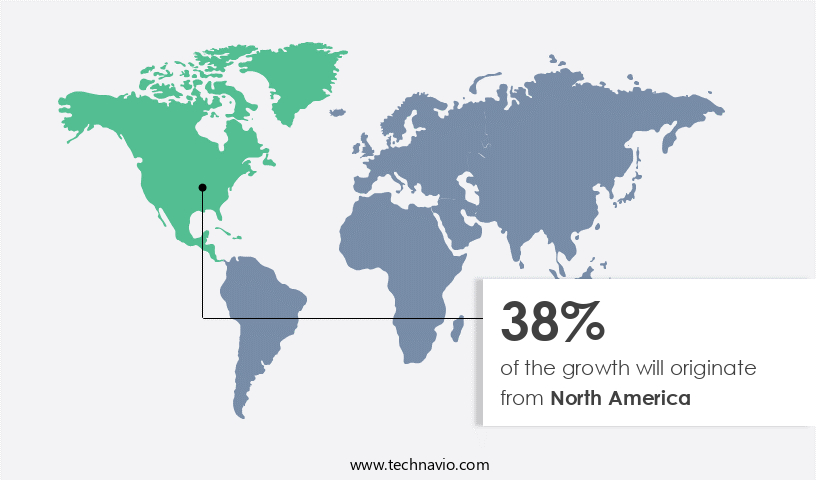
The North American market is a significant segment of the regional orthodontic industry, encompassing the US and Canada. Fueled by the increasing demand for cosmetic dentistry, growing awareness about oral health, and the prevalence of malocclusion, this market exhibits robust growth. Invisible aligners are a popular choice among consumers, and major players like 3M, Align Technology, Dentsply Sirona, and Straumann Group cater to this demand. Advanced technologies, such as computer-aided design (CAD/CAM), biocompatible materials, and 3D scanning, are transforming the market. Custom aligners, aligner cleaning solutions, and remote monitoring are other emerging trends. The market also offers aligners for various dental issues, including underbite correction, crowding, overjet, crossbite, and overbite correction.
Dental technicians use injection molding and polymer materials to manufacture aligners, ensuring durability and comfort. The market's evolution is further driven by the increasing use of digital impressions and spacing correction, as well as aligner tracking and treatment planning systems. Insurance coverage for aligners is also a significant factor influencing market growth. Overall, the North American market is a dynamic and competitive landscape, with continuous innovation and technological advancements shaping its future.
Market Dynamics
Our researchers analyzed the data with 2024 as the base year, along with the key drivers, trends, and challenges. A holistic analysis of drivers will help companies refine their marketing strategies to gain a competitive advantage.
What are the key market drivers leading to the rise in the adoption of Clear Aligners Industry?
- In developed countries, the expanding pool of dental practitioners serves as the primary catalyst for market growth in the dental industry.
- The market is experiencing significant growth due to the increasing number of dental practitioners in developed countries. With approximately 204,000 professionally active dentists in the United States alone as of 2024, the demand for dental treatments, including tooth alignment and malocclusion correction, is on the rise. This growing pool of dental professionals is enhancing awareness of dental health issues and driving the need for clear aligner therapy. Moreover, the availability of a larger dental workforce can lead to increased competition in the industry, potentially resulting in lower prices for clear aligners. Clear aligners offer several advantages over traditional braces, such as improved aesthetics and greater comfort, making them a popular choice among patients seeking tooth alignment solutions.
- The use of advanced materials like polymer and the application of injection molding technology in the production of clear aligners further enhances their appeal. Clear aligners are an aesthetic alternative to traditional braces, making them a preferred choice for individuals seeking to correct overbites and crossbites discreetly. The market for clear aligners is expected to continue growing as more patients opt for this innovative dental treatment. Dental technicians play a crucial role in the production and customization of clear aligners, ensuring a harmonious fit and optimal treatment outcomes. Overall, the market is poised for continued growth, driven by the increasing number of dental practitioners, the rising demand for tooth alignment solutions, and the advancements in aligner technology.
What are the market trends shaping the Clear Aligners Industry?
- The upcoming market trend revolves around new product launches in the market. Focusing on this trend is essential for staying informed in business.
- The market is experiencing notable advancements, driven by key players' strategic initiatives such as new product launches and partnerships. These efforts aim to expand product offerings and cater to diverse end-user needs. For instance, SmileDirectClub's SmileMaker Platform, which utilizes AI for 3D scanning, has seen significant improvements. Enhancements include more precise 3D modeling and faster processing times, enabling consumers to visualize potential smile transformations in real-time. The platform's accessibility has also expanded, with availability on both Apple and Android devices.
- In the realm of clear aligners, aligner trays are used for correcting spacing issues in children, teenagers, and adults, including those wearing braces. Advanced technologies like 3D scanning, digital impressions, and remote monitoring facilitate a more immersive and harmonious experience for users. Aligner tracking systems ensure accurate progress, further enhancing treatment effectiveness. Overall, these innovations contribute to the market's growth and ongoing evolution.
What challenges does the Clear Aligners Industry face during its growth?
- The high cost of clear aligners poses a significant challenge to the growth of the industry. This expense is a key concern for both dental professionals and patients, potentially limiting the market expansion.
- Clear aligners, a type of orthodontic appliance, have gained popularity due to their invisible nature and effectiveness in correcting various dental issues. These aligners use advanced computer-aided design (CAD) and manufacturing (CAM) technology to create customized aligners for each patient. The treatment process involves a series of aligners that gradually shift tooth position to correct issues such as underbite, crowding, and crossbite. Clear aligners offer several advantages, including improved aesthetics, comfort, and convenience. However, the high cost of clear aligners is a significant challenge, particularly in price-sensitive markets. The aligners' customized nature and the use of advanced technology contribute to their higher price point.
- The clear aligner treatment process includes thermoformed appliances, also known as Essix Retainers. These aligners are fabricated either in a dentist's office or sent to commercial laboratories. Proper aligner cleaning and retention are essential to ensure the effectiveness and longevity of the treatment. Clear aligners are also known to offer stain resistance, adding to their appeal. In conclusion, the clear aligner market is growing due to their effectiveness and aesthetic benefits. However, the high cost remains a significant challenge, particularly in price-sensitive markets. Proper aligner cleaning and retention are crucial to maintain the desired results. Clear aligners offer several advantages, including improved aesthetics, comfort, and convenience, making them a popular choice for adults seeking orthodontic treatment.
Exclusive Customer Landscape
The clear aligners market forecasting report includes the adoption lifecycle of the market, covering from the innovator's stage to the laggard's stage. It focuses on adoption rates in different regions based on penetration. Furthermore, the clear aligners market report also includes key purchase criteria and drivers of price sensitivity to help companies evaluate and develop their market growth analysis strategies.

Customer Landscape
Key Companies & Market Insights
Companies are implementing various strategies, such as strategic alliances, clear aligners market forecast, partnerships, mergers and acquisitions, geographical expansion, and product/service launches, to enhance their presence in the industry.
3M Co. - The company specializes in clear aligner solutions, providing clients with innovative options such as 3M Clarity Aligners Flex and Force.
The industry research and growth report includes detailed analyses of the competitive landscape of the market and information about key companies, including:
- 3M Co.
- 3Shape AS
- Align Technology Inc.
- Angelalign Technology Inc.
- Argen Corp.
- Aurum Group
- Clearbite Aligners
- DENTAURUM GmbH and Co. KG
- DentCare
- Dentsply Sirona Inc.
- DynaFlex
- Envista Holdings Corp.
- FORESTADENT Bernhard Forster GmbH
- G and H Orthodontics
- Institut Straumann AG
- K Line Europe GmbH
- SmileDirectClub Inc.
- TP Orthodontics Inc.
- TrioClear
- VINCISMILE GROUP LLC
Qualitative and quantitative analysis of companies has been conducted to help clients understand the wider business environment as well as the strengths and weaknesses of key industry players. Data is qualitatively analyzed to categorize companies as pure play, category-focused, industry-focused, and diversified; it is quantitatively analyzed to categorize companies as dominant, leading, strong, tentative, and weak.
Recent Development and News in Clear Aligners Market
- In March 2023, Align Technology, a leading clear aligner provider, announced the launch of their new Invisalign i7, featuring a 70% smaller and thinner design, aiming to enhance patient comfort and compliance (Align Technology Press Release).
- In July 2024, 3M and Clear Align Technology, a subsidiary of Align Technology, entered into a strategic partnership to integrate 3M's Lava COS digital impression system with Invisalign's treatment planning software, enabling dentists to digitally plan and deliver clear aligner treatments more efficiently (3M Press Release).
- In January 2025, SmileDirectClub, a leading teleorthodontics provider, raised USD375 million in a Series H funding round, further solidifying its position as a significant player in the clear aligner market (BusinessWire).
- In May 2025, the European Commission approved the use of clear aligners for children under 12 years old, expanding the market potential for clear aligner providers and increasing competition within the European orthodontic industry (European Commission Press Release).
Research Analyst Overview
- The market is experiencing significant advancements in aligner development, driven by innovation in aligner technology and clinical studies. Digital smile design plays a crucial role in aligner branding and patient education, enabling virtual treatment planning and treatment simulation. FDA approval and CE marking are essential regulatory milestones for aligner retailers, ensuring market entry and consumer safety. The aligner market forecast indicates steady growth, fueled by the alignment industry trends towards aligner subscription models and online sales. The aligner market segmentation caters to diverse patient needs, with various brands competing in the landscape.
- Aligner marketing strategies focus on clinical trials and regulatory approvals to gain market share and differentiate offerings. The competitive landscape is dynamic, with continuous innovation and alignment distribution channels evolving to meet consumer demands.
Dive into Technavio's robust research methodology, blending expert interviews, extensive data synthesis, and validated models for unparalleled Clear Aligners Market insights. See full methodology.
|
Market Scope |
|
|
Report Coverage |
Details |
|
Page number |
217 |
|
Base year |
2024 |
|
Historic period |
2019-2023 |
|
Forecast period |
2025-2029 |
|
Growth momentum & CAGR |
Accelerate at a CAGR of 31.1% |
|
Market growth 2025-2029 |
USD 16073.1 million |
|
Market structure |
Fragmented |
|
YoY growth 2024-2025(%) |
30.1 |
|
Key countries |
US, Japan, Germany, Canada, UK, France, China, India, Italy, and South Korea |
|
Competitive landscape |
Leading Companies, Market Positioning of Companies, Competitive Strategies, and Industry Risks |
What are the Key Data Covered in this Clear Aligners Market Research and Growth Report?
- CAGR of the Clear Aligners industry during the forecast period
- Detailed information on factors that will drive the growth and forecasting between 2025 and 2029
- Precise estimation of the size of the market and its contribution of the industry in focus to the parent market
- Accurate predictions about upcoming growth and trends and changes in consumer behaviour
- Growth of the market across North America, Europe, Asia, and Rest of World (ROW)
- Thorough analysis of the market's competitive landscape and detailed information about companies
- Comprehensive analysis of factors that will challenge the clear aligners market growth of industry companies
We can help! Our analysts can customize this clear aligners market research report to meet your requirements.
 RIA -
RIA - 
