
Climate Risk Analytics Platforms Market Size and Growth Forecast 2026-2030
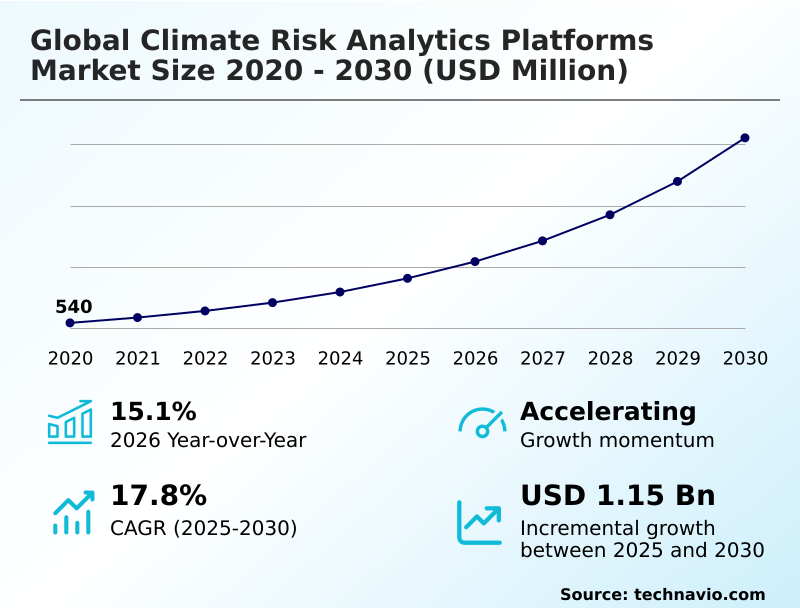
The Climate Risk Analytics Platforms Market size was valued at USD 904.6 million in 2025 growing at a CAGR of 17.8% during the forecast period 2026-2030.
North America accounts for 32.2% of incremental growth during the forecast period. The Solutions segment by Component was valued at USD 516.5 million in 2024, while the Cloud segment holds the largest revenue share by Deployment.
The market is projected to grow by USD 1.51 billion from 2020 to 2030, with USD 1.15 billion of the growth expected during the forecast period of 2025 to 2030.
Get Key Insights on Market Forecast (PDF) Request Free Sample
Climate Risk Analytics Platforms Market Overview
The climate risk analytics platforms market is defined by the critical need to translate complex environmental data into actionable financial intelligence. With North America accounting for over 32% of the market's incremental growth, adoption is accelerating, driven by regulations like the SEC's climate disclosure rules. These platforms utilize high-performance computing and forward-looking simulations for both physical climate risk assessment and transition risk assessment. For instance, a coastal insurer uses a platform's predictive climate modeling and geospatial data analytics to refine underwriting for properties in flood-prone zones, integrating asset-level risk assessment to price policies more accurately and manage portfolio exposure. This involves sophisticated environmental data processing to model potential losses from storm surges. The market's evolution is marked by advancements in AI-powered carbon footprint accounting and supply chain resilience mapping, moving beyond compliance to become a central pillar of strategic planning. This shift is crucial as firms seek tools for net-zero transition planning and vulnerability assessment tools to protect long-term value against climate volatility and ensure robust regulatory compliance reporting.
Drivers, Trends, and Challenges in the Climate Risk Analytics Platforms Market
The increasing sophistication of the market is evident in the demand for specialized applications like climate risk modeling for real estate portfolios, where granular geospatial data for hyper-local climate models is essential. Mandatory disclosure rules, such as the EU's Corporate Sustainability Reporting Directive (CSRD), compel organizations to perform detailed regulatory reporting for tcfd and csrd.
This goes beyond simple emissions tracking, requiring comprehensive supply chain climate vulnerability analysis and forward-looking scenarios for portfolio stress testing. An operational scenario involves a multinational agribusiness using agricultural yield forecasting with climate data to adjust its insurance coverage and hedge against losses from drought, a practice supported by platforms offering insurance underwriting with climate-adjusted models.
The financial services sector is a primary adopter, using these tools for everything from climate risk analytics for financial services to real estate climate risk and valuation. North America's contribution to incremental growth, which is approximately 4% higher than Europe's, highlights the region's focus on physical risk assessment for infrastructure assets.
As the energy sector navigates its shift, transition risk modeling for energy companies and stranded asset analysis for fossil fuels have become critical. The market is also seeing growth in tools for integrating biodiversity metrics in risk analysis and addressing emerging legal threats through climate litigation and liability risk forecasting.
This holistic approach, including ai-powered carbon footprint accounting and net-zero transition pathway modeling, demonstrates the market's maturity.
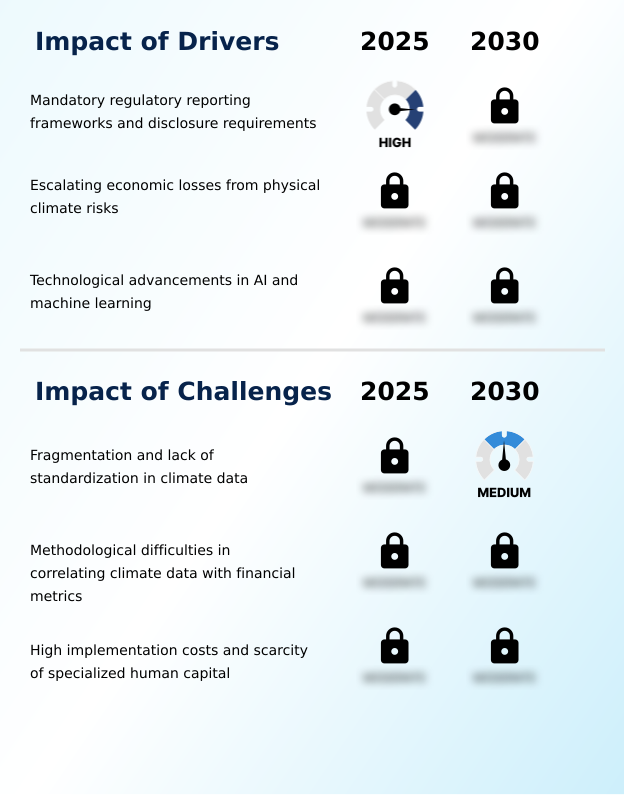
Primary Growth Driver: The implementation of mandatory regulatory reporting frameworks and stringent disclosure requirements is a key driver for market expansion.
The market's accelerating growth momentum is primarily propelled by mandatory regulatory frameworks, which have transformed climate risk into a core financial and legal obligation.
Escalating economic losses from extreme weather events are another powerful driver, forcing industries like insurance and banking to adopt forward-looking simulations over traditional actuarial models for underwriting process automation and credit risk modeling.
Technological advancements, particularly the integration of AI-powered carbon footprint accounting and machine learning, are enhancing the capabilities of these platforms, enabling the rapid analysis of massive datasets from meteorological models.
This allows for granular predictive climate modeling, making sophisticated analytics more accessible and driving adoption across diverse sectors seeking to build resilience and safeguard investments against environmental volatility.
Emerging Market Trend: The integration of biodiversity and natural capital metrics into risk frameworks is an emerging trend, reflecting a more holistic approach to environmental risk assessment.
Market evolution is accelerating, with the APAC region's growth projected to be the fastest, driven by the need to secure complex global supply chains. A key trend is the convergence of climate data with biodiversity impact metrics, moving beyond carbon to a holistic environmental intelligence model as required by emerging TNFD frameworks.
Advancements in digital twin technology are enabling hyper-local infrastructure assessment, allowing for high-fidelity simulations of physical asset vulnerabilities to specific weather events. For instance, a real estate firm can model the precise impact of a flood on a commercial property.
Concurrently, the rise of climate litigation risk modeling is a significant development, with platforms now incorporating legal databases to help firms quantify liability exposure, a critical component of sustainable finance frameworks.
Key Industry Challenge: Data fragmentation and a lack of standardization across global climate data sources present a significant challenge to the industry's growth.
A primary market restraint is the fragmentation and lack of standardization in climate data, complicating efforts to provide consistent vulnerability assessment tools on a global scale. This issue is compounded by methodological difficulties in correlating long-term climate projections with short-term financial metrics, a factor contributing to a neutral price sensitivity among many buyers who remain skeptical of model outputs.
Furthermore, high implementation costs and a scarcity of specialized talent create significant barriers, particularly for smaller enterprises.
The complexity of platforms for tasks like carbon tax impact analysis and stranded asset risk modeling requires a deep expertise in both climate science and finance, a skill set that remains in short supply, thus hindering widespread adoption and the effective use of ESG data solutions.
Explore Full Market Dynamics Analysis Request Free Sample
Climate Risk Analytics Platforms Market Segmentation
The climate risk analytics platforms industry research report provides comprehensive data including region-wise segment analysis, with forecasts and analysis for the period 2026-2030, as well as historical data from 2020-2024 for the following segments.
Component Segment Analysis
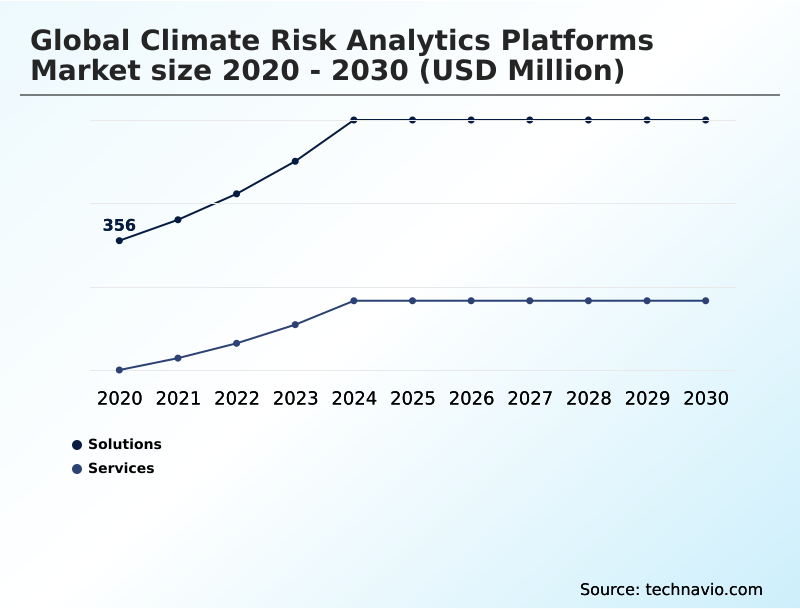
The solutions segment is estimated to witness significant growth during the forecast period.
The solutions segment is the core of the market, consisting of software platforms that enable organizations to manage environmental uncertainties. These platforms perform advanced geospatial data analytics and run complex climate scenario analysis to quantify both physical and transition risks.
Demand is driven by the need for asset-level risk assessment and regulatory compliance reporting under frameworks like CSRD.
The architecture leverages predictive climate modeling and machine learning to process vast environmental datasets, translating scientific inputs into actionable financial metrics through financial intelligence integration.
These vulnerability assessment tools are critical for banking and insurance, with the segment projected to constitute USD 587.0 million of the market in 2025, enabling ESG data solutions for strategic decision-making.
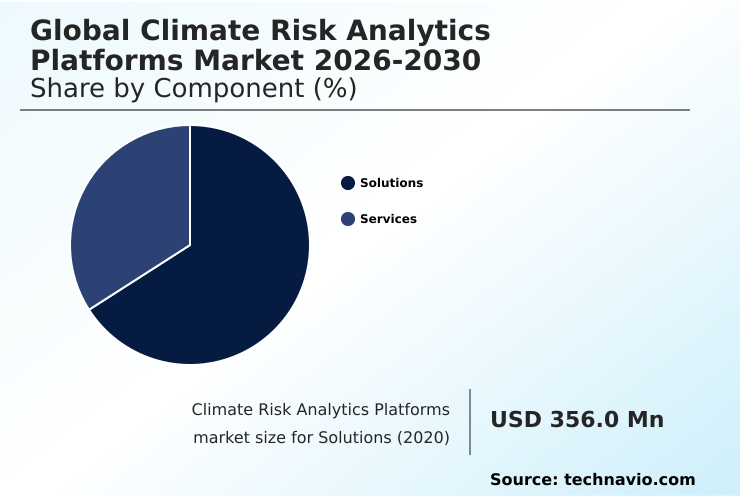
The Solutions segment was valued at USD 516.5 million in 2024 and showed a gradual increase during the forecast period.
Climate Risk Analytics Platforms Market by Region: North America Leads with 32.2% Growth Share
North America is estimated to contribute 32.2% to the growth of the global market during the forecast period.
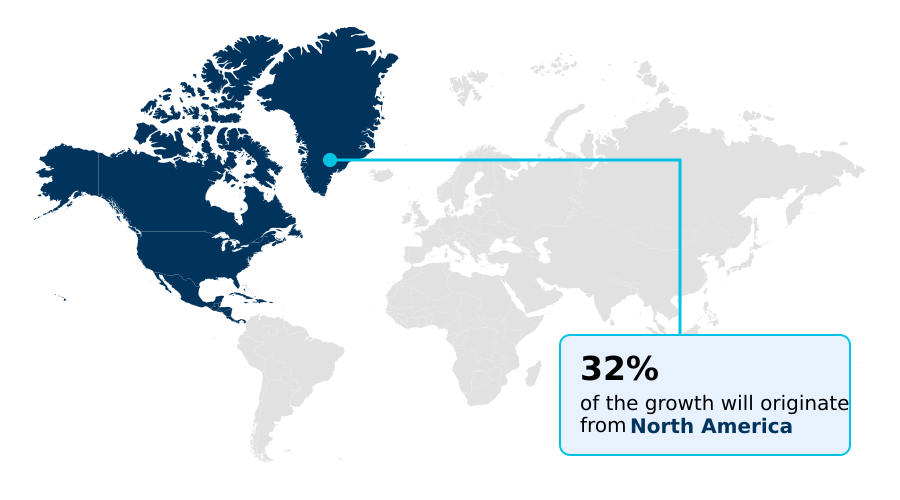
The geographic landscape is led by North America, contributing over 32% to market growth, where advanced financial intelligence integration is used by the financial services sector for portfolio temperature alignment.
Europe, accounting for nearly 28%, is driven by stringent regulations like the EU's CSRD, compelling firms to adopt tools for TCFD reporting automation and decarbonization pathway tools.
The APAC region, with a growth contribution of almost 28%, focuses on physical hazard mapping and supply chain climate vulnerability analysis to protect its vast manufacturing and logistics networks from extreme weather events.
In these mature regions, the deployment of carbon accounting platforms is standard, while emerging markets in South America and the Middle East are increasingly adopting these technologies for sovereign risk analysis and water resource management, indicating a global move toward standardized climate stress testing.
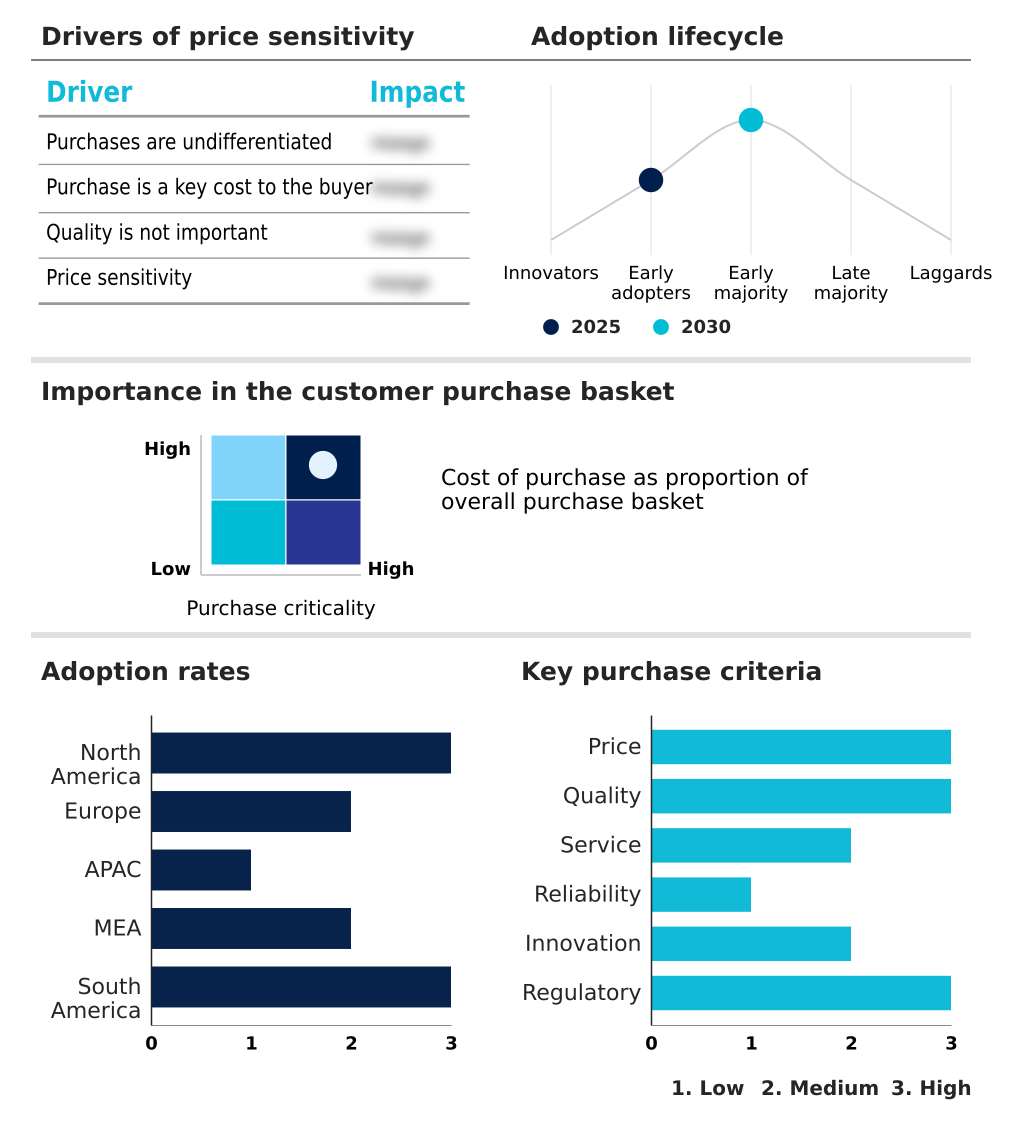
Customer Landscape Analysis for the Climate Risk Analytics Platforms Market
The climate risk analytics platforms market forecasting report includes the adoption lifecycle of the market, covering from the innovator’s stage to the laggard’s stage. It focuses on adoption rates in different regions based on penetration. Furthermore, the climate risk analytics platforms market report also includes key purchase criteria and drivers of price sensitivity to help companies evaluate and develop their market growth analysis strategies.
Competitive Landscape of the Climate Risk Analytics Platforms Market
Companies are implementing various strategies, such as strategic alliances, partnerships, mergers and acquisitions, geographical expansion, and product/service launches, to enhance their presence in the climate risk analytics platforms market industry.
Bloomberg LP - Provides integrated climate data, analytics, and financial market reporting tools, enabling data-driven risk management and regulatory compliance for institutional clients.
The industry research and growth report includes detailed analyses of the competitive landscape of the market and information about key companies, including:
- Bloomberg LP
- Climate X
- Deloitte Touche Tohmatsu Ltd.
- Ernst and Young Global Ltd.
- IBM Corp.
- Intercontinental Exchange Inc.
- Jupiter Intelligence. Inc
- KPMG International Ltd.
- Manifest Climate Inc.
- Microsoft Corp.
- Moodys Corp.
- Morningstar Inc.
- MSCI Inc.
- OneTrust LLC
- Persefoni AI Inc.
- PricewaterhouseCoopers LLP
- Risilience
- S and P Global Inc.
- Watershed Technology Inc.
- XDI Pty Ltd.
Qualitative and quantitative analysis of companies has been conducted to help clients understand the wider business environment as well as the strengths and weaknesses of key industry players. Data is qualitatively analyzed to categorize companies as pure play, category-focused, industry-focused, and diversified; it is quantitatively analyzed to categorize companies as dominant, leading, strong, tentative, and weak.
Recent Developments in the Climate Risk Analytics Platforms Market
- In January 2025, ISS STOXX launched a dedicated climate analytics platform for real assets, combining geospatial analytics and emissions data for portfolio-level climate stress testing.
- In March 2025, BMI expanded its ESG Country Risk platform to include long-term physical climate risk projections through 2050, enhancing sovereign and corporate risk analysis.
- In May 2025, Climate X entered a strategic partnership with 4most to deliver climate risk analytics solutions to banks across the Middle East, strengthening regional climate stress testing capabilities.
- In July 2025, Cytora integrated science-based physical risk data from Climatig into its underwriting platform to enhance automated risk triage and pricing accuracy for commercial insurers.
Research Analyst Overview: Climate Risk Analytics Platforms Market
With market-wide growth accelerating at a year-over-year rate of 15.1%, the boardroom-level imperative has shifted from compliance to strategic resilience. Mandates like the Task Force on Climate-related Financial Disclosures (TCFD) are no longer just a reporting exercise; they directly influence capital expenditure decisions.
Platforms now offer advanced climate scenario analysis and forward-looking simulations, allowing CFOs to quantify physical climate risk and transition risk assessment in financial terms. The integration of meteorological models with financial intelligence integration is critical. We see leading firms using digital twin technology for granular asset-level risk assessment on critical infrastructure.
This evolution in environmental data processing is driven by high-performance computing, enabling precise carbon footprint measurement and effective net-zero transition planning. Tools for supply chain resilience mapping and climate litigation risk are now essential for comprehensive oversight, moving beyond simple ESG metrics to a fully integrated risk management approach utilizing automated risk alerts and vulnerability assessment tools.
Dive into Technavio’s robust research methodology, blending expert interviews, extensive data synthesis, and validated models for unparalleled Climate Risk Analytics Platforms Market insights. See full methodology.
| Market Scope | |
|---|---|
| Page number | 293 |
| Base year | 2025 |
| Historic period | 2020-2024 |
| Forecast period | 2026-2030 |
| Growth momentum & CAGR | Accelerate at a CAGR of 17.8% |
| Market growth 2026-2030 | USD 1149.4 million |
| Market structure | Fragmented |
| YoY growth 2025-2026(%) | 15.1% |
| Key countries | US, Canada, Mexico, Germany, UK, France, Italy, The Netherlands, Spain, China, India, Japan, Australia, South Korea, Indonesia, Saudi Arabia, UAE, South Africa, Israel, Turkey, Brazil, Argentina and Colombia |
| Competitive landscape | Leading Companies, Market Positioning of Companies, Competitive Strategies, and Industry Risks |
Climate Risk Analytics Platforms Market: Key Questions Answered in This Report
-
What is the expected growth of the Climate Risk Analytics Platforms Market between 2026 and 2030?
-
The Climate Risk Analytics Platforms Market is expected to grow by USD 1.15 billion during 2026-2030, registering a CAGR of 17.8%. Year-over-year growth in 2026 is estimated at 15.1%%. This acceleration is shaped by mandatory regulatory reporting frameworks and disclosure requirements, which is intensifying demand across multiple end-use verticals covered in the report.
-
-
What segmentation does the market report cover?
-
The report is segmented by Component (Solutions, and Services), Deployment (Cloud, and On-premises), Type (Physical risks, and Transition risks) and Geography (North America, Europe, APAC, Middle East and Africa, South America). Among these, the Solutions segment is estimated to witness significant growth during the forecast period, driven by rising adoption across key application areas. Each segment includes detailed qualitative and quantitative analysis, along with historical data from 2020-2024 and forecasts through 2030 with year-over-year growth rates.
-
-
Which regions are analyzed in the report?
-
The report covers North America, Europe, APAC, Middle East and Africa and South America. North America is estimated to contribute 32.2% to market growth during the forecast period. Country-level analysis includes US, Canada, Mexico, Germany, UK, France, Italy, The Netherlands, Spain, China, India, Japan, Australia, South Korea, Indonesia, Saudi Arabia, UAE, South Africa, Israel, Turkey, Brazil, Argentina and Colombia, with dedicated market size tables and year-over-year growth for each.
-
-
What are the key growth drivers and market challenges?
-
The primary driver is mandatory regulatory reporting frameworks and disclosure requirements, which is accelerating investment and industry demand. The main challenge is fragmentation and lack of standardization in climate data, creating operational barriers for key market participants. The report quantifies the impact of each driver and challenge across 2026 and 2030 with comparative analysis.
-
-
Who are the major players in the Climate Risk Analytics Platforms Market?
-
Key vendors include Bloomberg LP, Climate X, Deloitte Touche Tohmatsu Ltd., Ernst and Young Global Ltd., IBM Corp., Intercontinental Exchange Inc., Jupiter Intelligence. Inc, KPMG International Ltd., Manifest Climate Inc., Microsoft Corp., Moodys Corp., Morningstar Inc., MSCI Inc., OneTrust LLC, Persefoni AI Inc., PricewaterhouseCoopers LLP, Risilience, S and P Global Inc., Watershed Technology Inc. and XDI Pty Ltd.. The report provides qualitative and quantitative analysis categorizing companies as dominant, leading, strong, tentative, and weak based on their market positioning. Company profiles include business segment analysis, SWOT assessment, key offerings, and recent strategic developments.
-
Climate Risk Analytics Platforms Market Research Insights
Market dynamics are increasingly shaped by the need for sophisticated corporate sustainability reporting, with solutions growing faster than services. Adherence to frameworks like the Taskforce on Nature-related Financial Disclosures (TNFD) is driving demand for platforms capable of integrating biodiversity data into financial risk frameworks.
Organizations are moving beyond basic compliance to proactive climate adaptation strategies, utilizing hyper-local infrastructure assessment to protect physical assets. For example, a real estate investment trust uses digital twin simulations for urban planning to stress-test a portfolio's resilience against future flood events, a critical component of real asset portfolio management.
This proactive stance reflects a deeper integration of ESG ratings integration into capital allocation decisions, making these platforms indispensable for modern enterprise risk management.
We can help! Our analysts can customize this climate risk analytics platforms market research report to meet your requirements.
 RIA -
RIA - 
