Coated Abrasives Market Analysis, Size, and Forecast 2025-2029: APAC (Australia, China, India, Japan, South Korea), Europe (Germany, UK), North America (US and Canada), South America (Brazil), and Middle East and Africa

Coated Abrasives Market Analysis, Size, and Forecast 2025-2029:
APAC (Australia, China, India, Japan, South Korea), Europe (Germany, UK), North America (US and Canada), South America (Brazil), and Middle East and Africa

Published: Apr 2025 263 Pages SKU: IRTNTR41355

Market Overview at a Glance

$4.70 B
Market Opportunity
5.8%
CAGR
5.3
YoY growth 2024-2025(%)

Coated Abrasives Market Size 2025-2029

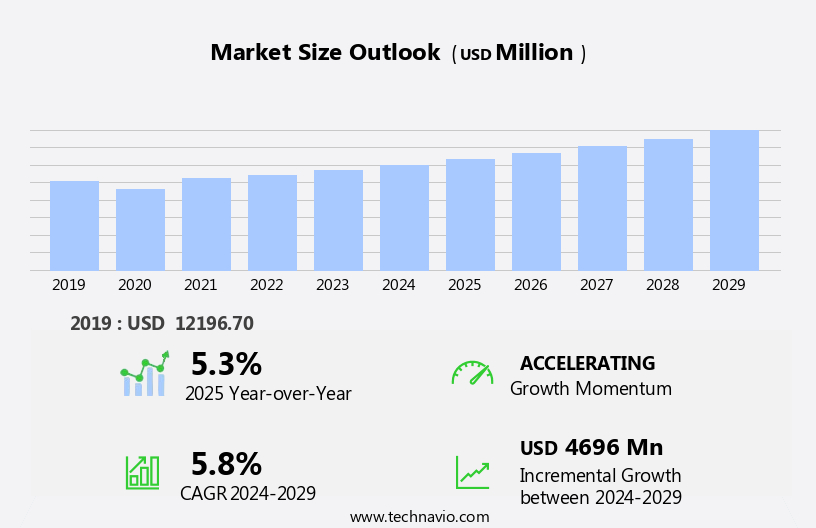
The coated abrasives market size is forecast to increase by USD 4.7 billion at a CAGR of 5.8% between 2024 and 2029.

  • The market is experiencing significant growth due to the increasing demand for pressure-sensitive adhesive (PSA)-backed coated abrasives.  This product type is gaining popularity due to its ease of use and versatility, making it a preferred choice for various applications in industries such as automotive, construction, and electronics. Another key trend influencing market growth is the emergence of China as a major consumer and producer. With its large population and rapidly developing industries, China's demand for coated abrasives is expected to continue growing. However, the market is not without challenges. Improper or inadequate storage of coated abrasives can lead to technical issues, such as product degradation and decreased performance.
  • As such, companies must prioritize effective storage solutions to ensure product quality and customer satisfaction. To capitalize on the growing demand and navigate the challenges, market participants must focus on innovation and operational efficiency. Developing new, high-performance coated abrasive products and implementing storage solutions will help companies differentiate themselves and maintain a competitive edge. Additionally, expanding into emerging markets, such as China, can provide significant growth opportunities. By addressing these trends and challenges, companies can effectively capitalize on the market's strategic landscape and position themselves for long-term success.

What will be the Size of the Coated Abrasives Market during the forecast period?

Coated Abrasives Market Size

 Request Free Sample

  • The market encompasses a wide range of products utilized in various surface finishing applications. These abrasives are characterized by their coated surfaces, which enhance their performance and versatility in material removal and polishing techniques. The market's sizeable growth is driven by the increasing demand for high-performance abrasives in industries such as automotive, construction, and aerospace. Key trends in the market include the development of advanced abrasives, such as nanotechnology-based abrasives, for improved efficiency and durability. Additionally, the market is witnessing the growing popularity of composite abrasives, which offer superior material removal rates and increased wear resistance. The manufacturing process of coated abrasives involves the application of a bonding agent to a base material, followed by the coating of abrasive particles.
  • In the consumer sector, applications include fiberglass and composite material manufacturing, as well as the production of electronic component units for mobile phones and other devices. Quality control measures, such as grit size and density specifications, are crucial to ensure consistent product performance. Coated abrasives come in various forms, including sheets, belts, discs, and powders, catering to diverse applications and equipment, such as sanding machines, grinding machines, and deburring machines. The market also offers a range of accessories and slurries for specialized applications. Effective disposal and recycling of coated abrasives are essential considerations for environmental sustainability and cost efficiency. Market dynamics are influenced by factors such as technological advancements, cost-effectiveness, and the growing trend towards customization and personalization in industries like automobile repair and furniture production.

How is this Coated Abrasives Industry segmented?

The coated abrasives industry research report provides comprehensive data (region-wise segment analysis), with forecasts and estimates in "USD million" for the period 2025-2029, as well as historical data from 2019-2023 for the following segments.

  • Grain Type
    • Aluminum oxide
    • Ceramic
    • Silicon carbide
    • Alumina zirconia
    • Others
  • Backing Material
    • Fiber
    • Paper
    • Cloth
    • Polyester
    • Others
  • Application
    • Transportation
    • Machinery
    • Metal fabrication
    • Consumer goods
    • Others
  • Product Type
    • Belts
    • Discs
    • Rolls
    • Sheets
    • Others
  • Geography
    • APAC
      • Australia
      • China
      • India
      • Japan
      • South Korea
    • Europe
      • Germany
      • UK
    • North America
      • US
      • Canada
    • South America
      • Brazil
    • Middle East and Africa

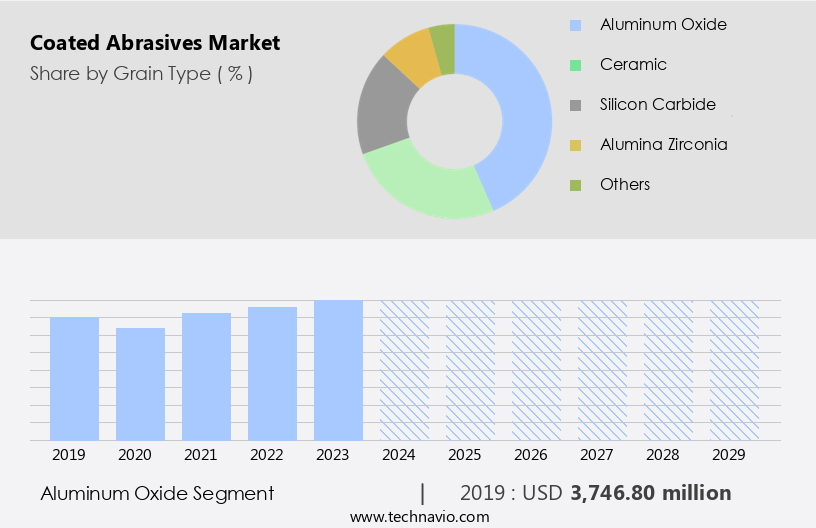
By Grain Type Insights

The aluminum oxide segment is estimated to witness significant growth during the forecast period. Coated abrasives, specifically those made with aluminum oxide grains, are essential in various industries for material removal and surface finishing applications. Aluminum oxide is a synthetic grain manufactured from bauxite through the fusing process. Its high toughness and durability make aluminum oxide-based coated abrasives popular choices for grinding, machine blasting, cutting operations, and refractory material production. However, the lack of a crystal structure in brown aluminum oxide, the most commonly used type, results in wear and the formation of rounded structures, reducing their cutting ability. To address this challenge, abrasive innovation and optimization have been key focus areas. Advanced abrasive technology, such as vitrified and resin bonds, has led to improved abrasive performance and longer abrasive life.

Precision grinding applications demand high-performance abrasives, leading to the development of eco-friendly abrasives, such as those with fiber or cloth backing, and the use of silicon carbide grains. Automated grinding processes, including robotic grinding, have streamlined industrial manufacturing and surface preparation. Abrasive selection, cutting speed, and abrasive maintenance are crucial factors in ensuring optimal abrasive application and surface finish quality. Abrasive recycling is another area of interest for sustainability-conscious businesses. The market for coated abrasives is diverse, with various abrasive materials, grains, and backing types catering to specific applications. As research and development efforts continue, the future of coated abrasives lies in advanced abrasive engineering, enhanced abrasive materials, and improved abrasive performance. Industries utilizing coated abrasives span pre-engineered buildings, agricultural, metal fabrication, electric cars and charging outlets, consumer electronics, industrial sector, paper, cloth, and more.

Coated Abrasives Market Size

Get a glance at the market report of share of various segments Request Free Sample

The Aluminum oxide segment was valued at USD 3.75 billion in 2019 and showed a gradual increase during the forecast period.

Regional Analysis

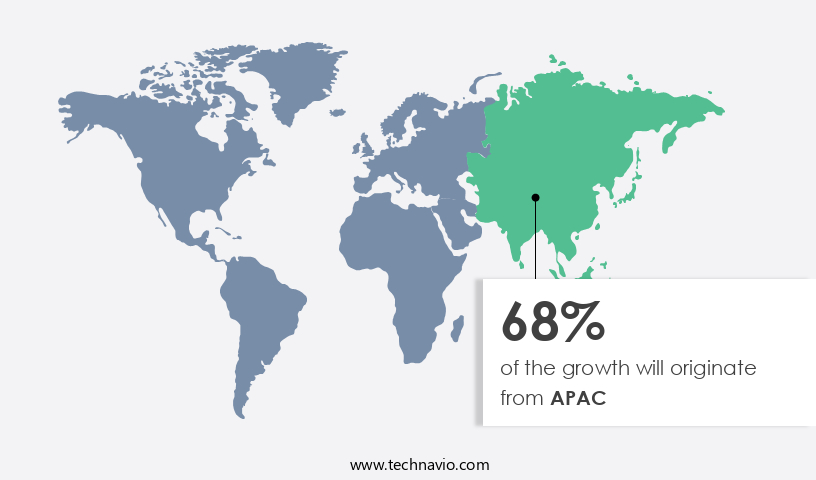
APAC is estimated to contribute 68% to the growth of the global market during the forecast period.Technavio's analysts have elaborately explained the regional trends and drivers that shape the market during the forecast period.

Coated Abrasives Market Share by Geography

For more insights on the market size of various regions, Request Free Sample

The market is driven by the increasing demand for material removal in various industries, particularly in APAC. This region led the market in 2024 and is expected to continue leading due to economic development in the Association of Southeast Asian Nations (ASEAN) countries and rising per capita income. Major contributors to the APAC market include China, Japan, Australia, and India. The region's rapid industrialization and expansion of manufacturing sectors, especially in automotive, electronics, and metalworking industries, fuel the demand for high-performance coated abrasives. Innovation and abrasive optimization are crucial factors in the market. Advanced abrasive technology, such as precision grinding, high-speed grinding, and automated grinding, is driving the market.

Various abrasive materials, including silicon carbide, aluminum oxide, and ceramic abrasives, are used based on the specific application and required surface finish quality. Sustainable abrasives, such as eco-friendly abrasives and abrasive recycling, are gaining popularity due to environmental concerns. Abrasive selection, cutting speed, and abrasive life are essential factors in abrasive application. Different abrasive grains, such as vitrified bond and resin bond, and various backing materials, including paper backing, fiber backing, and cloth backing, are used based on the specific application and required performance. Flap discs, sanding belts, rolls, and discs are the most common types of coated abrasives. Robotic grinding and sanding sheets are also gaining popularity in industrial manufacturing and surface finishing processes. Abrasive maintenance is crucial to ensure optimal performance and longevity.

Market Dynamics

Our researchers analyzed the data with 2024 as the base year, along with the key drivers, trends, and challenges. A holistic analysis of drivers will help companies refine their marketing strategies to gain a competitive advantage.

What are the key market drivers leading to the rise in the adoption of the Coated Abrasives Industry?

  • Growing demand for PSA-backed coated abrasives is the key driver of the market. Coated abrasives, which include sanding discs, rolls, and sheets, have become increasingly preferred due to the convenience they offer in their application. While cloth and paper continue to be widely used as backing materials, pressure-sensitive adhesives (PSA) are gaining traction. Companies like Saint Gobain and CUMI provide coated abrasives with PSA backing. These products find extensive use in various applications, such as blending welds and defects in auto body shops, removing paint and primer in auto refinish shops, and orbital sanding for finishing flat stock wood components.
  • The use of PSA-backed coated abrasives simplifies mounting on disc sanders, orbital sanders, and rotary sanders. These abrasives offer significant benefits, including protection from dust and moisture, as well as extended disc life. By utilizing PSA technology, coated abrasives ensure a more efficient and productive sanding process.

What are the market trends shaping the Coated Abrasives Industry?

  • Emergence of China as a major consumer and producer is the upcoming market trend. Coated abrasives have witnessed significant demand in recent years due to the economic and industrial growth in various regions, particularly China. In 2024, China accounted for over 20% of the market share, driven by its extensive raw material resources and advanced manufacturing technologies. The country's industrial sectors, such as electronics and automobile, have experienced substantial growth, leading to an increased need for coated abrasives.
  • Additionally, population growth and urbanization have further fueled market expansion. China's position as a leading producer and consumer of coated abrasives is expected to continue during the forecast period, as these factors continue to influence the industry's growth trajectory.

What challenges does the Coated Abrasives Industry face during its growth?

  • Improper or inadequate storage, causing technical issues, is a key challenge affecting the industry's growth. Coated abrasives are essential industrial materials that require proper handling to maintain their effectiveness. Improper storage can lead to technical challenges such as weakened bonds, curling, brittleness, and breakages. Changes in temperature and humidity significantly impact coated abrasives, causing adhesive bonds to soften or become excessively dry.
  • This reduces flexibility and distorts the product, leading to defects like cupping. Two common types of cupping defects caused by humidity are concave and convex cupping. Proper material handling and storage conditions are crucial to prevent these issues and ensure the longevity and efficiency of coated abrasives.

Exclusive Customer Landscape

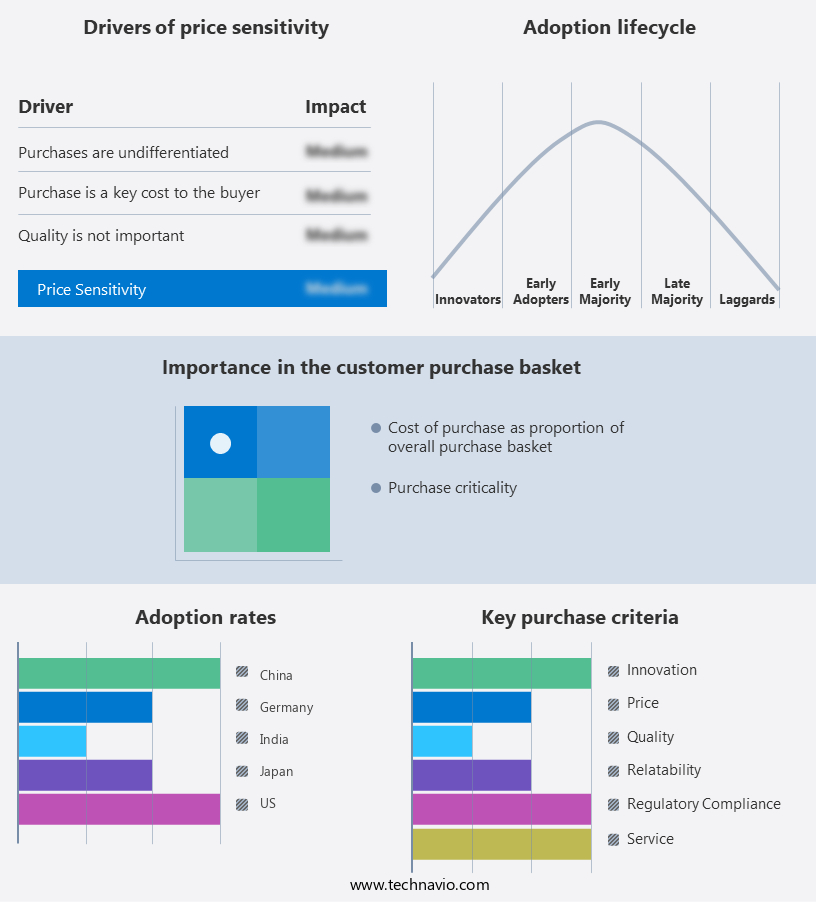
The coated abrasives market forecasting report includes the adoption lifecycle of the market, covering from the innovator's stage to the laggard's stage. It focuses on adoption rates in different regions based on penetration. Furthermore, the coated abrasives market report also includes key purchase criteria and drivers of price sensitivity to help companies evaluate and develop their market growth analysis strategies.

Coated Abrasives Market Share by Geography

 Customer Landscape

Key Companies & Market Insights

Companies are implementing various strategies, such as strategic alliances, coated abrasives market forecast, partnerships, mergers and acquisitions, geographical expansion, and product/service launches, to enhance their presence in the industry.

3M Co. - The company offers coated abrasives in various shapes such as belts, brushes, discs, sheets and rolls, wheels, and handheld abrasives.

The industry research and growth report includes detailed analyses of the competitive landscape of the market and information about key companies, including:

  • 3M Co.
  • Ammega Group BV
  • Arc Abrasives Inc.
  • BARTON International
  • Compagnie de Saint-Gobain SA
  • DEERFOS Co. Ltd.
  • Fandeli International Corp.
  • Gemtex Abrasives
  • Hermes Schleifmittel GmbH
  • Jiangsu Sanling Abrasive Co. Ltd.
  • Johnson Abrasives Co. Inc.
  • KLINGSPOR AG
  • Mirka Ltd.
  • Murugappa Group
  • Napoleon Abrasives S.p.a.
  • Robert Bosch GmbH
  • SAK ABRASIVES Ltd.
  • Swajit Abrasives Pvt. Ltd.
  • VSM AG
  • WEEM Abrasives

Qualitative and quantitative analysis of companies has been conducted to help clients understand the wider business environment as well as the strengths and weaknesses of key industry players. Data is qualitatively analyzed to categorize companies as pure play, category-focused, industry-focused, and diversified; it is quantitatively analyzed to categorize companies as dominant, leading, strong, tentative, and weak.

Research Analyst Overview

The market encompasses a diverse range of products utilized in various industries for material removal and surface finishing applications. These abrasives come in different forms, including grinding wheels, flap discs, sanding belts, and rolls, among others. The market is driven by the ever-evolving demands of industrial manufacturing, where precision and efficiency are paramount. Abrasive optimization and innovation continue to shape the market, as manufacturers seek to improve performance and extend abrasive life. Abrasive technology has advanced significantly, with developments in bonding materials, such as vitrified and resin, and abrasive grains, including silicon carbide and aluminum oxide.

The selection of the appropriate abrasive for a specific application is crucial for achieving optimal cutting speed and surface finish quality. Factors such as the material being ground, the required surface finish, and the grinding process itself all influence abrasive choice. Sustainability is a growing concern in the market, with eco-friendly abrasives gaining popularity. These abrasives are engineered to minimize waste and reduce environmental impact, making them an attractive option for manufacturers seeking to improve their sustainability credentials. Automated grinding processes, such as robotic grinding, have become increasingly common in industrial manufacturing. These processes offer improved consistency, increased productivity, and reduced labor costs.

However, the coated abrasives market is a significant segment of the broader abrasives industry, encompassing various types of abrasive products used in surface finishing techniques and grinding operations. These include abrasive belts for sanding applications such as abrasive belt sanding, disc sanding, and flap disc sanding, as well as sheet sanding, roll sanding, and blending operations.Coated abrasives come in various forms, including abrasive films, powders, slurries, pastes, and fluids. Abrasive grain size, density, hardness, wear resistance, durability, and efficiency are crucial factors determining their performance and application suitability.

Grinding processes, deburring, and surface finish measurement are primary applications for coated abrasives. Advanced technologies like nanotechnology abrasives and abrasive coatings have revolutionized the market, offering enhanced properties and improved efficiency. Manufacturing processes, quality control, safety standards, disposal, and certification are essential aspects of the coated abrasives industry. Abrasive equipment, polishing machines, tools, accessories, and consumables are essential components of the value chain. Stay updated with the latest news, events, training, and certification opportunities in the coated abrasives market through reputable suppliers and industry associations.

Market Scope

Report Coverage

Details

Page number

263

Base year

2024

Historic period

2019-2023

Forecast period

2025-2029

Growth momentum & CAGR

Accelerate at a CAGR of 5.8%

Market growth 2025-2029

USD 4.69 Billion

Market structure

Fragmented

YoY growth 2024-2025(%)

5.3

Key countries

China, Japan, India, US, South Korea, Australia, Germany, UK, Brazil, and Canada

Competitive landscape

Leading Companies, Market Positioning of Companies, Competitive Strategies, and Industry Risks

Request Free Sample

What are the Key Data Covered in this Coated Abrasives Market Research and Growth Report?

  • CAGR of the Coated Abrasives industry during the forecast period
  • Detailed information on factors that will drive the growth and forecasting between 2025 and 2029
  • Precise estimation of the size of the market and its contribution of the industry in focus to the parent market
  • Accurate predictions about upcoming growth and trends and changes in consumer behaviour
  • Growth of the market across APAC, Europe, North America, South America, and Middle East and Africa
  • Thorough analysis of the market's competitive landscape and detailed information about companies
  • Comprehensive analysis of factors that will challenge the coated abrasives market growth and forecasting

We can help! Our analysts can customize this coated abrasives market research report to meet your requirements.

Get in touch

1 Executive Summary

  • 1.1 Market overview
    • Executive Summary - Chart on Market Overview
    • Executive Summary - Data Table on Market Overview
    • Executive Summary - Chart on Global Market Characteristics
    • Executive Summary - Chart on Market by Geography
    • Executive Summary - Chart on Market Segmentation by Grain Type
    • Executive Summary - Chart on Market Segmentation by Backing Material
    • Executive Summary - Chart on Market Segmentation by Application
    • Executive Summary - Chart on Market Segmentation by Product Type
    • Executive Summary - Chart on Incremental Growth
    • Executive Summary - Data Table on Incremental Growth
    • Executive Summary - Chart on Company Market Positioning

2 Technavio Analysis

  • 2.1 Analysis of price sensitivity, lifecycle, customer purchase basket, adoption rates, and purchase criteria
    • Analysis of price sensitivity, lifecycle, customer purchase basket, adoption rates, and purchase criteria
  • 2.2 Criticality of inputs and Factors of differentiation
    • Overview on criticality of inputs and factors of differentiation
  • 2.3 Factors of disruption
    • Overview on factors of disruption
  • 2.4 Impact of drivers and challenges
    • Impact of drivers and challenges in 2024 and 2029

3 Market Landscape

  • 3.1 Market ecosystem
    • Parent Market
    • Data Table on - Parent Market
  • 3.2 Market characteristics
    • Market characteristics analysis
  • 3.3 Value chain analysis
    • Value chain analysis

4 Market Sizing

  • 4.1 Market definition
    • Offerings of companies included in the market definition
  • 4.2 Market segment analysis
    • Market segments
  • 4.3 Market size 2024
    • 4.4 Market outlook: Forecast for 2024-2029
      • Chart on Global - Market size and forecast 2024-2029 ($ million)
      • Data Table on Global - Market size and forecast 2024-2029 ($ million)
      • Chart on Global Market: Year-over-year growth 2024-2029 (%)
      • Data Table on Global Market: Year-over-year growth 2024-2029 (%)

    5 Historic Market Size

    • 5.1 Global Coated Abrasives Market 2019 - 2023
      • Historic Market Size - Data Table on Global Coated Abrasives Market 2019 - 2023 ($ million)
    • 5.2 Grain Type segment analysis 2019 - 2023
      • Historic Market Size - Grain Type Segment 2019 - 2023 ($ million)
    • 5.3 Backing Material segment analysis 2019 - 2023
      • Historic Market Size - Backing Material Segment 2019 - 2023 ($ million)
    • 5.4 Application segment analysis 2019 - 2023
      • Historic Market Size - Application Segment 2019 - 2023 ($ million)
    • 5.5 Product Type segment analysis 2019 - 2023
      • Historic Market Size - Product Type Segment 2019 - 2023 ($ million)
    • 5.6 Geography segment analysis 2019 - 2023
      • Historic Market Size - Geography Segment 2019 - 2023 ($ million)
    • 5.7 Country segment analysis 2019 - 2023
      • Historic Market Size - Country Segment 2019 - 2023 ($ million)

    6 Qualitative Analysis

    • 6.1 Impact of AI in the Global Coated Abrasives Market

      7 Five Forces Analysis

      • 7.1 Five forces summary
        • Five forces analysis - Comparison between 2024 and 2029
      • 7.2 Bargaining power of buyers
        • Bargaining power of buyers - Impact of key factors 2024 and 2029
      • 7.3 Bargaining power of suppliers
        • Bargaining power of suppliers - Impact of key factors in 2024 and 2029
      • 7.4 Threat of new entrants
        • Threat of new entrants - Impact of key factors in 2024 and 2029
      • 7.5 Threat of substitutes
        • Threat of substitutes - Impact of key factors in 2024 and 2029
      • 7.6 Threat of rivalry
        • Threat of rivalry - Impact of key factors in 2024 and 2029
      • 7.7 Market condition
        • Chart on Market condition - Five forces 2024 and 2029

      8 Market Segmentation by Grain Type

      • 8.1 Market segments
        • Chart on Grain Type - Market share 2024-2029 (%)
        • Data Table on Grain Type - Market share 2024-2029 (%)
      • 8.2 Comparison by Grain Type
        • Chart on Comparison by Grain Type
        • Data Table on Comparison by Grain Type
      • 8.3 Aluminum oxide - Market size and forecast 2024-2029
        • Chart on Aluminum oxide - Market size and forecast 2024-2029 ($ million)
        • Data Table on Aluminum oxide - Market size and forecast 2024-2029 ($ million)
        • Chart on Aluminum oxide - Year-over-year growth 2024-2029 (%)
        • Data Table on Aluminum oxide - Year-over-year growth 2024-2029 (%)
      • 8.4 Ceramic - Market size and forecast 2024-2029
        • Chart on Ceramic - Market size and forecast 2024-2029 ($ million)
        • Data Table on Ceramic - Market size and forecast 2024-2029 ($ million)
        • Chart on Ceramic - Year-over-year growth 2024-2029 (%)
        • Data Table on Ceramic - Year-over-year growth 2024-2029 (%)
      • 8.5 Silicon carbide - Market size and forecast 2024-2029
        • Chart on Silicon carbide - Market size and forecast 2024-2029 ($ million)
        • Data Table on Silicon carbide - Market size and forecast 2024-2029 ($ million)
        • Chart on Silicon carbide - Year-over-year growth 2024-2029 (%)
        • Data Table on Silicon carbide - Year-over-year growth 2024-2029 (%)
      • 8.6 Alumina zirconia - Market size and forecast 2024-2029
        • Chart on Alumina zirconia - Market size and forecast 2024-2029 ($ million)
        • Data Table on Alumina zirconia - Market size and forecast 2024-2029 ($ million)
        • Chart on Alumina zirconia - Year-over-year growth 2024-2029 (%)
        • Data Table on Alumina zirconia - Year-over-year growth 2024-2029 (%)
      • 8.7 Others - Market size and forecast 2024-2029
        • Chart on Others - Market size and forecast 2024-2029 ($ million)
        • Data Table on Others - Market size and forecast 2024-2029 ($ million)
        • Chart on Others - Year-over-year growth 2024-2029 (%)
        • Data Table on Others - Year-over-year growth 2024-2029 (%)
      • 8.8 Market opportunity by Grain Type
        • Market opportunity by Grain Type ($ million)
        • Data Table on Market opportunity by Grain Type ($ million)

      9 Market Segmentation by Backing Material

      • 9.1 Market segments
        • Chart on Backing Material - Market share 2024-2029 (%)
        • Data Table on Backing Material - Market share 2024-2029 (%)
      • 9.2 Comparison by Backing Material
        • Chart on Comparison by Backing Material
        • Data Table on Comparison by Backing Material
      • 9.3 Fiber - Market size and forecast 2024-2029
        • Chart on Fiber - Market size and forecast 2024-2029 ($ million)
        • Data Table on Fiber - Market size and forecast 2024-2029 ($ million)
        • Chart on Fiber - Year-over-year growth 2024-2029 (%)
        • Data Table on Fiber - Year-over-year growth 2024-2029 (%)
      • 9.4 Paper - Market size and forecast 2024-2029
        • Chart on Paper - Market size and forecast 2024-2029 ($ million)
        • Data Table on Paper - Market size and forecast 2024-2029 ($ million)
        • Chart on Paper - Year-over-year growth 2024-2029 (%)
        • Data Table on Paper - Year-over-year growth 2024-2029 (%)
      • 9.5 Cloth - Market size and forecast 2024-2029
        • Chart on Cloth - Market size and forecast 2024-2029 ($ million)
        • Data Table on Cloth - Market size and forecast 2024-2029 ($ million)
        • Chart on Cloth - Year-over-year growth 2024-2029 (%)
        • Data Table on Cloth - Year-over-year growth 2024-2029 (%)
      • 9.6 Polyester - Market size and forecast 2024-2029
        • Chart on Polyester - Market size and forecast 2024-2029 ($ million)
        • Data Table on Polyester - Market size and forecast 2024-2029 ($ million)
        • Chart on Polyester - Year-over-year growth 2024-2029 (%)
        • Data Table on Polyester - Year-over-year growth 2024-2029 (%)
      • 9.7 Others - Market size and forecast 2024-2029
        • Chart on Others - Market size and forecast 2024-2029 ($ million)
        • Data Table on Others - Market size and forecast 2024-2029 ($ million)
        • Chart on Others - Year-over-year growth 2024-2029 (%)
        • Data Table on Others - Year-over-year growth 2024-2029 (%)
      • 9.8 Market opportunity by Backing Material
        • Market opportunity by Backing Material ($ million)
        • Data Table on Market opportunity by Backing Material ($ million)

      10 Market Segmentation by Application

      • 10.1 Market segments
        • Chart on Application - Market share 2024-2029 (%)
        • Data Table on Application - Market share 2024-2029 (%)
      • 10.2 Comparison by Application
        • Chart on Comparison by Application
        • Data Table on Comparison by Application
      • 10.3 Transportation - Market size and forecast 2024-2029
        • Chart on Transportation - Market size and forecast 2024-2029 ($ million)
        • Data Table on Transportation - Market size and forecast 2024-2029 ($ million)
        • Chart on Transportation - Year-over-year growth 2024-2029 (%)
        • Data Table on Transportation - Year-over-year growth 2024-2029 (%)
      • 10.4 Machinery - Market size and forecast 2024-2029
        • Chart on Machinery - Market size and forecast 2024-2029 ($ million)
        • Data Table on Machinery - Market size and forecast 2024-2029 ($ million)
        • Chart on Machinery - Year-over-year growth 2024-2029 (%)
        • Data Table on Machinery - Year-over-year growth 2024-2029 (%)
      • 10.5 Metal fabrication - Market size and forecast 2024-2029
        • Chart on Metal fabrication - Market size and forecast 2024-2029 ($ million)
        • Data Table on Metal fabrication - Market size and forecast 2024-2029 ($ million)
        • Chart on Metal fabrication - Year-over-year growth 2024-2029 (%)
        • Data Table on Metal fabrication - Year-over-year growth 2024-2029 (%)
      • 10.6 Consumer goods - Market size and forecast 2024-2029
        • Chart on Consumer goods - Market size and forecast 2024-2029 ($ million)
        • Data Table on Consumer goods - Market size and forecast 2024-2029 ($ million)
        • Chart on Consumer goods - Year-over-year growth 2024-2029 (%)
        • Data Table on Consumer goods - Year-over-year growth 2024-2029 (%)
      • 10.7 Others - Market size and forecast 2024-2029
        • Chart on Others - Market size and forecast 2024-2029 ($ million)
        • Data Table on Others - Market size and forecast 2024-2029 ($ million)
        • Chart on Others - Year-over-year growth 2024-2029 (%)
        • Data Table on Others - Year-over-year growth 2024-2029 (%)
      • 10.8 Market opportunity by Application
        • Market opportunity by Application ($ million)
        • Data Table on Market opportunity by Application ($ million)

      11 Market Segmentation by Product Type

      • 11.1 Market segments
        • Chart on Product Type - Market share 2024-2029 (%)
        • Data Table on Product Type - Market share 2024-2029 (%)
      • 11.2 Comparison by Product Type
        • Chart on Comparison by Product Type
        • Data Table on Comparison by Product Type
      • 11.3 Belts - Market size and forecast 2024-2029
        • Chart on Belts - Market size and forecast 2024-2029 ($ million)
        • Data Table on Belts - Market size and forecast 2024-2029 ($ million)
        • Chart on Belts - Year-over-year growth 2024-2029 (%)
        • Data Table on Belts - Year-over-year growth 2024-2029 (%)
      • 11.4 Discs - Market size and forecast 2024-2029
        • Chart on Discs - Market size and forecast 2024-2029 ($ million)
        • Data Table on Discs - Market size and forecast 2024-2029 ($ million)
        • Chart on Discs - Year-over-year growth 2024-2029 (%)
        • Data Table on Discs - Year-over-year growth 2024-2029 (%)
      • 11.5 Rolls - Market size and forecast 2024-2029
        • Chart on Rolls - Market size and forecast 2024-2029 ($ million)
        • Data Table on Rolls - Market size and forecast 2024-2029 ($ million)
        • Chart on Rolls - Year-over-year growth 2024-2029 (%)
        • Data Table on Rolls - Year-over-year growth 2024-2029 (%)
      • 11.6 Sheets - Market size and forecast 2024-2029
        • Chart on Sheets - Market size and forecast 2024-2029 ($ million)
        • Data Table on Sheets - Market size and forecast 2024-2029 ($ million)
        • Chart on Sheets - Year-over-year growth 2024-2029 (%)
        • Data Table on Sheets - Year-over-year growth 2024-2029 (%)
      • 11.7 Others - Market size and forecast 2024-2029
        • Chart on Others - Market size and forecast 2024-2029 ($ million)
        • Data Table on Others - Market size and forecast 2024-2029 ($ million)
        • Chart on Others - Year-over-year growth 2024-2029 (%)
        • Data Table on Others - Year-over-year growth 2024-2029 (%)
      • 11.8 Market opportunity by Product Type
        • Market opportunity by Product Type ($ million)
        • Data Table on Market opportunity by Product Type ($ million)

      12 Customer Landscape

      • 12.1 Customer landscape overview
        • Analysis of price sensitivity, lifecycle, customer purchase basket, adoption rates, and purchase criteria

      13 Geographic Landscape

      • 13.1 Geographic segmentation
        • Chart on Market share by geography 2024-2029 (%)
        • Data Table on Market share by geography 2024-2029 (%)
      • 13.2 Geographic comparison
        • Chart on Geographic comparison
        • Data Table on Geographic comparison
      • 13.3 APAC - Market size and forecast 2024-2029
        • Chart on APAC - Market size and forecast 2024-2029 ($ million)
        • Data Table on APAC - Market size and forecast 2024-2029 ($ million)
        • Chart on APAC - Year-over-year growth 2024-2029 (%)
        • Data Table on APAC - Year-over-year growth 2024-2029 (%)
      • 13.4 Europe - Market size and forecast 2024-2029
        • Chart on Europe - Market size and forecast 2024-2029 ($ million)
        • Data Table on Europe - Market size and forecast 2024-2029 ($ million)
        • Chart on Europe - Year-over-year growth 2024-2029 (%)
        • Data Table on Europe - Year-over-year growth 2024-2029 (%)
      • 13.5 North America - Market size and forecast 2024-2029
        • Chart on North America - Market size and forecast 2024-2029 ($ million)
        • Data Table on North America - Market size and forecast 2024-2029 ($ million)
        • Chart on North America - Year-over-year growth 2024-2029 (%)
        • Data Table on North America - Year-over-year growth 2024-2029 (%)
      • 13.6 South America - Market size and forecast 2024-2029
        • Chart on South America - Market size and forecast 2024-2029 ($ million)
        • Data Table on South America - Market size and forecast 2024-2029 ($ million)
        • Chart on South America - Year-over-year growth 2024-2029 (%)
        • Data Table on South America - Year-over-year growth 2024-2029 (%)
      • 13.7 Middle East and Africa - Market size and forecast 2024-2029
        • Chart on Middle East and Africa - Market size and forecast 2024-2029 ($ million)
        • Data Table on Middle East and Africa - Market size and forecast 2024-2029 ($ million)
        • Chart on Middle East and Africa - Year-over-year growth 2024-2029 (%)
        • Data Table on Middle East and Africa - Year-over-year growth 2024-2029 (%)
      • 13.8 China - Market size and forecast 2024-2029
        • Chart on China - Market size and forecast 2024-2029 ($ million)
        • Data Table on China - Market size and forecast 2024-2029 ($ million)
        • Chart on China - Year-over-year growth 2024-2029 (%)
        • Data Table on China - Year-over-year growth 2024-2029 (%)
      • 13.9 Japan - Market size and forecast 2024-2029
        • Chart on Japan - Market size and forecast 2024-2029 ($ million)
        • Data Table on Japan - Market size and forecast 2024-2029 ($ million)
        • Chart on Japan - Year-over-year growth 2024-2029 (%)
        • Data Table on Japan - Year-over-year growth 2024-2029 (%)
      • 13.10 India - Market size and forecast 2024-2029
        • Chart on India - Market size and forecast 2024-2029 ($ million)
        • Data Table on India - Market size and forecast 2024-2029 ($ million)
        • Chart on India - Year-over-year growth 2024-2029 (%)
        • Data Table on India - Year-over-year growth 2024-2029 (%)
      • 13.11 US - Market size and forecast 2024-2029
        • Chart on US - Market size and forecast 2024-2029 ($ million)
        • Data Table on US - Market size and forecast 2024-2029 ($ million)
        • Chart on US - Year-over-year growth 2024-2029 (%)
        • Data Table on US - Year-over-year growth 2024-2029 (%)
      • 13.12 South Korea - Market size and forecast 2024-2029
        • Chart on South Korea - Market size and forecast 2024-2029 ($ million)
        • Data Table on South Korea - Market size and forecast 2024-2029 ($ million)
        • Chart on South Korea - Year-over-year growth 2024-2029 (%)
        • Data Table on South Korea - Year-over-year growth 2024-2029 (%)
      • 13.13 Australia - Market size and forecast 2024-2029
        • Chart on Australia - Market size and forecast 2024-2029 ($ million)
        • Data Table on Australia - Market size and forecast 2024-2029 ($ million)
        • Chart on Australia - Year-over-year growth 2024-2029 (%)
        • Data Table on Australia - Year-over-year growth 2024-2029 (%)
      • 13.14 Germany - Market size and forecast 2024-2029
        • Chart on Germany - Market size and forecast 2024-2029 ($ million)
        • Data Table on Germany - Market size and forecast 2024-2029 ($ million)
        • Chart on Germany - Year-over-year growth 2024-2029 (%)
        • Data Table on Germany - Year-over-year growth 2024-2029 (%)
      • 13.15 UK - Market size and forecast 2024-2029
        • Chart on UK - Market size and forecast 2024-2029 ($ million)
        • Data Table on UK - Market size and forecast 2024-2029 ($ million)
        • Chart on UK - Year-over-year growth 2024-2029 (%)
        • Data Table on UK - Year-over-year growth 2024-2029 (%)
      • 13.16 Brazil - Market size and forecast 2024-2029
        • Chart on Brazil - Market size and forecast 2024-2029 ($ million)
        • Data Table on Brazil - Market size and forecast 2024-2029 ($ million)
        • Chart on Brazil - Year-over-year growth 2024-2029 (%)
        • Data Table on Brazil - Year-over-year growth 2024-2029 (%)
      • 13.17 Canada - Market size and forecast 2024-2029
        • Chart on Canada - Market size and forecast 2024-2029 ($ million)
        • Data Table on Canada - Market size and forecast 2024-2029 ($ million)
        • Chart on Canada - Year-over-year growth 2024-2029 (%)
        • Data Table on Canada - Year-over-year growth 2024-2029 (%)
      • 13.18 Market opportunity by geography
        • Market opportunity by geography ($ million)
        • Data Tables on Market opportunity by geography ($ million)

      14 Drivers, Challenges, and Opportunity/Restraints

      • 14.1 Market drivers
        • 14.2 Market challenges
          • 14.3 Impact of drivers and challenges
            • Impact of drivers and challenges in 2024 and 2029
          • 14.4 Market opportunities/restraints

            15 Competitive Landscape

            • 15.1 Overview
              • 15.2 Competitive Landscape
                • Overview on criticality of inputs and factors of differentiation
              • 15.3 Landscape disruption
                • Overview on factors of disruption
              • 15.4 Industry risks
                • Impact of key risks on business

              16 Competitive Analysis

              • 16.1 Companies profiled
                • Companies covered
              • 16.2 Company ranking index
                • Company ranking index
              • 16.3 Market positioning of companies
                • Matrix on companies position and classification
              • 3M Co.
                • 3M Co. - Overview
                • 3M Co. - Business segments
                • 3M Co. - Key news
                • 3M Co. - Key offerings
                • 3M Co. - Segment focus
                • SWOT
              • 16.5 Ammega Group BV
                • Ammega Group BV - Overview
                • Ammega Group BV - Product / Service
                • Ammega Group BV - Key offerings
                • SWOT
              • 16.6 Compagnie de Saint-Gobain SA
                • Compagnie de Saint-Gobain SA - Overview
                • Compagnie de Saint-Gobain SA - Business segments
                • Compagnie de Saint-Gobain SA - Key news
                • Compagnie de Saint-Gobain SA - Key offerings
                • Compagnie de Saint-Gobain SA - Segment focus
                • SWOT
              • 16.7 DEERFOS Co. Ltd.
                • DEERFOS Co. Ltd. - Overview
                • DEERFOS Co. Ltd. - Product / Service
                • DEERFOS Co. Ltd. - Key offerings
                • SWOT
              • 16.8 Fandeli International Corp.
                • Fandeli International Corp. - Overview
                • Fandeli International Corp. - Product / Service
                • Fandeli International Corp. - Key offerings
                • SWOT
              • 16.9 Gemtex Abrasives
                • Gemtex Abrasives - Overview
                • Gemtex Abrasives - Product / Service
                • Gemtex Abrasives - Key offerings
                • SWOT
              • 16.10 Hermes Schleifmittel GmbH
                • Hermes Schleifmittel GmbH - Overview
                • Hermes Schleifmittel GmbH - Product / Service
                • Hermes Schleifmittel GmbH - Key offerings
                • SWOT
              • 16.11 Jiangsu Sanling Abrasive Co. Ltd.
                • Jiangsu Sanling Abrasive Co. Ltd. - Overview
                • Jiangsu Sanling Abrasive Co. Ltd. - Product / Service
                • Jiangsu Sanling Abrasive Co. Ltd. - Key offerings
                • SWOT
              • 16.12 Johnson Abrasives Co. Inc.
                • Johnson Abrasives Co. Inc. - Overview
                • Johnson Abrasives Co. Inc. - Product / Service
                • Johnson Abrasives Co. Inc. - Key offerings
                • SWOT
              • 16.13 Mirka Ltd.
                • Mirka Ltd. - Overview
                • Mirka Ltd. - Product / Service
                • Mirka Ltd. - Key offerings
                • SWOT
              • 16.14 Murugappa Group
                • Murugappa Group - Overview
                • Murugappa Group - Product / Service
                • Murugappa Group - Key offerings
                • SWOT
              • 16.15 Robert Bosch GmbH
                • Robert Bosch GmbH - Overview
                • Robert Bosch GmbH - Product / Service
                • Robert Bosch GmbH - Key news
                • Robert Bosch GmbH - Key offerings
                • SWOT
              • 16.16 Swajit Abrasives Pvt. Ltd.
                • Swajit Abrasives Pvt. Ltd. - Overview
                • Swajit Abrasives Pvt. Ltd. - Product / Service
                • Swajit Abrasives Pvt. Ltd. - Key offerings
                • SWOT
              • 16.17 VSM AG
                • VSM AG - Overview
                • VSM AG - Product / Service
                • VSM AG - Key offerings
                • SWOT
              • 16.18 WEEM Abrasives
                • WEEM Abrasives - Overview
                • WEEM Abrasives - Product / Service
                • WEEM Abrasives - Key offerings
                • SWOT

              17 Appendix

              • 17.1 Scope of the report
                • 17.2 Inclusions and exclusions checklist
                  • Inclusions checklist
                  • Exclusions checklist
                • 17.3 Currency conversion rates for US$
                  • Currency conversion rates for US$
                • 17.4 Research methodology
                  • Research methodology
                • 17.5 Data procurement
                  • Information sources
                • 17.6 Data validation
                  • Data validation
                • 17.7 Validation techniques employed for market sizing
                  • Validation techniques employed for market sizing
                • 17.8 Data synthesis
                  • Data synthesis
                • 17.9 360 degree market analysis
                  • 360 degree market analysis
                • 17.10 List of abbreviations
                  • List of abbreviations

                Research Methodology

                Technavio presents a detailed picture of the market by way of study, synthesis, and summation of data from multiple sources. The analysts have presented the various facets of the market with a particular focus on identifying the key industry influencers. The data thus presented is comprehensive, reliable, and the result of extensive research, both primary and secondary.

                INFORMATION SOURCES

                Primary sources

                • Manufacturers and suppliers
                • Channel partners
                • Industry experts
                • Strategic decision makers

                Secondary sources

                • Industry journals and periodicals
                • Government data
                • Financial reports of key industry players
                • Historical data
                • Press releases

                DATA ANALYSIS

                Data Synthesis

                • Collation of data
                • Estimation of key figures
                • Analysis of derived insights

                Data Validation

                • Triangulation with data models
                • Reference against proprietary databases
                • Corroboration with industry experts

                REPORT WRITING

                Qualitative

                • Market drivers
                • Market challenges
                • Market trends
                • Five forces analysis

                Quantitative

                • Market size and forecast
                • Market segmentation
                • Geographical insights
                • Competitive landscape

                Interested in this report?

                Get your sample now to see our research methodology and insights!

                Download Now

                Frequently Asked Questions

                Coated Abrasives market growth will increase by $ 4696 mn during 2025-2029.

                The Coated Abrasives market is expected to grow at a CAGR of 5.8% during 2025-2029.

                Coated Abrasives market is segmented by Grain Type( Aluminum oxide, Ceramic, Silicon carbide, Alumina zirconia, Others) Backing Material( Fiber, Paper, Cloth, Polyester, Others) Application( Transportation, Machinery, Metal fabrication, Consumer goods, Others)

                3M Co., Ammega Group BV, Arc Abrasives Inc., BARTON International, Compagnie de Saint-Gobain SA, DEERFOS Co. Ltd., Fandeli International Corp., Gemtex Abrasives, Hermes Schleifmittel GmbH, Jiangsu Sanling Abrasive Co. Ltd., Johnson Abrasives Co. Inc., KLINGSPOR AG, Mirka Ltd., Murugappa Group, Napoleon Abrasives S.p.a., Robert Bosch GmbH, SAK ABRASIVES Ltd., Swajit Abrasives Pvt. Ltd., VSM AG, WEEM Abrasives are a few of the key vendors in the Coated Abrasives market.

                APAC will register the highest growth rate of 68% among the other regions. Therefore, the Coated Abrasives market in APAC is expected to garner significant business opportunities for the vendors during the forecast period.

                China, Japan, India, US, South Korea, Australia, Germany, UK, Brazil, Canada

                • Growing demand for PSA-backed coated abrasivesPressure-sensitive adhesives (PSA) are gaining popularity because they offer greater ease in the mounting of sanding discs is the driving factor this market.
                • rolls is the driving factor this market.
                • and sheets. However is the driving factor this market.
                • cloth and paper are still widely used as backing materials in coated abrasives. Many companies is the driving factor this market.
                • such as Saint Gobain and CUMI is the driving factor this market.
                • offer coated abrasives with PSA-backing. Key applications of these products include blending welds and defects in auto body shops is the driving factor this market.
                • the removal of paint and primer in auto refinish shops and orbital sanding for the finishing of flat stock wood components. Mountings on disc sanders is the driving factor this market.
                • orbital sanders is the driving factor this market.
                • and rotary sanders can be conveniently carried out using PSA-backed coated abrasives. These types of coated abrasives ensure protection from dust and moisture is the driving factor this market.
                • along with providing longer disc life. The resultant characteristic of the evenly applied adhesive coating guarantees consistent grinding is the driving factor this market.
                • sanding is the driving factor this market.
                • and polishing action on any surface is the driving factor this market.
                • flat or contoured. Such factors are expected to drive the growth of the global coated abrasives market during the forecast period. is the driving factor this market.

                The Coated Abrasives market vendors should focus on grabbing business opportunities from the Aluminum oxide segment as it accounted for the largest market share in the base year.