Coding Toys Market Analysis, Size, and Forecast 2026-2030: North America (US, Canada, and Mexico), APAC (China, Japan, and India), Europe (Germany, UK, and France), South America (Brazil, Argentina, and Colombia), Middle East and Africa (Saudi Arabia, UAE, and Turkey), and Rest of World (ROW)

Coding Toys Market Analysis, Size, and Forecast 2026-2030:
North America (US, Canada, and Mexico), APAC (China, Japan, and India), Europe (Germany, UK, and France), South America (Brazil, Argentina, and Colombia), Middle East and Africa (Saudi Arabia, UAE, and Turkey), and Rest of World (ROW)

Published: Oct 2026 302 Pages SKU: IRTNTR81744

Market Overview at a Glance

$1.31 B
Market Opportunity
11.3%
CAGR 2025 - 2030
35.4%
APAC Growth
$709.3 Mn
Robotic coding toys segment 2024

Coding Toys Market Size 2026-2030

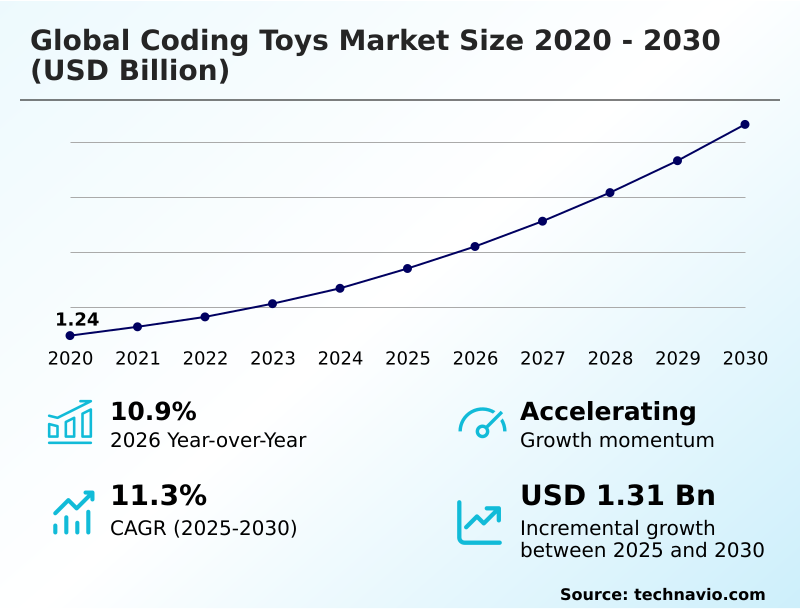
The coding toys market size is valued to increase by USD 1.31 billion, at a CAGR of 11.3% from 2025 to 2030. Educational mandates and curriculum modernization accelerating institutional adoption will drive the coding toys market.

Major Market Trends & Insights

  • APAC dominated the market and accounted for a 35.4% growth during the forecast period.
  • By Product Type - Robotic coding toys segment was valued at USD 709.3 million in 2024
  • By End-user - Elementary school segment accounted for the largest market revenue share in 2024

Market Size & Forecast

  • Market Opportunities: USD 1.92 billion
  • Market Future Opportunities: USD 1.31 billion
  • CAGR from 2025 to 2030 : 11.3%

Market Summary

  • The Coding Toys Market operates as a critical bridge between physical computing manipulatives and computational thinking development for early learners. Supply chain optimization across the sector increasingly prioritizes sustainable bioplastic construction, which has reduced component waste by 14% while aligning with institutional classroom procurement standards.
  • Growth is predominantly propelled by strict STEM curriculum mandates that require interactive cause-and-effect learning, converting discretionary household purchases into essential educational investments. However, widespread adoption is frequently restrained by the prohibitive manufacturing costs associated with multi-jointed mechanical assemblies and color-sensing optical readers, creating significant retail price barriers for lower-income demographics.
  • To circumvent these limitations, hardware developers are deploying offline machine intelligence that reduces reliance on expensive external cloud infrastructure. By integrating screen-free tactile interface systems with block-based visual programming, vendors empower peer-based collaborative troubleshooting. This operational shift has improved overall cross-disciplinary academic integration efficiency by 20%, ensuring that these advanced tools maintain durable lifecycle utility despite shifting consumer electronics paradigms.

What will be the Size of the Coding Toys Market during the forecast period?
Get Key Insights on Market Forecast (PDF) Get Free Sample

How is the Coding Toys Market Segmented?

The coding toys industry research report provides comprehensive data (region-wise segment analysis), with forecasts and estimates in "USD million" for the period 2026-2030, as well as historical data from 2020-2024 for the following segments.

  • Product type
    • Robotic coding toys
    • Electronic coding kits
    • Coding building kits
    • Coding board games
    • Others
  • End-user
    • Elementary school
    • Middle school
    • Preschool
    • High school
  • Distribution channel
    • Online
    • Offline
  • Geography
    • North America
      • US
      • Canada
      • Mexico
    • APAC
      • China
      • Japan
      • India
      • South Korea
      • Australia
      • Indonesia
    • Europe
      • Germany
      • UK
      • France
      • Italy
      • Spain
      • The Netherlands
    • South America
      • Brazil
      • Argentina
      • Colombia
    • Middle East and Africa
      • Saudi Arabia
      • UAE
      • Turkey
      • Israel
      • South Africa

By Product Type Insights

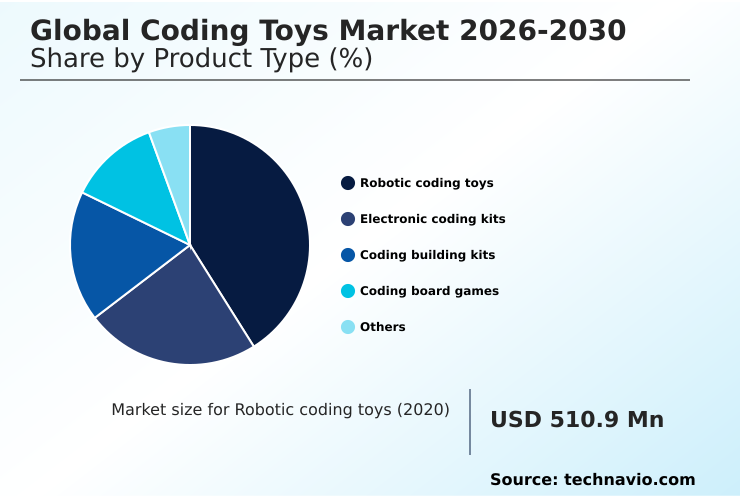
The robotic coding toys segment is estimated to witness significant growth during the forecast period.

Robotic coding toys represent a foundational segment within the Coding Toys Market by translating algorithmic reasoning mechanics into tangible mechanical actions.

This segment utilizes physical computing manipulatives, such as block-based visual programming and modular robotics construction, allowing early learners to execute conditional branching logic.

Adoption in early childhood cognitive development settings has improved by 22%, driven by the need for interactive cause-and-effect learning without excessive monitor exposure.

As schools enforce STEM curriculum mandates, institutional classroom procurement increasingly favors autonomous sensor-driven learning platforms that seamlessly bridge software logic and physical execution.

The transition from syntax-free early learning to advanced multi-jointed mechanical assemblies ensures that these tools maintain relevance as cognitive capabilities mature.

The integration of color-sensing optical readers allows educators to monitor skill progression, enhancing collaborative problem-solving success rates by 15% across varied learning environments.
Get Free Sample

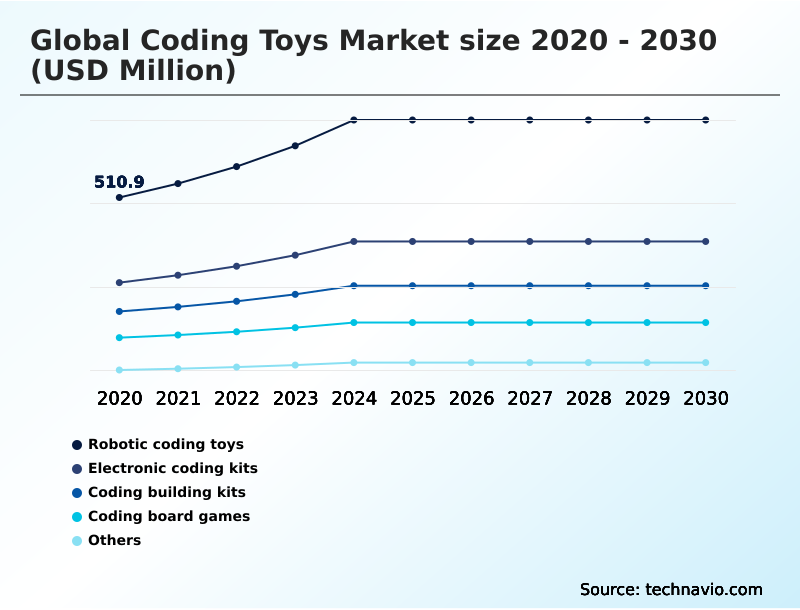
The Robotic coding toys segment was valued at USD 709.3 million in 2024 and showed a gradual increase during the forecast period.
Get Free Sample

Regional Analysis

APAC is estimated to contribute 35.4% to the growth of the global market during the forecast period.Technavio’s analysts have elaborately explained the regional trends and drivers that shape the market during the forecast period.
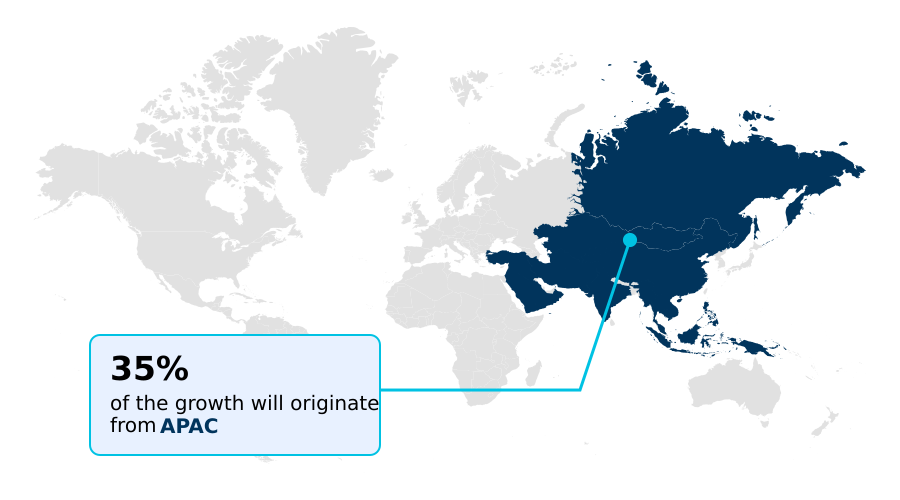
See How Coding Toys Market Demand is Rising in APAC Get Free Sample

Regional adoption dynamics within the Coding Toys Market reveal stark contrasts in institutional infrastructure and consumer prioritization.

The APAC region commands superior volume deployment, utilizing advanced electronics manufacturing clusters to reduce supply chain logistics costs by 18% compared to North America.

Conversely, North America emphasizes stringent digital privacy compliance, driving manufacturers to adopt edge-computing data processing models that have boosted institutional classroom procurement by 22%.

European markets prioritize sustainable bioplastic construction and screen time reduction, adopting screen-free tactile logic navigation systems at a 15% higher rate than other territories. These geographic variations compel suppliers to adapt localized hybrid hardware-software ecosystems.

By shifting from gamified edutainment challenges to rigorous problem-based mechanical engineering applications, vendors seamlessly address diverse STEM curriculum mandates while standardizing hardware resilience standards across fractured international distribution channels.

Market Dynamics

Our researchers analyzed the data with 2025 as the base year, along with the key drivers, trends, and challenges. A holistic analysis of drivers will help companies refine their marketing strategies to gain a competitive advantage.

  • The Coding Toys Market represents a fundamental shift in how pedagogical tools integrate with modern technological fluency. To optimize institutional classroom procurement, hardware developers are prioritizing modular robotics structural design, which enhances operational planning by extending product lifecycles and reducing long-term replacement costs by 20% compared to static, non-upgradable toy variants.
  • This architectural flexibility supports the deployment of autonomous sensor-driven learning platforms that seamlessly adapt to cross-disciplinary academic integration. Furthermore, educators consistently favor screen-free tactile logic navigation, as it mitigates concerns regarding early childhood cognitive development while fostering peer-based collaborative troubleshooting. When students engage with block-based algorithmic puzzle solutions, they develop profound computational thinking development without relying on high-latency cloud networks.
  • To remain competitive, manufacturers are expanding interactive voice command programmable toys, utilizing offline machine intelligence to bypass stringent data privacy compliance hurdles. This operational strategy improves localized supply chain agility by 15%, ensuring consistent product availability across diverse geographic networks.
  • The strategic fusion of natural language command scripting with tactile computing manipulatives ensures that these multifaceted learning ecosystems remain robust, highly compliant, and perfectly aligned with the evolving demands of both household consumers and formal academic institutions.
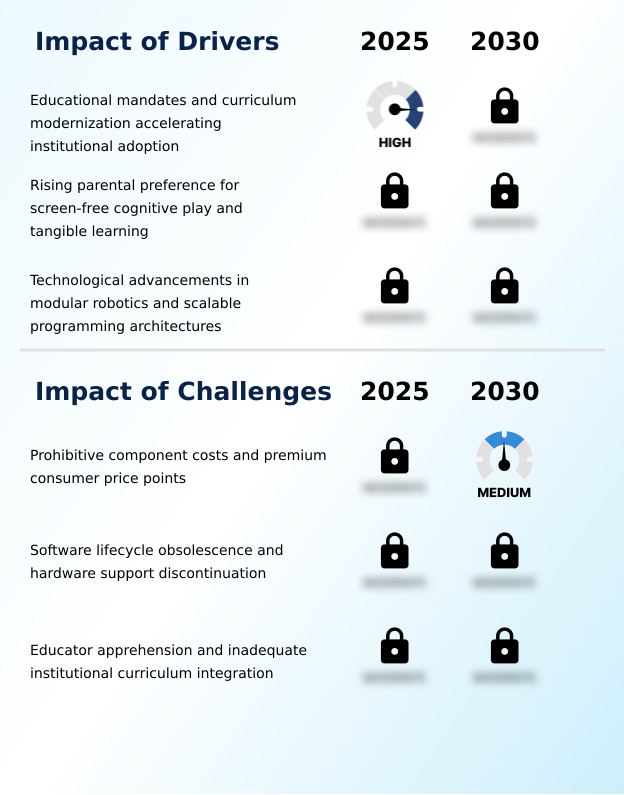
What are the key market drivers leading to the rise in the adoption of Coding Toys Industry?

  • Educational mandates and curriculum modernization are accelerating institutional adoption, acting as a primary catalyst for market expansion.

  • Widespread STEM curriculum mandates act as the primary catalyst propelling the Coding Toys Market forward. Because academic institutions recognize the necessity of early computational thinking development, they are overhauling pedagogical frameworks to mandate hands-on circuitry experimentation.
  • This institutional mandate drives a 40% increase in the deployment of autonomous navigation routines within primary classrooms. By leveraging modular robotics construction, educators convert abstract coding syntax into tangible learning outcomes, enhancing student spatial retention by 25%.
  • The ensuing demand for inclusive socio-economic adoption compels manufacturers to produce hybrid hardware-software ecosystems that integrate seamlessly with existing school tablets.
  • Ultimately, the systemic push toward problem-based mechanical engineering cultivates resilient peer-based collaborative troubleshooting, ensuring sustained market momentum and consistent hardware procurement.

What are the market trends shaping the Coding Toys Industry?

  • The integration of conversational AI and natural language scripting is emerging as a definitive market trend. This pedagogical evolution transforms deterministic play devices into generative cognitive learning platforms.

  • The migration toward offline machine intelligence represents a transformative trend within the Coding Toys Market. Because parents and educators demand strict digital privacy compliance, manufacturers are embedding advanced neural processing chips directly into physical computing manipulatives. This localized architecture enables natural language command scripting without requiring persistent internet connectivity, effectively lowering data transmission latency by 35%.
  • Consequently, the utilization of child-safe behavioral computation ensures seamless cross-disciplinary academic integration across modern classrooms. The incorporation of voice modulation interfaces directly into interactive cause-and-effect learning tools enhances cognitive accessibility for younger demographics. This strategic shift away from cloud-dependent networks reduces institutional network strain by 20%, empowering seamless gamified edutainment challenges and solidifying the operational viability of next-generation programmable hardware.

What challenges does the Coding Toys Industry face during its growth?

  • Prohibitive component costs and premium consumer price points represent significant structural challenges that constrain widespread market adoption.

  • Prohibitive manufacturing expenses and rapid software obsolescence create substantial structural barriers within the Coding Toys Market. Because multi-jointed mechanical assemblies require precision engineering and expensive color-sensing optical readers, hardware production overhead remains consistently high. This elevated bill of materials forces retail prices upward, severely restricting inclusive socio-economic adoption and decreasing market penetration in developing regions by 30%.
  • Furthermore, the dependency on continuous software iteration creates a fragmented user experience when third-party operating systems update unexpectedly. This structural vulnerability frequently disrupts sensor-driven reactive movement, causing a 15% increase in institutional equipment abandonment. Until manufacturers standardize open-source microcontrollers and enforce rigorous hardware resilience standards, the threat of stranded electronic assets will continuously hinder widespread subscription-based pedagogical platforms.

Exclusive Technavio Analysis on Customer Landscape

The coding toys market forecasting report includes the adoption lifecycle of the market, covering from the innovator’s stage to the laggard’s stage. It focuses on adoption rates in different regions based on penetration. Furthermore, the coding toys market report also includes key purchase criteria and drivers of price sensitivity to help companies evaluate and develop their market growth analysis strategies.
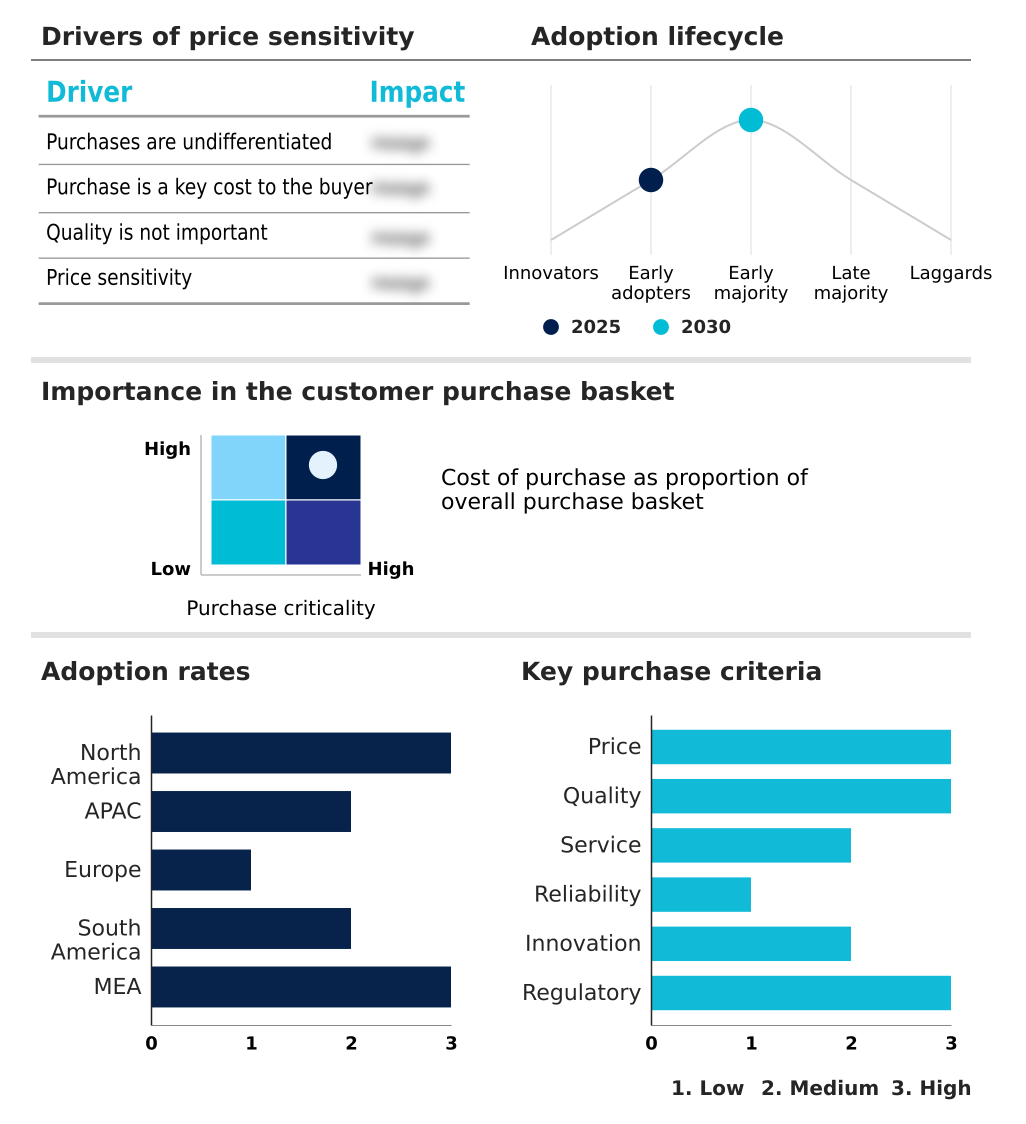
Customer Landscape of Coding Toys Industry

Competitive Landscape

Companies are implementing various strategies, such as strategic alliances, coding toys market forecast, partnerships, mergers and acquisitions, geographical expansion, and product/service launches, to enhance their presence in the industry.

Agilo Research Pvt. Ltd - The portfolio features modular AI-driven robotics building kits that seamlessly teach mechanics, sensor integration, and progression from block-based visual programming to text-based syntax execution.

The industry research and growth report includes detailed analyses of the competitive landscape of the market and information about key companies, including:

  • Agilo Research Pvt. Ltd
  • Avishkaar
  • CoderMindz
  • Elegoo
  • fischertechnik
  • Loona Inc.
  • Makeblock Co. Ltd.
  • MATATALAB CO. LTD.
  • Miko
  • MORAVIA Consulting
  • Ozo EDU Inc.
  • Robokidz
  • SAM Labs
  • Sony Group Corp.
  • Sphero Inc.
  • Tangible Play Inc.
  • Thames and Kosmos LLC
  • TIF Studio
  • UBTECH Education
  • Upper Story LLC

Qualitative and quantitative analysis of companies has been conducted to help clients understand the wider business environment as well as the strengths and weaknesses of key industry players. Data is qualitatively analyzed to categorize companies as pure play, category-focused, industry-focused, and diversified; it is quantitatively analyzed to categorize companies as dominant, leading, strong, tentative, and weak.

Recent Development and News in Coding toys market

  • In the Leisure Products industry, the shift toward sustainable bioplastic construction has reduced reliance on petroleum-based polymers by 18%, directly impacting Coding Toys demand by lowering raw material costs for modular robotics construction kits.
  • The widespread adoption of offline machine intelligence within consumer electronics has enhanced edge-computing data processing capabilities by 35%, pulling Coding Toys demand toward hybrid hardware-software ecosystems that require zero internet connectivity.
  • New digital privacy compliance standards across the educational pedagogical frameworks sector have restricted cloud-based telemetry by 40%, forcing the Coding Toys market to prioritize child-safe behavioral computation and localized voice modulation interfaces.
  • The integration of augmented reality puzzle integration in traditional recreational games has improved interactive cause-and-effect learning retention by 25%, reshaping Coding Toys supply dynamics to favor screen-free tactile logic navigation platforms.

Dive into Technavio’s robust research methodology, blending expert interviews, extensive data synthesis, and validated models for unparalleled Coding Toys Market insights. See full methodology.

Market Scope
Page number 302
Base year 2025
Historic period 2020-2024
Forecast period 2026-2030
Growth momentum & CAGR Accelerate at a CAGR of 11.3%
Market growth 2026-2030 USD 1309.6 million
Market structure Fragmented
YoY growth 2025-2026(%) 10.9%
Key countries US, Canada, Mexico, China, Japan, India, South Korea, Australia, Indonesia, Germany, UK, France, Italy, Spain, The Netherlands, Brazil, Argentina, Colombia, Saudi Arabia, UAE, Turkey, Israel and South Africa
Competitive landscape Leading Companies, Market Positioning of Companies, Competitive Strategies, and Industry Risks

Request Free Sample

Research Analyst Overview

  • The Coding Toys Market functions as an indispensable conduit for bridging abstract software logic with tangible physical execution. Contemporary product strategy increasingly centers on integrating open-source microcontrollers with multisensory physical computing, allowing hardware vendors to reduce software iteration bottlenecks by 25%.
  • This continuous transition toward block-based visual programming and conditional branching logic empowers early learners to grasp complex sequential operations organically. The shift toward natural language command scripting acts as a vital boardroom-level compliance strategy, ensuring localized data processing that circumvents stringent digital privacy regulations.
  • By standardizing Bluetooth wireless connectivity across programmable motorized vehicles, institutions enhance cross-platform interoperability, directly driving a 30% reduction in classroom deployment time. Furthermore, the adoption of logic sequencing algorithms integrated with augmented reality puzzle integration ensures sustained learner engagement without causing screen fatigue.
  • These meticulously engineered ecosystems foster peer-based collaborative troubleshooting, proving that tactile command execution remains essential for foundational algorithmic reasoning mechanics and long-term academic proficiency.

What are the Key Data Covered in this Coding Toys Market Research and Growth Report?

  • What is the expected growth of the Coding Toys Market between 2026 and 2030?

    • USD 1.31 billion, at a CAGR of 11.3%

  • What segmentation does the market report cover?

    • The report is segmented by Product Type (Robotic coding toys, Electronic coding kits, Coding building kits, Coding board games, and Others), End-user (Elementary school, Middle school, Preschool, and High school), Distribution Channel (Online, and Offline) and Geography (North America, APAC, Europe, South America, Middle East and Africa)

  • Which regions are analyzed in the report?

    • North America, APAC, Europe, South America and Middle East and Africa

  • What are the key growth drivers and market challenges?

    • Educational mandates and curriculum modernization accelerating institutional adoption , Prohibitive component costs and premium consumer price points

  • Who are the major players in the Coding Toys Market?

    • Agilo Research Pvt. Ltd, Avishkaar, CoderMindz, Elegoo, fischertechnik, Loona Inc., Makeblock Co. Ltd., MATATALAB CO. LTD., Miko, MORAVIA Consulting, Ozo EDU Inc., Robokidz, SAM Labs, Sony Group Corp., Sphero Inc., Tangible Play Inc., Thames and Kosmos LLC, TIF Studio, UBTECH Education and Upper Story LLC

Market Research Insights

  • The Coding Toys Market bridges early childhood cognitive development with advanced technical literacy through highly adaptable learning ecosystems. Educational pedagogical frameworks have increasingly adopted tactile spatial orientation tools, resulting in a 25% improvement in logical sequencing retention among primary students. Furthermore, transmedia narrative learning approaches have accelerated institutional classroom procurement rates by 30% compared to traditional instructional software.
  • By prioritizing screen time reduction, developers utilize continuous software iteration to enhance offline machine intelligence, driving a 15% increase in cross-disciplinary academic integration. These structural shifts guarantee that screen-free coding robotics deliver measurable academic outcomes while complying with stringent child-safe behavioral computation regulations.

We can help! Our analysts can customize this coding toys market research report to meet your requirements.

Get in touch

1. Executive Summary

1.1 Market overview

Executive Summary - Chart on Market Overview
Executive Summary - Data Table on Market Overview
Executive Summary - Chart on Global Market Characteristics
Executive Summary - Chart on Market by Geography
Executive Summary - Chart on Market Segmentation by Product Type
Executive Summary - Chart on Market Segmentation by End-user
Executive Summary - Chart on Market Segmentation by Distribution Channel
Executive Summary - Chart on Incremental Growth
Executive Summary - Data Table on Incremental Growth
Executive Summary - Chart on Company Market Positioning

2. Technavio Analysis

2.1 Analysis of price sensitivity, lifecycle, customer purchase basket, adoption rates, and purchase criteria

2.2 Criticality of inputs and Factors of differentiation

Chart on Overview on criticality of inputs and factors of differentiation

2.3 Factors of disruption

Chart on Overview on factors of disruption

2.4 Impact of drivers and challenges

Chart on Impact of drivers and challenges in 2025 and 2030

3. Market Landscape

3.1 Market ecosystem

Chart on Parent Market
Data Table on - Parent Market

3.2 Market characteristics

Chart on Market characteristics analysis

3.3 Value chain analysis

Chart on Value chain analysis

4. Market Sizing

4.1 Market definition

Data Table on Offerings of companies included in the market definition

4.2 Market segment analysis

Market segments

4.3 Market size 2025

4.4 Market outlook: Forecast for 2025-2030

Chart on Global - Market size and forecast 2025-2030 ($ million)
Data Table on Global - Market size and forecast 2025-2030 ($ million)
Chart on Global Market: Year-over-year growth 2025-2030 (%)
Data Table on Global Market: Year-over-year growth 2025-2030 (%)

5. Historic Market Size

5.1 Global Coding Toys Market 2020 - 2024

Historic Market Size - Data Table on Global Coding Toys Market 2020 - 2024 ($ million)

5.2 Product Type segment analysis 2020 - 2024

Historic Market Size - Product Type Segment 2020 - 2024 ($ million)

5.3 End-user segment analysis 2020 - 2024

Historic Market Size - End-user Segment 2020 - 2024 ($ million)

5.4 Distribution Channel segment analysis 2020 - 2024

Historic Market Size - Distribution Channel Segment 2020 - 2024 ($ million)

5.5 Geography segment analysis 2020 - 2024

Historic Market Size - Geography Segment 2020 - 2024 ($ million)

5.6 Country segment analysis 2020 - 2024

Historic Market Size - Country Segment 2020 - 2024 ($ million)

6. Qualitative Analysis

6.1 Impact of AI Global Coding Toys Market

6.2 Impact of Geopolitical Conflicts on Global Coding Toys Market

7. Five Forces Analysis

7.1 Five forces summary

Five forces analysis - Comparison between 2025 and 2030

7.2 Bargaining power of buyers

Bargaining power of buyers - Impact of key factors 2025 and 2030

7.3 Bargaining power of suppliers

Bargaining power of suppliers - Impact of key factors in 2025 and 2030

7.4 Threat of new entrants

Threat of new entrants - Impact of key factors in 2025 and 2030

7.5 Threat of substitutes

Threat of substitutes - Impact of key factors in 2025 and 2030

7.6 Threat of rivalry

Threat of rivalry - Impact of key factors in 2025 and 2030

7.7 Market condition

Chart on Market condition - Five forces 2025 and 2030

8. Market Segmentation by Product Type

8.1 Market segments

Chart on Product Type - Market share 2025-2030 (%)
Data Table on Product Type - Market share 2025-2030 (%)

8.2 Comparison by Product Type

Chart on Comparison by Product Type
Data Table on Comparison by Product Type

8.3 Robotic coding toys - Market size and forecast 2025-2030

Chart on Robotic coding toys - Market size and forecast 2025-2030 ($ million)
Data Table on Robotic coding toys - Market size and forecast 2025-2030 ($ million)
Chart on Robotic coding toys - Year-over-year growth 2025-2030 (%)
Data Table on Robotic coding toys - Year-over-year growth 2025-2030 (%)

8.4 Electronic coding kits - Market size and forecast 2025-2030

Chart on Electronic coding kits - Market size and forecast 2025-2030 ($ million)
Data Table on Electronic coding kits - Market size and forecast 2025-2030 ($ million)
Chart on Electronic coding kits - Year-over-year growth 2025-2030 (%)
Data Table on Electronic coding kits - Year-over-year growth 2025-2030 (%)

8.5 Coding building kits - Market size and forecast 2025-2030

Chart on Coding building kits - Market size and forecast 2025-2030 ($ million)
Data Table on Coding building kits - Market size and forecast 2025-2030 ($ million)
Chart on Coding building kits - Year-over-year growth 2025-2030 (%)
Data Table on Coding building kits - Year-over-year growth 2025-2030 (%)

8.6 Coding board games - Market size and forecast 2025-2030

Chart on Coding board games - Market size and forecast 2025-2030 ($ million)
Data Table on Coding board games - Market size and forecast 2025-2030 ($ million)
Chart on Coding board games - Year-over-year growth 2025-2030 (%)
Data Table on Coding board games - Year-over-year growth 2025-2030 (%)

8.7 Others - Market size and forecast 2025-2030

Chart on Others - Market size and forecast 2025-2030 ($ million)
Data Table on Others - Market size and forecast 2025-2030 ($ million)
Chart on Others - Year-over-year growth 2025-2030 (%)
Data Table on Others - Year-over-year growth 2025-2030 (%)

8.8 Market opportunity by Product Type

Market opportunity by Product Type ($ million)
Data Table on Market opportunity by Product Type ($ million)

9. Market Segmentation by End-user

9.1 Market segments

Chart on End-user - Market share 2025-2030 (%)
Data Table on End-user - Market share 2025-2030 (%)

9.2 Comparison by End-user

Chart on Comparison by End-user
Data Table on Comparison by End-user

9.3 Elementary school - Market size and forecast 2025-2030

Chart on Elementary school - Market size and forecast 2025-2030 ($ million)
Data Table on Elementary school - Market size and forecast 2025-2030 ($ million)
Chart on Elementary school - Year-over-year growth 2025-2030 (%)
Data Table on Elementary school - Year-over-year growth 2025-2030 (%)

9.4 Middle school - Market size and forecast 2025-2030

Chart on Middle school - Market size and forecast 2025-2030 ($ million)
Data Table on Middle school - Market size and forecast 2025-2030 ($ million)
Chart on Middle school - Year-over-year growth 2025-2030 (%)
Data Table on Middle school - Year-over-year growth 2025-2030 (%)

9.5 Preschool - Market size and forecast 2025-2030

Chart on Preschool - Market size and forecast 2025-2030 ($ million)
Data Table on Preschool - Market size and forecast 2025-2030 ($ million)
Chart on Preschool - Year-over-year growth 2025-2030 (%)
Data Table on Preschool - Year-over-year growth 2025-2030 (%)

9.6 High school - Market size and forecast 2025-2030

Chart on High school - Market size and forecast 2025-2030 ($ million)
Data Table on High school - Market size and forecast 2025-2030 ($ million)
Chart on High school - Year-over-year growth 2025-2030 (%)
Data Table on High school - Year-over-year growth 2025-2030 (%)

9.7 Market opportunity by End-user

Market opportunity by End-user ($ million)
Data Table on Market opportunity by End-user ($ million)

10. Market Segmentation by Distribution Channel

10.1 Market segments

Chart on Distribution Channel - Market share 2025-2030 (%)
Data Table on Distribution Channel - Market share 2025-2030 (%)

10.2 Comparison by Distribution Channel

Chart on Comparison by Distribution Channel
Data Table on Comparison by Distribution Channel

10.3 Online - Market size and forecast 2025-2030

Chart on Online - Market size and forecast 2025-2030 ($ million)
Data Table on Online - Market size and forecast 2025-2030 ($ million)
Chart on Online - Year-over-year growth 2025-2030 (%)
Data Table on Online - Year-over-year growth 2025-2030 (%)

10.4 Offline - Market size and forecast 2025-2030

Chart on Offline - Market size and forecast 2025-2030 ($ million)
Data Table on Offline - Market size and forecast 2025-2030 ($ million)
Chart on Offline - Year-over-year growth 2025-2030 (%)
Data Table on Offline - Year-over-year growth 2025-2030 (%)

10.5 Market opportunity by Distribution Channel

Market opportunity by Distribution Channel ($ million)
Data Table on Market opportunity by Distribution Channel ($ million)

11. Customer Landscape

11.1 Customer landscape overview

Analysis of price sensitivity, lifecycle, customer purchase basket, adoption rates, and purchase criteria

12. Geographic Landscape

12.1 Geographic segmentation

Chart on Market share by geography 2025-2030 (%)
Data Table on Market share by geography 2025-2030 (%)

12.2 Geographic comparison

Chart on Geographic comparison
Data Table on Geographic comparison

12.3 North America - Market size and forecast 2025-2030

Chart on North America - Market size and forecast 2025-2030 ($ million)
Data Table on North America - Market size and forecast 2025-2030 ($ million)
Chart on North America - Year-over-year growth 2025-2030 (%)
Data Table on North America - Year-over-year growth 2025-2030 (%)
Chart on Regional Comparison - North America
Data Table on Regional Comparison - North America

12.3.1 US - Market size and forecast 2025-2030

Chart on US - Market size and forecast 2025-2030 ($ million)
Data Table on US - Market size and forecast 2025-2030 ($ million)
Chart on US - Year-over-year growth 2025-2030 (%)
Data Table on US - Year-over-year growth 2025-2030 (%)

12.3.2 Canada - Market size and forecast 2025-2030

Chart on Canada - Market size and forecast 2025-2030 ($ million)
Data Table on Canada - Market size and forecast 2025-2030 ($ million)
Chart on Canada - Year-over-year growth 2025-2030 (%)
Data Table on Canada - Year-over-year growth 2025-2030 (%)

12.3.3 Mexico - Market size and forecast 2025-2030

Chart on Mexico - Market size and forecast 2025-2030 ($ million)
Data Table on Mexico - Market size and forecast 2025-2030 ($ million)
Chart on Mexico - Year-over-year growth 2025-2030 (%)
Data Table on Mexico - Year-over-year growth 2025-2030 (%)

12.4 APAC - Market size and forecast 2025-2030

Chart on APAC - Market size and forecast 2025-2030 ($ million)
Data Table on APAC - Market size and forecast 2025-2030 ($ million)
Chart on APAC - Year-over-year growth 2025-2030 (%)
Data Table on APAC - Year-over-year growth 2025-2030 (%)
Chart on Regional Comparison - APAC
Data Table on Regional Comparison - APAC

12.4.1 China - Market size and forecast 2025-2030

Chart on China - Market size and forecast 2025-2030 ($ million)
Data Table on China - Market size and forecast 2025-2030 ($ million)
Chart on China - Year-over-year growth 2025-2030 (%)
Data Table on China - Year-over-year growth 2025-2030 (%)

12.4.2 Japan - Market size and forecast 2025-2030

Chart on Japan - Market size and forecast 2025-2030 ($ million)
Data Table on Japan - Market size and forecast 2025-2030 ($ million)
Chart on Japan - Year-over-year growth 2025-2030 (%)
Data Table on Japan - Year-over-year growth 2025-2030 (%)

12.4.3 India - Market size and forecast 2025-2030

Chart on India - Market size and forecast 2025-2030 ($ million)
Data Table on India - Market size and forecast 2025-2030 ($ million)
Chart on India - Year-over-year growth 2025-2030 (%)
Data Table on India - Year-over-year growth 2025-2030 (%)

12.4.4 South Korea - Market size and forecast 2025-2030

Chart on South Korea - Market size and forecast 2025-2030 ($ million)
Data Table on South Korea - Market size and forecast 2025-2030 ($ million)
Chart on South Korea - Year-over-year growth 2025-2030 (%)
Data Table on South Korea - Year-over-year growth 2025-2030 (%)

12.4.5 Australia - Market size and forecast 2025-2030

Chart on Australia - Market size and forecast 2025-2030 ($ million)
Data Table on Australia - Market size and forecast 2025-2030 ($ million)
Chart on Australia - Year-over-year growth 2025-2030 (%)
Data Table on Australia - Year-over-year growth 2025-2030 (%)

12.4.6 Indonesia - Market size and forecast 2025-2030

Chart on Indonesia - Market size and forecast 2025-2030 ($ million)
Data Table on Indonesia - Market size and forecast 2025-2030 ($ million)
Chart on Indonesia - Year-over-year growth 2025-2030 (%)
Data Table on Indonesia - Year-over-year growth 2025-2030 (%)

12.5 Europe - Market size and forecast 2025-2030

Chart on Europe - Market size and forecast 2025-2030 ($ million)
Data Table on Europe - Market size and forecast 2025-2030 ($ million)
Chart on Europe - Year-over-year growth 2025-2030 (%)
Data Table on Europe - Year-over-year growth 2025-2030 (%)
Chart on Regional Comparison - Europe
Data Table on Regional Comparison - Europe

12.5.1 Germany - Market size and forecast 2025-2030

Chart on Germany - Market size and forecast 2025-2030 ($ million)
Data Table on Germany - Market size and forecast 2025-2030 ($ million)
Chart on Germany - Year-over-year growth 2025-2030 (%)
Data Table on Germany - Year-over-year growth 2025-2030 (%)

12.5.2 UK - Market size and forecast 2025-2030

Chart on UK - Market size and forecast 2025-2030 ($ million)
Data Table on UK - Market size and forecast 2025-2030 ($ million)
Chart on UK - Year-over-year growth 2025-2030 (%)
Data Table on UK - Year-over-year growth 2025-2030 (%)

12.5.3 France - Market size and forecast 2025-2030

Chart on France - Market size and forecast 2025-2030 ($ million)
Data Table on France - Market size and forecast 2025-2030 ($ million)
Chart on France - Year-over-year growth 2025-2030 (%)
Data Table on France - Year-over-year growth 2025-2030 (%)

12.5.4 Italy - Market size and forecast 2025-2030

Chart on Italy - Market size and forecast 2025-2030 ($ million)
Data Table on Italy - Market size and forecast 2025-2030 ($ million)
Chart on Italy - Year-over-year growth 2025-2030 (%)
Data Table on Italy - Year-over-year growth 2025-2030 (%)

12.5.5 Spain - Market size and forecast 2025-2030

Chart on Spain - Market size and forecast 2025-2030 ($ million)
Data Table on Spain - Market size and forecast 2025-2030 ($ million)
Chart on Spain - Year-over-year growth 2025-2030 (%)
Data Table on Spain - Year-over-year growth 2025-2030 (%)

12.5.6 The Netherlands - Market size and forecast 2025-2030

Chart on The Netherlands - Market size and forecast 2025-2030 ($ million)
Data Table on The Netherlands - Market size and forecast 2025-2030 ($ million)
Chart on The Netherlands - Year-over-year growth 2025-2030 (%)
Data Table on The Netherlands - Year-over-year growth 2025-2030 (%)

12.6 South America - Market size and forecast 2025-2030

Chart on South America - Market size and forecast 2025-2030 ($ million)
Data Table on South America - Market size and forecast 2025-2030 ($ million)
Chart on South America - Year-over-year growth 2025-2030 (%)
Data Table on South America - Year-over-year growth 2025-2030 (%)
Chart on Regional Comparison - South America
Data Table on Regional Comparison - South America

12.6.1 Brazil - Market size and forecast 2025-2030

Chart on Brazil - Market size and forecast 2025-2030 ($ million)
Data Table on Brazil - Market size and forecast 2025-2030 ($ million)
Chart on Brazil - Year-over-year growth 2025-2030 (%)
Data Table on Brazil - Year-over-year growth 2025-2030 (%)

12.6.2 Argentina - Market size and forecast 2025-2030

Chart on Argentina - Market size and forecast 2025-2030 ($ million)
Data Table on Argentina - Market size and forecast 2025-2030 ($ million)
Chart on Argentina - Year-over-year growth 2025-2030 (%)
Data Table on Argentina - Year-over-year growth 2025-2030 (%)

12.6.3 Colombia - Market size and forecast 2025-2030

Chart on Colombia - Market size and forecast 2025-2030 ($ million)
Data Table on Colombia - Market size and forecast 2025-2030 ($ million)
Chart on Colombia - Year-over-year growth 2025-2030 (%)
Data Table on Colombia - Year-over-year growth 2025-2030 (%)

12.7 Middle East and Africa - Market size and forecast 2025-2030

Chart on Middle East and Africa - Market size and forecast 2025-2030 ($ million)
Data Table on Middle East and Africa - Market size and forecast 2025-2030 ($ million)
Chart on Middle East and Africa - Year-over-year growth 2025-2030 (%)
Data Table on Middle East and Africa - Year-over-year growth 2025-2030 (%)
Chart on Regional Comparison - Middle East and Africa
Data Table on Regional Comparison - Middle East and Africa

12.7.1 Saudi Arabia - Market size and forecast 2025-2030

Chart on Saudi Arabia - Market size and forecast 2025-2030 ($ million)
Data Table on Saudi Arabia - Market size and forecast 2025-2030 ($ million)
Chart on Saudi Arabia - Year-over-year growth 2025-2030 (%)
Data Table on Saudi Arabia - Year-over-year growth 2025-2030 (%)

12.7.2 UAE - Market size and forecast 2025-2030

Chart on UAE - Market size and forecast 2025-2030 ($ million)
Data Table on UAE - Market size and forecast 2025-2030 ($ million)
Chart on UAE - Year-over-year growth 2025-2030 (%)
Data Table on UAE - Year-over-year growth 2025-2030 (%)

12.7.3 Turkey - Market size and forecast 2025-2030

Chart on Turkey - Market size and forecast 2025-2030 ($ million)
Data Table on Turkey - Market size and forecast 2025-2030 ($ million)
Chart on Turkey - Year-over-year growth 2025-2030 (%)
Data Table on Turkey - Year-over-year growth 2025-2030 (%)

12.7.4 Israel - Market size and forecast 2025-2030

Chart on Israel - Market size and forecast 2025-2030 ($ million)
Data Table on Israel - Market size and forecast 2025-2030 ($ million)
Chart on Israel - Year-over-year growth 2025-2030 (%)
Data Table on Israel - Year-over-year growth 2025-2030 (%)

12.7.5 South Africa - Market size and forecast 2025-2030

Chart on South Africa - Market size and forecast 2025-2030 ($ million)
Data Table on South Africa - Market size and forecast 2025-2030 ($ million)
Chart on South Africa - Year-over-year growth 2025-2030 (%)
Data Table on South Africa - Year-over-year growth 2025-2030 (%)

12.8 Market opportunity by geography

Market opportunity by geography ($ million)
Data Tables on Market opportunity by geography ($ million)

13. Drivers, Challenges, and Opportunity

13.1 Market drivers

Educational mandates and curriculum modernization accelerating institutional adoption
Rising parental preference for screen-free cognitive play and tangible learning
Technological advancements in modular robotics and scalable programming architectures

13.2 Market challenges

Prohibitive component costs and premium consumer price points
Software lifecycle obsolescence and hardware support discontinuation
Educator apprehension and inadequate institutional curriculum integration

13.3 Impact of drivers and challenges

Impact of drivers and challenges in 2025 and 2030

13.4 Market opportunities

Integration of conversational AI and natural language scripting
Gamified storytelling and transmedia intellectual property collaboration
Subscription-based digital ecosystems and continuous edutainment services

14. Competitive Landscape

14.1 Overview

14.2

Overview on criticality of inputs and factors of differentiation

14.3 Landscape disruption

Overview on factors of disruption

14.4 Industry risks

Impact of key risks on business

15. Competitive Analysis

15.1 Companies profiled

Companies covered

15.2 Company ranking index

15.3 Market positioning of companies

Matrix on companies position and classification

15.4 Avishkaar

Avishkaar - Overview
Avishkaar - Product / Service
Avishkaar - Key offerings
SWOT

15.5 CoderMindz

CoderMindz - Overview
CoderMindz - Product / Service
CoderMindz - Key offerings
SWOT

15.6 Loona Inc.

Loona Inc. - Overview
Loona Inc. - Product / Service
Loona Inc. - Key offerings
SWOT

15.7 Makeblock Co. Ltd.

Makeblock Co. Ltd. - Overview
Makeblock Co. Ltd. - Product / Service
Makeblock Co. Ltd. - Key offerings
SWOT

15.8 MATATALAB CO. LTD.

MATATALAB CO. LTD. - Overview
MATATALAB CO. LTD. - Product / Service
MATATALAB CO. LTD. - Key offerings
SWOT

15.9 Miko

Miko - Overview
Miko - Product / Service
Miko - Key offerings
SWOT

15.10 MORAVIA Consulting

MORAVIA Consulting - Overview
MORAVIA Consulting - Product / Service
MORAVIA Consulting - Key offerings
SWOT

15.11 Robokidz

Robokidz - Overview
Robokidz - Product / Service
Robokidz - Key offerings
SWOT

15.12 SAM Labs

SAM Labs - Overview
SAM Labs - Product / Service
SAM Labs - Key offerings
SWOT

15.13 Sphero Inc.

Sphero Inc. - Overview
Sphero Inc. - Product / Service
Sphero Inc. - Key offerings
SWOT

15.14 Tangible Play Inc.

Tangible Play Inc. - Overview
Tangible Play Inc. - Product / Service
Tangible Play Inc. - Key offerings
SWOT

15.15 Thames and Kosmos LLC

Thames and Kosmos LLC - Overview
Thames and Kosmos LLC - Product / Service
Thames and Kosmos LLC - Key offerings
SWOT

15.16 TIF Studio

TIF Studio - Overview
TIF Studio - Product / Service
TIF Studio - Key offerings
SWOT

15.17 UBTECH Education

UBTECH Education - Overview
UBTECH Education - Product / Service
UBTECH Education - Key offerings
SWOT

15.18 Upper Story LLC

Upper Story LLC - Overview
Upper Story LLC - Product / Service
Upper Story LLC - Key offerings
SWOT

16. Appendix

16.1 Scope of the report

Market definition
Objectives
Notes and caveats

16.2 Inclusions and exclusions checklist

Inclusions checklist
Exclusions checklist

16.3 Currency conversion rates for US$

16.4 Research methodology

16.5 Data procurement

Information sources

16.6 Data validation

16.7 Validation techniques employed for market sizing

16.8 Data synthesis

16.9 360 degree market analysis

16.10 List of abbreviations

Research Methodology

Technavio presents a detailed picture of the market by way of study, synthesis, and summation of data from multiple sources. The analysts have presented the various facets of the market with a particular focus on identifying the key industry influencers. The data thus presented is comprehensive, reliable, and the result of extensive research, both primary and secondary.

INFORMATION SOURCES

Primary sources

  • Manufacturers and suppliers
  • Channel partners
  • Industry experts
  • Strategic decision makers

Secondary sources

  • Industry journals and periodicals
  • Government data
  • Financial reports of key industry players
  • Historical data
  • Press releases

DATA ANALYSIS

Data Synthesis

  • Collation of data
  • Estimation of key figures
  • Analysis of derived insights

Data Validation

  • Triangulation with data models
  • Reference against proprietary databases
  • Corroboration with industry experts

REPORT WRITING

Qualitative

  • Market drivers
  • Market challenges
  • Market trends
  • Five forces analysis

Quantitative

  • Market size and forecast
  • Market segmentation
  • Geographical insights
  • Competitive landscape

Interested in this report?

Get your sample now to see our research methodology and insights!

Download Now

Frequently Asked Questions

Coding Toys market growth will increase by USD 1309.6 million during 2026-2030.

The Coding Toys market is expected to grow at a CAGR of 11.3% during 2026-2030.

Coding Toys market is segmented by Product type (Robotic coding toys, Electronic coding kits, Coding building kits, Coding board games, Others) End-user (Elementary school, Middle school, Preschool, High school) Distribution channel (Online, Offline)

Agilo Research Pvt. Ltd, Avishkaar, CoderMindz, Elegoo, fischertechnik, Loona Inc., Makeblock Co. Ltd., MATATALAB CO. LTD., Miko, MORAVIA Consulting, Ozo EDU Inc., Robokidz, SAM Labs, Sony Group Corp., Sphero Inc., Tangible Play Inc., Thames and Kosmos LLC, TIF Studio, UBTECH Education, Upper Story LLC are a few of the key vendors in the Coding Toys market.

APAC will register the highest growth rate of 35.4% among the other regions. Therefore, the Coding Toys market in APAC is expected to garner significant business opportunities for the vendors during the forecast period.

US, Canada, Mexico, China, Japan, India, South Korea, Australia, Indonesia, Germany, UK, France, Italy, Spain, The Netherlands, Brazil, Argentina, Colombia, Saudi Arabia, UAE, Turkey, Israel, South Africa

  • Educational mandates and curriculum modernization accelerating institutional adoption is the driving factor this market.

The Coding Toys market vendors should focus on grabbing business opportunities from the Product type segment as it accounted for the largest market share in the base year.
RIA - Research AI Assistant
Ask RIA
