Commercial Aircraft Cabin Interiors Market Size 2025-2029
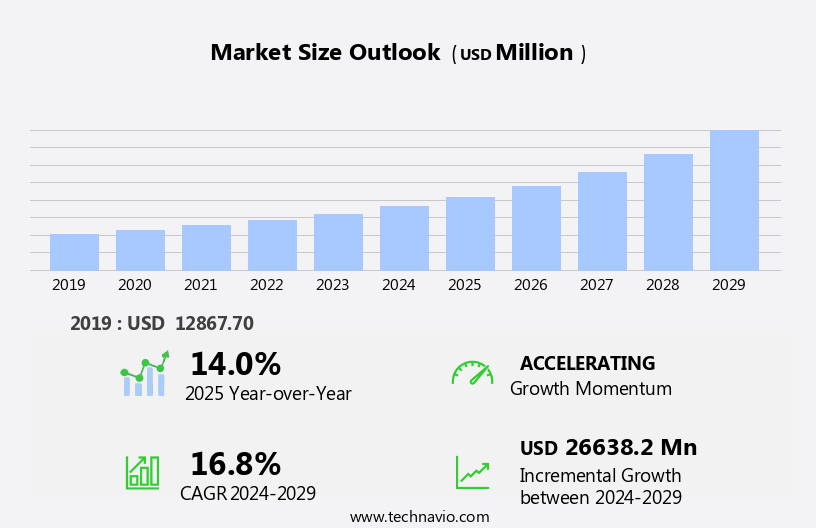
The commercial aircraft cabin interiors market size is forecast to increase by USD 26.64 billion at a CAGR of 16.8% between 2024 and 2029.
- The market is experiencing significant growth, driven primarily by the increasing preference for newer generation aircraft. These modern aircraft offer enhanced fuel efficiency, improved passenger comfort, and advanced technology integrations, making them increasingly popular among airlines. Moreover, the collaborative efforts in the aerospace industry are fostering innovation and efficiency, further boosting market expansion. However, the market faces challenges, most notably the delay in aircraft scheduled deliveries. This issue, in turn, impacts the cabin interiors market, as airlines may postpone or reduce orders due to uncertainty surrounding their fleet expansion plans. Additionally, the integration of artificial intelligence and machine learning technologies in avionic systems is a key trend, aiming to improve system performance and reduce maintenance costs.
- Regulatory hurdles also impact adoption, as stringent safety and environmental regulations necessitate extensive testing and certification processes. To capitalize on market opportunities and navigate these challenges effectively, companies must remain agile and responsive, focusing on innovation, collaboration, and flexibility. By addressing these challenges and leveraging emerging trends, players in the market can position themselves for long-term success.
What will be the Size of the Commercial Aircraft Cabin Interiors Market during the forecast period?
- The market is witnessing significant advancements, with a focus on enhancing passenger comfort and safety. Cabin safety features, such as emergency procedures and automated systems, are becoming increasingly important. Cabin automation systems, including predictive maintenance and cabin digital twins, are streamlining maintenance processes. Cabin humidity control, ventilation, and air filtration systems ensure a comfortable and healthy cabin environment. In-flight shopping, entertainment, and dining services are being augmented with technology, from high-speed internet and wi-fi connectivity to interactive entertainment systems and virtual reality. Compliance with cabin certification standards is crucial, as is the use of sustainable materials, such as recycled, bio-based, and composite materials.
- Cabin design software and human-machine interface are essential tools for creating ergonomic and accessible cabin designs. Lightweight materials, noise reduction, and personalized entertainment systems are other key trends shaping the market. Cabin accessibility features, noise cancellation, and cabin monitoring systems are also gaining importance. Overall, the market is evolving to meet the changing needs of passengers and regulatory requirements.
How is this Commercial Aircraft Cabin Interiors Industry segmented?
The commercial aircraft cabin interiors industry research report provides comprehensive data (region-wise segment analysis), with forecasts and estimates in "USD million" for the period 2025-2029, as well as historical data from 2019-2023 for the following segments.
- Product
- Seating
- Lavatory module
- Windows cabin panels and stowage bins
- Galley
- Lighting
- Type
- Narrow-body aircraft
- Wide-body aircraft
- Regional aircraft
- End-user
- OEM
- MRO
- Aftermarket
- Geography
- North America
- US
- Canada
- Europe
- France
- Germany
- Italy
- UK
- APAC
- China
- India
- Japan
- South America
- Brazil
- Rest of World (ROW)
- North America
By Product Insights
The seating segment is estimated to witness significant growth during the forecast period. The market encompasses various entities that contribute to enhancing the passenger experience. Cabin refurbishment and repair play a crucial role in maintaining the aesthetics and functionality of the aircraft. Cabin acoustics, ergonomics, and regulations ensure passenger comfort and safety. Cabin integrators and customization specialists offer tailored solutions for cabin design, layout, and amenities. In-flight services, such as entertainment, connectivity, and catering, add value to the overall travel experience. Cabin materials, engineering, and technology are continually evolving to improve durability, weight, and sustainability. Cabin certification and regulations ensure compliance with safety standards. Cabin training, mockups, and simulation enable efficient installation and maintenance. Cabin solutions cater to diverse passenger needs while ensuring safety, durability, and sustainability.
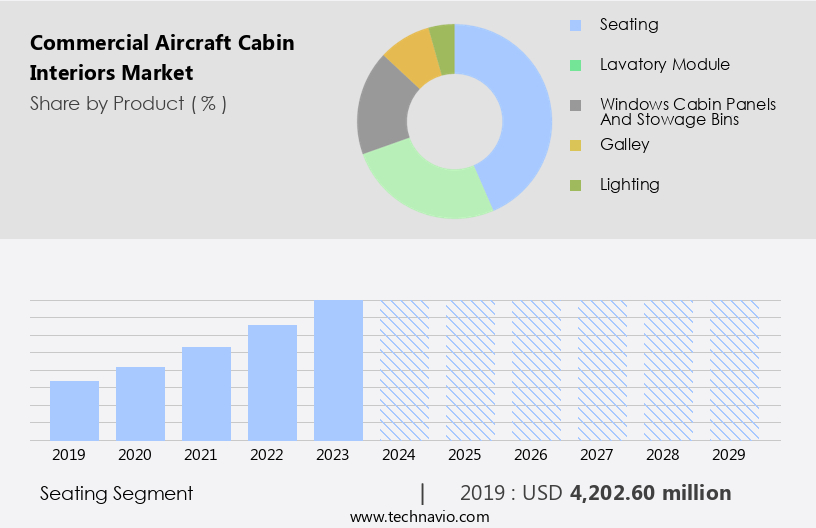
The Seating segment was valued at USD 4.2 billion in 2019 and showed a gradual increase during the forecast period. Cabin management systems, data analytics, and life cycle services optimize cabin performance and reduce downtime. Seating solutions offer adjustable features, power ports, and in-flight entertainment systems to cater to diverse passenger needs. Cabin trends include increased focus on passenger comfort, accessibility, air quality, and sustainability. Cabin manufacturers, consultants, and suppliers collaborate to provide innovative solutions for cabin design, engineering, and technology. Cabin trends include modernization, automation, and personalization. Cabin safety, evacuation, and fire safety are paramount considerations in cabin design and maintenance. The market is a dynamic and innovative industry that focuses on enhancing the passenger experience through advanced amenities, design, and technology.
Regional Analysis
Europe is estimated to contribute 37% to the growth of the global market during the forecast period. Technavio's analysts have elaborately explained the regional trends and drivers that shape the market during the forecast period.

The market encompasses various entities, including cabin refurbishment, cabin acoustics, cabin repair, passenger experience, cabin mockups, cabin training, cabin industry, cabin ergonomics, cabin integrators, cabin customization, cabin spare parts, cabin market, cabin storage, cabin design trends, in-flight services, cabin maintenance, cabin layout, in-flight connectivity, cabin regulations, aircraft seating, cabin management systems, cabin materials, cabin services, cabin engineering, cabin technology, cabin distributors, cabin data analytics, cabin life cycle, cabin entertainment, cabin amenities, cabin innovation, cabin design, cabin standards, cabin upgrade, passenger comfort, cabin sustainability, cabin interiors, cabin solutions, cabin certification, in-flight entertainment, cabin fire safety, cabin manufacturers, cabin consultants, cabin trends, cabin suppliers, cabin technology trends, cabin simulation, cabin sustainability trends, cabin accessibility, cabin air quality, cabin lighting, cabin research, cabin installers, cabin modernization, cabin safety, cabin automation, cabin weight, cabin personalization, and cabin durability.
The market for cabin interiors is a significant component of the commercial aviation industry, with a focus on enhancing passenger comfort and experience. Cabin refurbishment and repair are essential services to maintain the cabin's condition and extend its life cycle. Cabin acoustics play a crucial role in ensuring a quiet in-flight environment. Passenger experience is a top priority, with cabin design trends incorporating ergonomics, customization, and sustainability. Cabin integrators and suppliers offer cabin solutions that cater to various aircraft types and configurations. Cabin management systems and in-flight entertainment systems provide passengers with experiences and connectivity. In-flight services, such as catering and cabin cleaning, contribute to a positive passenger experience.
Cabin regulations and safety standards ensure that cabins meet the necessary requirements for passenger safety and comfort. Cabin materials and engineering play a significant role in cabin durability and weight reduction. Cabin technology trends include advanced cabin lighting, air quality systems, and cabin data analytics. Cabin innovation and design continue to evolve, with a focus on passenger comfort, accessibility, and sustainability. Cabin certification and regulations ensure that cabins meet the necessary safety and regulatory requirements. Cabin fire safety is a critical consideration in cabin design and materials. The cabin industry is a dynamic and competitive market, with major players including Boeing, Airbus, and Embraer.
The market is influenced by various factors, including passenger preferences, technological advancements, and regulatory requirements. The market is expected to continue growing, driven by increasing air travel demand and the need for cabin modernization and upgrades.
Market Dynamics
Our researchers analyzed the data with 2024 as the base year, along with the key drivers, trends, and challenges. A holistic analysis of drivers will help companies refine their marketing strategies to gain a competitive advantage.
What are the Commercial Aircraft Cabin Interiors market drivers leading to the rise in the adoption of Industry?
- The increasing demand for advanced aircraft models is the primary market catalyst. The market witnessed substantial growth in 2024, driven by the increasing demand for newer generation aircraft. These modern aircraft boast advanced technologies and materials that prioritize passenger comfort, operational efficiency, and sustainability. Airlines invest heavily in cabin refurbishment to cater to passengers' rising expectations for personalized and comfortable flight experiences. Lightweight, durable materials are adopted to improve fuel efficiency and reduce operational costs. Furthermore, advanced in-flight entertainment and connectivity systems, such as 4K screens and high-speed internet, have become standard features to engage and satisfy passengers. Cabin acoustics, ergonomics, and customization are essential considerations in cabin design trends.
- Cabin repair and maintenance, as well as the availability of spare parts, are crucial for ensuring optimal performance and passenger safety. Cabin integrators play a vital role in the cabin industry by providing cabin training and customization services to airlines. In-flight services, including meal and beverage offerings, are also essential components of the cabin experience. Overall, the market continues to evolve, prioritizing passenger comfort, operational efficiency, and technological innovation.
What are the Commercial Aircraft Cabin Interiors market trends shaping the Industry?
- The preference for collaborative efforts is increasingly becoming a trend in the aerospace industry. Professionals in this field recognize the value of partnerships and alliances to drive innovation and efficiency. The market is witnessing significant collaboration among industry players, driven by the need to innovate and cater to evolving passenger expectations. Partnerships between airlines, aircraft manufacturers, and interior design firms are focusing on integrating advanced technologies and materials to enhance passenger comfort and experience. For example, the use of lightweight, sustainable cabin materials is a key trend, as it reduces aircraft weight and improves fuel efficiency, while also providing aesthetically pleasing and functional cabin environments. Additionally, the development of sophisticated in-flight entertainment systems and smart cabin management solutions is a result of joint efforts between technology providers and airlines, ensuring seamless connectivity and personalized passenger experiences.
- Cabin maintenance, cabin layout, cabin regulations, aircraft seating, cabin management systems, cabin materials, cabin services, cabin engineering, cabin technology, cabin distributors, cabin data analytics, cabin life cycle, cabin entertainment, and cabin amenities are all areas of focus for these collaborative initiatives.
How does Commercial Aircraft Cabin Interiors market faces challenges face during its growth?
- The delay in scheduled aircraft deliveries poses a significant challenge to the industry's growth trajectory. The market is experiencing significant growth due to the increasing demand for cabin innovation and passenger comfort. Manufacturers of cabin components and sub-assemblies are under pressure to deliver high-quality products on time and within budget. This trend is driven by the growing passenger traffic and the need for fuel-efficient aircraft, particularly in emerging economies. Cabin design and sustainability are key considerations, with a focus on in-flight entertainment systems, cabin fire safety, and cabin certification. Cabin consultants and suppliers are working closely with airlines to provide cabin solutions that meet these requirements while maintaining the highest standards.
- The aviation industry is continually evolving, and cabin trends include advanced materials, modular designs, and improved ergonomics. These advancements are essential to meet the demands of passengers and ensure a safe and enjoyable flying experience.
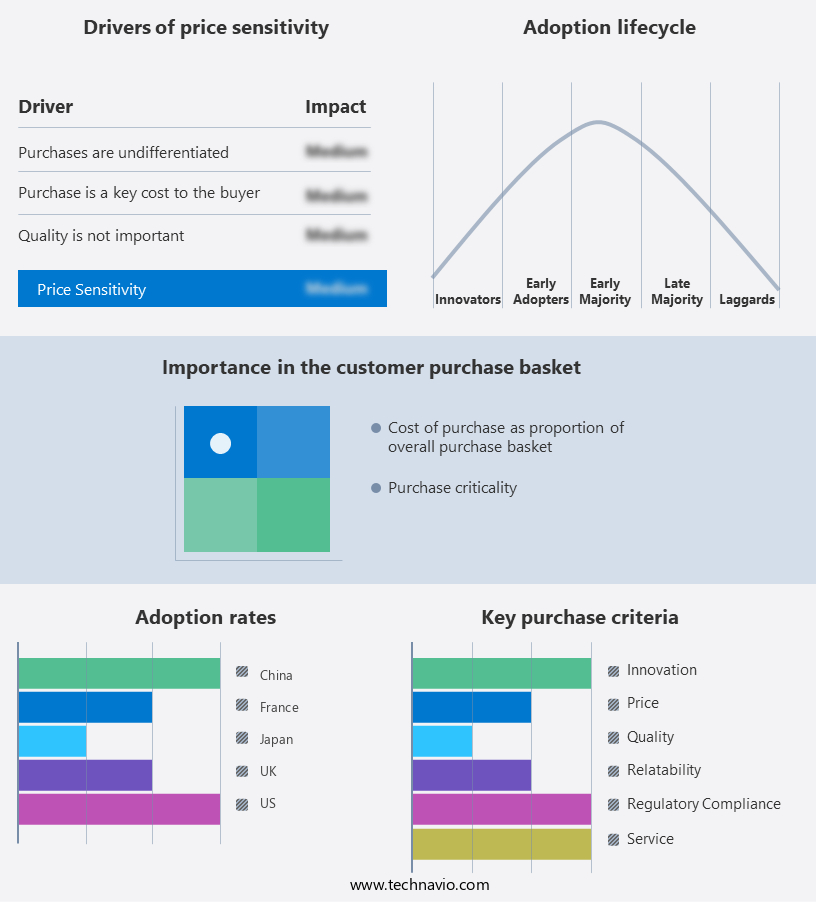
Exclusive Customer Landscape
The commercial aircraft cabin interiors market forecasting report includes the adoption lifecycle of the market, covering from the innovator's stage to the laggard's stage. It focuses on adoption rates in different regions based on penetration. Furthermore, the commercial aircraft cabin interiors market report also includes key purchase criteria and drivers of price sensitivity to help companies evaluate and develop their market growth analysis strategies.
Customer Landscape
Key Companies & Market Insights
Companies are implementing various strategies, such as strategic alliances, commercial aircraft cabin interiors market forecast, partnerships, mergers and acquisitions, geographical expansion, and product/service launches, to enhance their presence in the industry.
Astronics Corp. - This company specializes in the design and manufacture of advanced commercial aircraft cabin components.
The industry research and growth report includes detailed analyses of the competitive landscape of the market and information about key companies, including:
- Astronics Corp.
- AVIC Cabin Systems UK Ltd.
- Bucher Leichtbau AG
- Collins Aerospace
- Diehl Stiftung and Co. KG
- EnCore Corporate Inc.
- Expliseat SAS
- FACC AG
- Geven Spa
- Honeywell International Inc.
- Ipeco Holdings Ltd.
- JAMCO Corp.
- RECARO Holding GmbH
- Safran SA
- STELIA Aerospace
- STG Aerospace Ltd.
- Thales Group
- Thompson Aero Seating Ltd.
- Yokohama Rubber Co. Ltd.
- ZIM AIRCRAFT SEATING GmbH
Qualitative and quantitative analysis of companies has been conducted to help clients understand the wider business environment as well as the strengths and weaknesses of key industry players. Data is qualitatively analyzed to categorize companies as pure play, category-focused, industry-focused, and diversified; it is quantitatively analyzed to categorize companies as dominant, leading, strong, tentative, and weak.
Recent Development and News in Commercial Aircraft Cabin Interiors Market
- In February 2023, Boeing announced the launch of its new cabin interiors product line, the "Boeing Signature Cabin Flex," designed to offer airlines flexibility in configuring their cabins for various seating arrangements and passenger classes (Boeing, 2023). This new offering aims to cater to the evolving demands of the airline industry, focusing on customization and flexibility.
- In October 2024, Collins Aerospace, a leading supplier of cabin interiors, signed a strategic partnership with Lufthansa Technik to jointly develop and offer premium cabin solutions, integrating advanced technologies and design concepts (Collins Aerospace, 2024). This collaboration is expected to strengthen both companies' positions in the high-end market.
- In March 2025, United Technologies Corporation completed the acquisition of Spirit AeroSystems' cabin interiors business, expanding its portfolio and capabilities in this sector (United Technologies, 2025). The acquisition adds significant manufacturing capacity and expertise, enabling United Technologies to better serve its customers and compete more effectively in the market.
- In July 2025, the Federal Aviation Administration (FAA) approved the use of recycled materials in commercial aircraft cabin interiors, marking a significant shift towards more sustainable aviation practices (FAA, 2025). This regulatory approval is expected to encourage the adoption of eco-friendly cabin interiors, reducing the environmental impact of the aviation industry.
Research Analyst Overview
The market is a dynamic and evolving sector, characterized by continuous innovation and adaptation to meet the changing needs of passengers and regulatory requirements. Cabin maintenance, a crucial aspect of the market, ensures the longevity and functionality of cabin components. Cabin layouts are constantly evolving, with a focus on maximizing passenger comfort and experience through ergonomic design and personalization. In-flight connectivity, a key trend, enables passengers to stay connected and productive during their journey. Cabin regulations, stringent and comprehensive, dictate safety standards and guidelines for cabin materials, engineering, and technology. Aircraft seating, a significant investment for airlines, is undergoing transformative changes, with a shift towards more spacious and adjustable designs. Regulatory bodies, such as the Federal Aviation Administration (FAA), play a crucial role in market dynamics, implementing stringent regulations and certifications to ensure safety and compliance.
Cabin management systems streamline operations, ensuring efficient use of resources and enhancing the overall passenger experience. Cabin materials, from lightweight composites to sustainable alternatives, are a focus area for innovation, with an emphasis on durability, weight reduction, and sustainability. Cabin services, from in-flight meals to cabin crew training, are continually improving to meet the evolving demands of passengers. Cabin engineering and technology trends, from automation to data analytics, are shaping the future of cabin design and maintenance. The growing order books for next-generation aircraft from regional airlines are expected to fuel market growth. Cabin distributors and suppliers play a vital role in the market, providing cabin components and solutions to airlines and aircraft manufacturers.
Cabin data analytics, a burgeoning trend, offers valuable insights into cabin performance and passenger behavior, enabling proactive maintenance and personalized services. The cabin life cycle, from design to disposal, is a critical consideration for airlines and manufacturers, with a focus on maximizing value and minimizing waste. Cabin entertainment and amenities, from in-flight movies to premium cabin offerings, are a key differentiator for airlines, with a focus on enhancing the passenger experience and creating a competitive edge. Cabin innovation, driven by collaboration between airlines, manufacturers, and suppliers, is at the forefront of the market, with a focus on creating cabin interiors that are safe, sustainable, and passenger-centric. Flight management systems are essential for optimizing flight routes, monitoring fuel consumption, and managing aircraft performance.
Dive into Technavio's strong research methodology, blending expert interviews, extensive data synthesis, and validated models for unparalleled Commercial Aircraft Cabin Interiors Market insights. See full methodology.
|
Market Scope |
|
|
Report Coverage |
Details |
|
Page number |
227 |
|
Base year |
2024 |
|
Historic period |
2019-2023 |
|
Forecast period |
2025-2029 |
|
Growth momentum & CAGR |
Accelerate at a CAGR of 16.8% |
|
Market growth 2025-2029 |
USD 26.64 billion |
|
Market structure |
Fragmented |
|
YoY growth 2024-2025(%) |
14.0 |
|
Key countries |
US, UK, Canada, France, China, Japan, Germany, India, Italy, and Brazil |
|
Competitive landscape |
Leading Companies, Market Positioning of Companies, Competitive Strategies, and Industry Risks |
What are the Key Data Covered in this Commercial Aircraft Cabin Interiors Market Research and Growth Report?
- CAGR of the Commercial Aircraft Cabin Interiors industry during the forecast period
- Detailed information on factors that will drive the growth and forecasting between 2025 and 2029
- Precise estimation of the size of the market and its contribution of the industry in focus to the parent market
- Accurate predictions about upcoming growth and trends and changes in consumer behaviour
- Growth of the market across North America, Europe, APAC, South America, and Middle East and Africa
- Thorough analysis of the market's competitive landscape and detailed information about companies
- Comprehensive analysis of factors that will challenge the commercial aircraft cabin interiors market growth of industry companies
We can help! Our analysts can customize this commercial aircraft cabin interiors market research report to meet your requirements.
 RIA -
RIA - 
