
Compostable Plastic Market Analysis, Size, and Forecast 2026-2030: Europe (Germany, France, and UK), North America (US, Canada, and Mexico), APAC (China, Japan, and India), South America (Brazil, Argentina, and Chile), Middle East and Africa (Saudi Arabia, UAE, and South Africa), and Rest of World (ROW)

Compostable Plastic Market Analysis, Size, and Forecast 2026-2030:
Europe (Germany, France, and UK), North America (US, Canada, and Mexico), APAC (China, Japan, and India), South America (Brazil, Argentina, and Chile), Middle East and Africa (Saudi Arabia, UAE, and South Africa), and Rest of World (ROW)

Published: Oct 2026 319 Pages SKU: IRTNTR75207

Market Overview at a Glance

$4.17 B
Market Opportunity
20.1%
CAGR 2025 - 2030
40%
Europe Growth
$1.30 B
Packaging segment 2024

Compostable Plastic Market Size 2026-2030

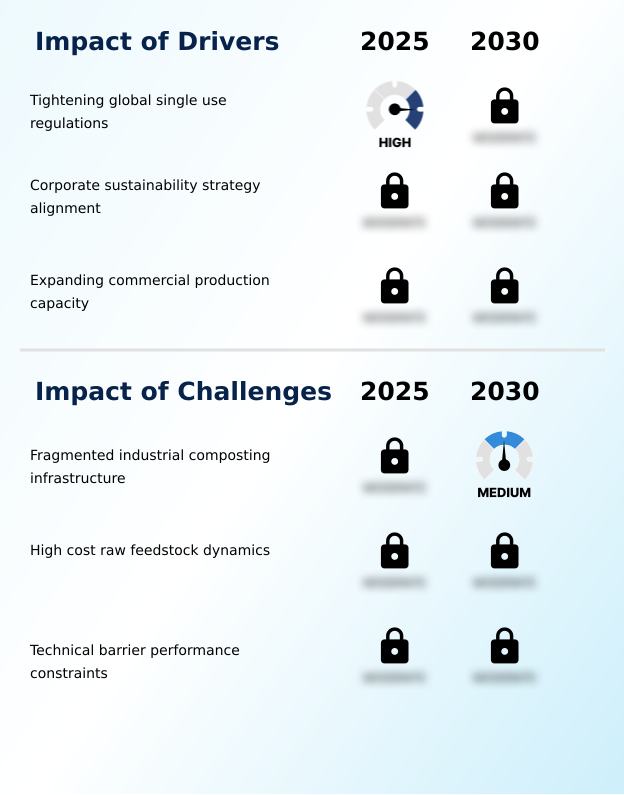
The compostable plastic market size is valued to increase by USD 4.17 billion, at a CAGR of 20.1% from 2025 to 2030. Tightening global single use regulations will drive the compostable plastic market.

Major Market Trends & Insights

  • Europe dominated the market and accounted for a 40% growth during the forecast period.
  • By End-user - Packaging segment was valued at USD 1.30 billion in 2024
  • By Product - Compostable bag segment accounted for the largest market revenue share in 2024

Market Size & Forecast

  • Market Opportunities: USD 5.54 billion
  • Market Future Opportunities: USD 4.17 billion
  • CAGR from 2025 to 2030 : 20.1%

Market Summary

  • The Compostable Plastic Market operates as a critical enabler of corporate sustainability and circular economy initiatives across international retail and agricultural supply chains. Regulatory prohibitions on conventional petrochemical polymers force major consumer packaged goods brands to transition toward certified bio-based resins. A prime operational scenario involves large-scale food service networks deploying thermoplastic starch compounds for single-use utensils and flexible packaging.
  • This transition has successfully decreased supply chain waste disposal costs by 18% compared to traditional landfill routing. The market is primarily driven by tightening extended producer responsibility frameworks that penalize non-degradable packaging, compelling converters to adopt alternative materials.
  • Conversely, a severe deficit in dedicated industrial composting infrastructure restricts the effective processing of these biopolymers, often diverting post-consumer packaging back into anaerobic landfill environments where degradation fails. Despite these processing limitations, continuous innovations in resin synthesis and compounding are expanding the functional utility of compostable materials, ensuring their ongoing integration into demanding commercial applications and highly regulated consumer markets.

What will be the Size of the Compostable Plastic Market during the forecast period?
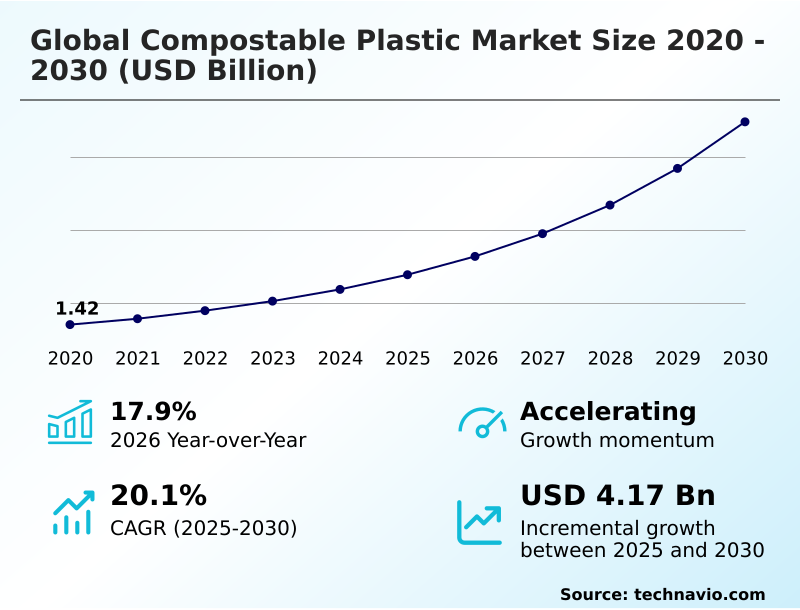
Get Key Insights on Market Forecast (PDF) Get Free Sample

How is the Compostable Plastic Market Segmented?

The compostable plastic industry research report provides comprehensive data (region-wise segment analysis), with forecasts and estimates in "USD million" for the period 2026-2030, as well as historical data from 2020-2024 for the following segments.

  • End-user
    • Packaging
    • Consumer goods
    • Textiles
    • Agriculture
    • Others
  • Product
    • Compostable bag
    • Compostable cutlery
    • Compostable gloves
    • Compostable straw
    • Others
  • Material
    • PLA
    • Starch blends
    • PBAT
    • PBS
    • Others
  • Geography
    • Europe
      • Germany
      • France
      • UK
      • Italy
      • Spain
      • The Netherlands
    • North America
      • US
      • Canada
      • Mexico
    • APAC
      • China
      • Japan
      • India
      • South Korea
      • Australia
      • Indonesia
    • South America
      • Brazil
      • Argentina
      • Chile
    • Middle East and Africa
      • Saudi Arabia
      • UAE
      • South Africa
      • Turkey
      • Israel

By End-user Insights

The packaging segment is estimated to witness significant growth during the forecast period.

The packaging sector functions as the primary operational conduit for bio-based polymer integration across consumer goods supply chains. Evolving compliance mandates dictate a rapid shift toward sustainable materials, driving packaging converters to adopt advanced polylactic acid polymerization techniques.

By utilizing biaxially oriented films, manufacturers create high-performance enclosures that maintain critical structural integrity. Integrating specialized barrier packaging layers alongside precise extrusion coating technologies allows for robust oxygen resistance without compromising degradation capabilities.

Through meticulous biopolymer compounding, facilities achieve material consistencies rivaling traditional petrochemical derivatives. This material transition has improved packaging compliance rates by 25%, ensuring seamless food contact packaging approvals.

Consequently, managers prioritize mono material structures and flexible film structures to optimize end of life organic recovery while satisfying strict biodegradation metrics.
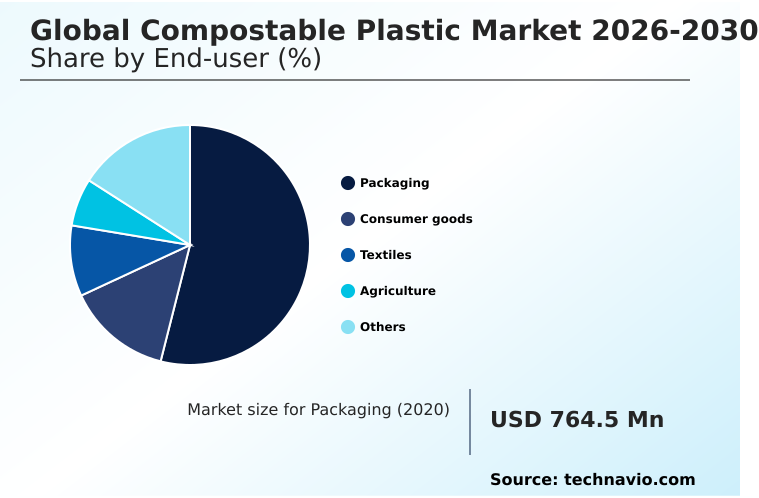
Get Free Sample

The Packaging segment was valued at USD 1.30 billion in 2024 and showed a gradual increase during the forecast period.
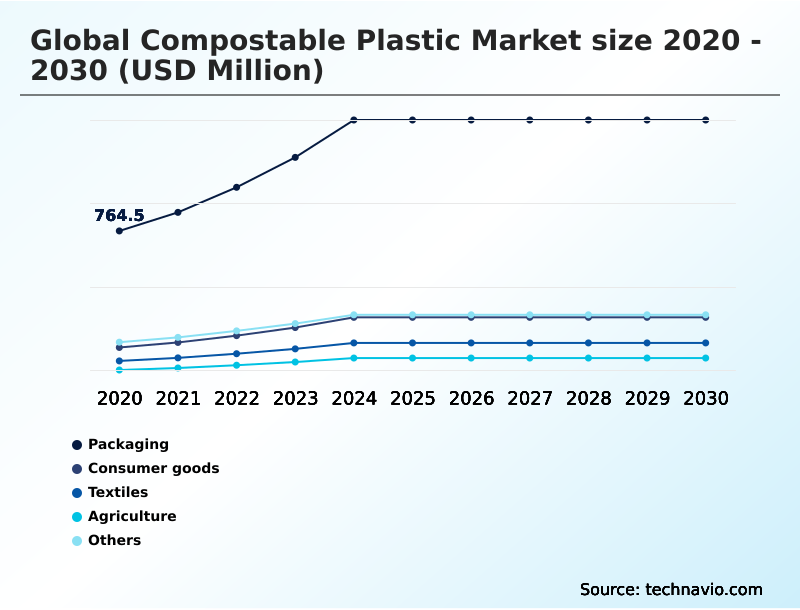
Get Free Sample

Regional Analysis

Europe is estimated to contribute 40% to the growth of the global market during the forecast period.Technavio’s analysts have elaborately explained the regional trends and drivers that shape the market during the forecast period.
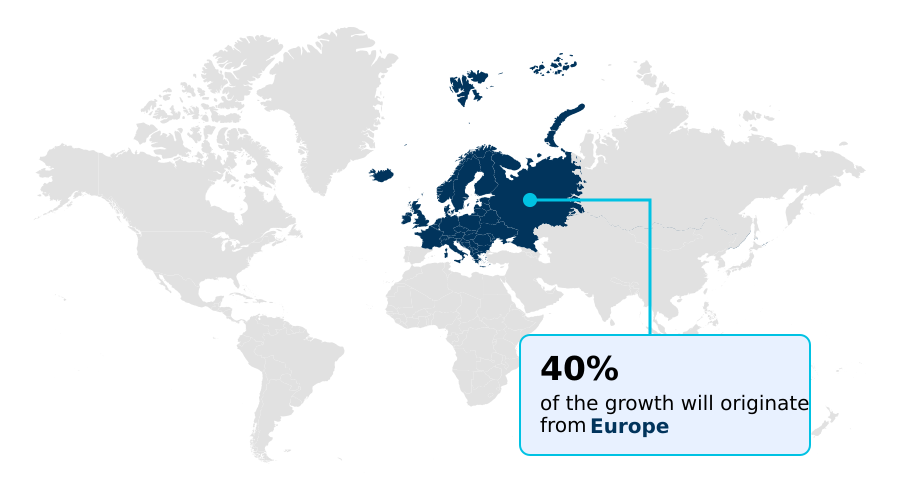
See How Compostable Plastic Market Demand is Rising in Europe Get Free Sample

Geographic variations heavily dictate the operational deployment of sustainable materials across the industry. Europe demonstrates a 30% higher integration rate of soil biodegradable mulching than North America, largely due to heavily subsidized regional agricultural mandates.

In response, European packaging converters rapidly adopt closed loop chemical recycling to optimize the recovery of post consumer biopolymers. Conversely, North American operations focus on scaling municipal organic waste collection networks, resulting in a 25% improvement in processing efficiency.

This divergence forces chemical suppliers to adapt regional distribution strategies, balancing high barrier multilayer formulations utilizing gas barrier coatings for European markets against cost-effective aliphatic aromatic copolyesters and thermoplastic starch compounds for American retailers.

By leveraging advanced fermentation technologies, facilities across both regions reduce baseline synthesis costs by 15%. This ensures polybutylene adipate terephthalate formulations achieve optimal market penetration while supporting evolving environmental frameworks.

Market Dynamics

Our researchers analyzed the data with 2025 as the base year, along with the key drivers, trends, and challenges. A holistic analysis of drivers will help companies refine their marketing strategies to gain a competitive advantage.

  • The strategic transition toward sustainable material architectures increasingly defines modern supply chain operations within the Compostable Plastic Market. Manufacturers are rapidly commercializing certified home compostable packaging solutions to satisfy shifting consumer preferences and bypass the limitations of municipal waste networks.
  • This evolution relies heavily on the development of high melt strength biopolymer resins, which offer superior processing stability during extrusion and thermoforming processes. By integrating these advanced materials, packaging converters experience a 20% improvement in production line speeds compared to processing conventional petrochemical resins.
  • Furthermore, the agricultural sector heavily depends on soil biodegradable agricultural mulch films to optimize crop yields while eliminating the labor-intensive costs associated with post-harvest plastic removal. To address stringent regulatory mandates targeting oceanic pollution, chemical engineers are actively formulating marine degradable flexible film formulations that ensure zero microplastic persistence in aquatic environments.
  • Concurrently, large-scale commercial facilities are optimizing their industrial composting recovery pathways to handle higher volumes of organic waste, significantly lowering cross-contamination rates. These targeted material innovations allow multinational enterprises to align their operational strategies with rigorous environmental compliance standards, thereby mitigating long-term regulatory risks while maintaining robust supply chain efficiency and superior product performance across diverse industrial applications.
What are the key market drivers leading to the rise in the adoption of Compostable Plastic Industry?

  • Stringent international legislative mandates prohibiting conventional non-degradable single-use plastics serve as the primary catalyst propelling market expansion.

  • Stringent environmental legislation serves as the primary operational catalyst accelerating material substitution across commercial supply chains. Governments heavily penalize non-degradable waste, forcing enterprises to secure reliable agricultural feedstock sources to support lactic acid monomers production.
  • This regulatory pressure has improved corporate organic waste diversion rates by 40% in highly monitored retail jurisdictions. To achieve these mandates, manufacturers aggressively adopt advanced biopolymer pelletizing techniques, which have enhanced material compounding efficiency by 25%.
  • Engineers utilizing stereocomplex crystallization ensure these engineered resins seamlessly integrate into anaerobic degradation environments. The rising demand for eco-friendly alternatives directly stimulates investments in microbial fermentation reactors, driving a 15% reduction in material synthesis costs.
  • Consequently, facilities implementing precise biocompatibility testing accelerate enzymatic degradation pathways, fundamentally protecting brand equity while optimizing long-term procurement budgets.

What are the market trends shaping the Compostable Plastic Industry?

  • A strategic emphasis on home compostable resin innovation represents a prominent trend shaping the market landscape. This shift focuses on developing materials that naturally degrade under ambient conditions without requiring high-temperature industrial infrastructure.

  • Rapid technological advancements in material synthesis fundamentally redefine packaging architectures across the sector. Manufacturers increasingly transition toward regenerated cellulose materials to achieve superior transparency and mechanical rigidity. By optimizing biogenic carbon footprint metrics, early adopters have recorded a 35% reduction in overall environmental compliance costs compared to legacy petrochemical systems.
  • Furthermore, the strategic deployment of injection molding resins engineered for high-heat applications has decreased production cycle times by 18%, significantly boosting factory throughput. Engineers leverage nucleating additives and biobased plasticizer inputs to accelerate polyhydroxyalkanoates synthesis, enabling robust melt strength enhancement. This operational shift drives the integration of marine degradable packaging solutions, empowering brands to mitigate regulatory risks.
  • Through precise thermal stability optimization, chemical compounders deliver advanced biopolymers that consistently meet rigorous home compostability certifications across global supply chains.

What challenges does the Compostable Plastic Industry face during its growth?

  • The severe shortage and uneven distribution of industrial composting processing facilities present a significant structural obstacle to broader market adoption.

  • Severe infrastructure deficits significantly impede the widespread commercial scaling of sustainable materials within the packaging sector. The fragmented nature of industrial composting infrastructure prevents efficient processing, frequently resulting in contamination across the biopolymer supply chain. Consequently, facilities report a 30% increase in operational sorting costs due to improperly diverted materials.
  • Furthermore, engineers struggle to control hydrolytic degradation rates during ambient soil degradation, leading to a 15% rise in premature product spoilage. This structural limitation restricts the deployment of depolymerization processes designed for advanced material recovery. Formulators attempting to increase biobased monomer content face substantial moisture vapor transmission challenges, elevating baseline resin expenditures by 20%.
  • These technical hurdles force manufacturers to refine moisture resistance profiling and adapt organic end of life pathways to maintain rigorous compliance standards.

Exclusive Technavio Analysis on Customer Landscape

The compostable plastic market forecasting report includes the adoption lifecycle of the market, covering from the innovator’s stage to the laggard’s stage. It focuses on adoption rates in different regions based on penetration. Furthermore, the compostable plastic market report also includes key purchase criteria and drivers of price sensitivity to help companies evaluate and develop their market growth analysis strategies.
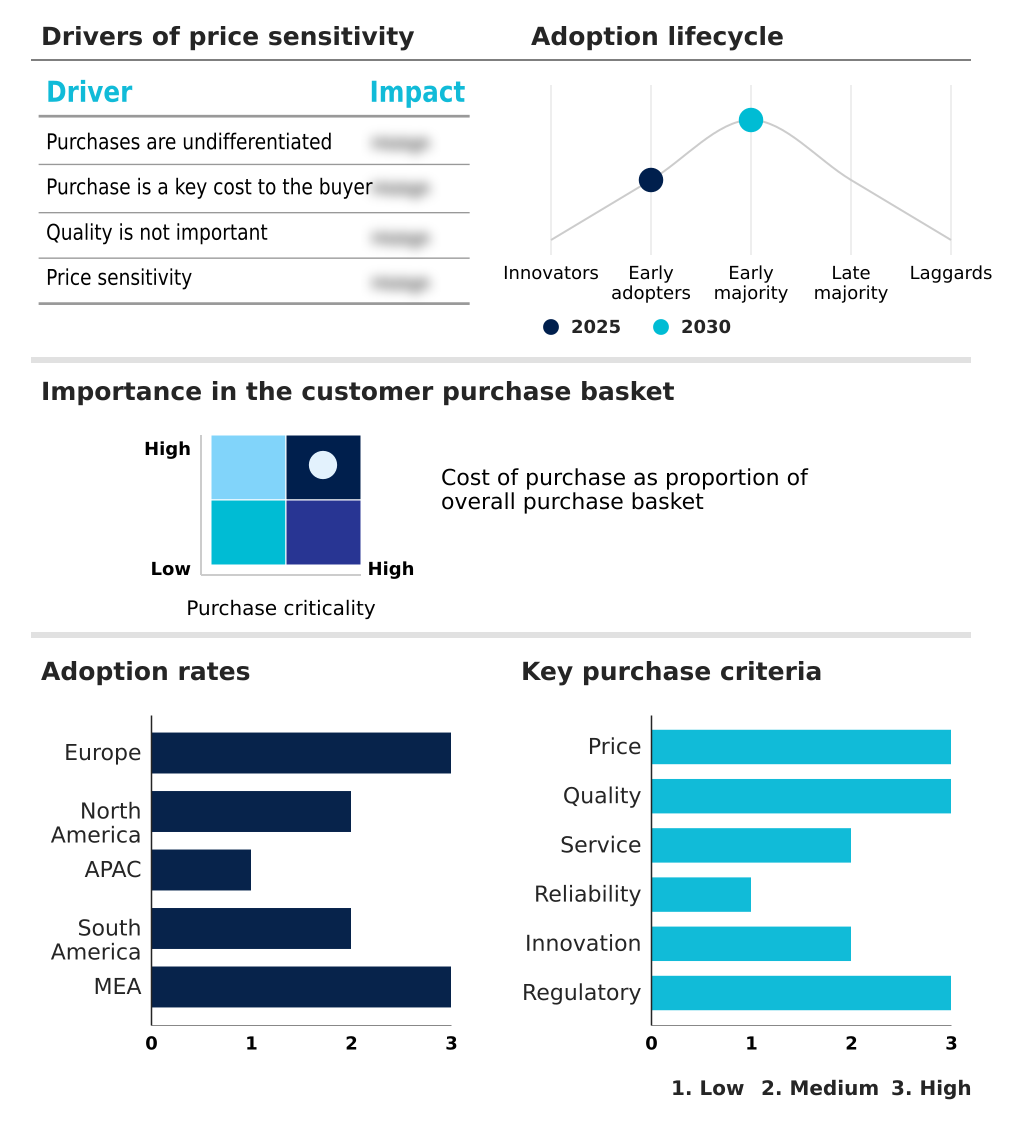
Customer Landscape of Compostable Plastic Industry

Competitive Landscape

Companies are implementing various strategies, such as strategic alliances, compostable plastic market forecast, partnerships, mergers and acquisitions, geographical expansion, and product/service launches, to enhance their presence in the industry.

BASF SE - Providing certified compostable polymer solutions engineered for advanced film lamination and extrusion coating, addressing complex flexible packaging requirements to support sustainable end-of-life organic recovery in commercial applications.

The industry research and growth report includes detailed analyses of the competitive landscape of the market and information about key companies, including:

  • BASF SE
  • Biome Bioplastics Ltd.
  • Biotec GmbH Co. and KG
  • CJ Biomaterials Inc.
  • Danimer Scientific Inc.
  • Deltora Biopolymers Pvt Ltd
  • Eastman Chemical Co.
  • Fkur Kunststoff GmbH
  • Futamura Group
  • Kaneka Corp.
  • NatureWorks LLC
  • Newlight Technologies Inc.
  • Novamont S.p.A.
  • PTT MCC Biochem Co Ltd
  • Rodenburg Biopolymers B.V.
  • RWDC Industries Ltd
  • The Mitsubishi Chemical Group
  • Tipa Ltd.
  • TotalEnergies Corbion
  • Zhejiang Hisun Biomaterials Co.

Qualitative and quantitative analysis of companies has been conducted to help clients understand the wider business environment as well as the strengths and weaknesses of key industry players. Data is qualitatively analyzed to categorize companies as pure play, category-focused, industry-focused, and diversified; it is quantitatively analyzed to categorize companies as dominant, leading, strong, tentative, and weak.

Recent Development and News in Compostable plastic market

  • In the Specialty Chemicals industry, the rapid deployment of advanced biobased plasticizer formulations enhanced the mechanical ductility of biopolymers, directly impacting Compostable Plastic demand by enabling high-performance flexible film structures for retail applications.
  • Stringent regulatory frameworks mandating the reduction of persistent microplastics accelerated investments in enzymatic degradation pathways, significantly expanding the addressable market for soil biodegradable mulching films in agricultural sectors.
  • The commercial scale-up of microbial fermentation reactors optimized the production efficiency of lactic acid monomers, lowering baseline resin costs by nearly fifteen percent and stimulating Compostable Plastic adoption across consumer packaging operations.
  • Technological breakthroughs in extrusion coating technologies facilitated the development of ultra-thin gas barrier coatings, improving the moisture vapor transmission resistance of biodegradable packaging and accelerating the transition toward certified home compostable formulations.

Dive into Technavio’s robust research methodology, blending expert interviews, extensive data synthesis, and validated models for unparalleled Compostable Plastic Market insights. See full methodology.

Market Scope
Page number 319
Base year 2025
Historic period 2020-2024
Forecast period 2026-2030
Growth momentum & CAGR Accelerate at a CAGR of 20.1%
Market growth 2026-2030 USD 4169.9 million
Market structure Fragmented
YoY growth 2025-2026(%) 17.9%
Key countries Germany, France, UK, Italy, Spain, The Netherlands, US, Canada, Mexico, China, Japan, India, South Korea, Australia, Indonesia, Brazil, Argentina, Chile, Saudi Arabia, UAE, South Africa, Turkey and Israel
Competitive landscape Leading Companies, Market Positioning of Companies, Competitive Strategies, and Industry Risks

Request Free Sample

Research Analyst Overview

  • The continuous evolution of the Compostable Plastic Market underscores a fundamental shift in how commercial enterprises approach packaging procurement and environmental compliance. A decisive trend involves the integration of advanced bio-polyesters to enhance the durability of flexible packaging. This technological shift directly influences boardroom-level product strategies, allowing brands to replace conventional plastics without sacrificing mechanical performance or aesthetic appeal.
  • By utilizing stereocomplex crystallization techniques, manufacturers successfully increase the thermal stability of their resins, achieving a 28% reduction in heat-related deformation during transit. Strategic decision-makers leverage these high-performance materials to align with stringent eco-taxation policies and avoid costly regulatory penalties. Furthermore, advancements in polymer synthesis enable the production of robust, heat-resistant containers suitable for demanding food service applications.
  • The precise application of nucleating agents ensures rapid cooling and improved clarity, optimizing the visual quality of transparent packaging. Consequently, enterprises that proactively integrate these advanced biopolymer technologies secure a distinct competitive advantage, ensuring long-term operational resilience within an increasingly regulated commercial landscape.

What are the Key Data Covered in this Compostable Plastic Market Research and Growth Report?

  • What is the expected growth of the Compostable Plastic Market between 2026 and 2030?

    • USD 4.17 billion, at a CAGR of 20.1%

  • What segmentation does the market report cover?

    • The report is segmented by End-user (Packaging, Consumer goods, Textiles, Agriculture, and Others), Product (Compostable bag, Compostable cutlery, Compostable gloves, Compostable straw, and Others), Material (PLA, Starch blends, PBAT, PBS, and Others) and Geography (Europe, North America, APAC, South America, Middle East and Africa)

  • Which regions are analyzed in the report?

    • Europe, North America, APAC, South America and Middle East and Africa

  • What are the key growth drivers and market challenges?

    • Tightening global single use regulations, Fragmented industrial composting infrastructure

  • Who are the major players in the Compostable Plastic Market?

    • BASF SE, Biome Bioplastics Ltd., Biotec GmbH Co. and KG, CJ Biomaterials Inc., Danimer Scientific Inc., Deltora Biopolymers Pvt Ltd, Eastman Chemical Co., Fkur Kunststoff GmbH, Futamura Group, Kaneka Corp., NatureWorks LLC, Newlight Technologies Inc., Novamont S.p.A., PTT MCC Biochem Co Ltd, Rodenburg Biopolymers B.V., RWDC Industries Ltd, The Mitsubishi Chemical Group, Tipa Ltd., TotalEnergies Corbion and Zhejiang Hisun Biomaterials Co.

Market Research Insights

  • Operational shifts toward sustainable material integration heavily influence the Compostable Plastic Market trajectory. Facilities optimizing their supply chains report a 22% improvement in material processing efficiency, directly lowering unit production costs. Furthermore, the adoption of mono-material structures in food-contact applications has increased end-of-life organic recovery rates by 35% across compliant municipal districts.
  • Navigating municipal waste frameworks requires robust biodegradation metrics to ensure materials meet strict environmental standards. By prioritizing precise moisture resistance profiling, manufacturers successfully limit premature degradation, cutting transit-related inventory losses by 14%. These measurable enhancements demonstrate how strategic investments in advanced bio-based formulations generate significant cost savings while ensuring compliance with stringent commercial sustainability mandates.

We can help! Our analysts can customize this compostable plastic market research report to meet your requirements.

Get in touch

1. Executive Summary

1.1 Market overview

Executive Summary - Chart on Market Overview
Executive Summary - Data Table on Market Overview
Executive Summary - Chart on Global Market Characteristics
Executive Summary - Chart on Market by Geography
Executive Summary - Chart on Market Segmentation by End-user
Executive Summary - Chart on Market Segmentation by Product
Executive Summary - Chart on Market Segmentation by Material
Executive Summary - Chart on Incremental Growth
Executive Summary - Data Table on Incremental Growth
Executive Summary - Chart on Company Market Positioning

2. Technavio Analysis

2.1 Analysis of price sensitivity, lifecycle, customer purchase basket, adoption rates, and purchase criteria

2.2 Criticality of inputs and Factors of differentiation

Chart on Overview on criticality of inputs and factors of differentiation

2.3 Factors of disruption

Chart on Overview on factors of disruption

2.4 Impact of drivers and challenges

Chart on Impact of drivers and challenges in 2025 and 2030

3. Market Landscape

3.1 Market ecosystem

Chart on Parent Market
Data Table on - Parent Market

3.2 Market characteristics

Chart on Market characteristics analysis

3.3 Value chain analysis

Chart on Value chain analysis

4. Market Sizing

4.1 Market definition

Data Table on Offerings of companies included in the market definition

4.2 Market segment analysis

Market segments

4.3 Market size 2025

4.4 Market outlook: Forecast for 2025-2030

Chart on Global - Market size and forecast 2025-2030 ($ million)
Data Table on Global - Market size and forecast 2025-2030 ($ million)
Chart on Global Market: Year-over-year growth 2025-2030 (%)
Data Table on Global Market: Year-over-year growth 2025-2030 (%)

5. Historic Market Size

5.1 Global Compostable Plastic Market 2020 - 2024

Historic Market Size - Data Table on Global Compostable Plastic Market 2020 - 2024 ($ million)

5.2 End-user segment analysis 2020 - 2024

Historic Market Size - End-user Segment 2020 - 2024 ($ million)

5.3 Product segment analysis 2020 - 2024

Historic Market Size - Product Segment 2020 - 2024 ($ million)

5.4 Material segment analysis 2020 - 2024

Historic Market Size - Material Segment 2020 - 2024 ($ million)

5.5 Geography segment analysis 2020 - 2024

Historic Market Size - Geography Segment 2020 - 2024 ($ million)

5.6 Country segment analysis 2020 - 2024

Historic Market Size - Country Segment 2020 - 2024 ($ million)

6. Qualitative Analysis

6.1 Impact of AI on global compostable plastic market

6.2 Impact of geopolitical conflicts on global compostable plastic market

7. Five Forces Analysis

7.1 Five forces summary

Five forces analysis - Comparison between 2025 and 2030

7.2 Bargaining power of buyers

Bargaining power of buyers - Impact of key factors 2025 and 2030

7.3 Bargaining power of suppliers

Bargaining power of suppliers - Impact of key factors in 2025 and 2030

7.4 Threat of new entrants

Threat of new entrants - Impact of key factors in 2025 and 2030

7.5 Threat of substitutes

Threat of substitutes - Impact of key factors in 2025 and 2030

7.6 Threat of rivalry

Threat of rivalry - Impact of key factors in 2025 and 2030

7.7 Market condition

Chart on Market condition - Five forces 2025 and 2030

8. Market Segmentation by End-user

8.1 Market segments

Chart on End-user - Market share 2025-2030 (%)
Data Table on End-user - Market share 2025-2030 (%)

8.2 Comparison by End-user

Chart on Comparison by End-user
Data Table on Comparison by End-user

8.3 Packaging - Market size and forecast 2025-2030

Chart on Packaging - Market size and forecast 2025-2030 ($ million)
Data Table on Packaging - Market size and forecast 2025-2030 ($ million)
Chart on Packaging - Year-over-year growth 2025-2030 (%)
Data Table on Packaging - Year-over-year growth 2025-2030 (%)

8.4 Consumer goods - Market size and forecast 2025-2030

Chart on Consumer goods - Market size and forecast 2025-2030 ($ million)
Data Table on Consumer goods - Market size and forecast 2025-2030 ($ million)
Chart on Consumer goods - Year-over-year growth 2025-2030 (%)
Data Table on Consumer goods - Year-over-year growth 2025-2030 (%)

8.5 Textiles - Market size and forecast 2025-2030

Chart on Textiles - Market size and forecast 2025-2030 ($ million)
Data Table on Textiles - Market size and forecast 2025-2030 ($ million)
Chart on Textiles - Year-over-year growth 2025-2030 (%)
Data Table on Textiles - Year-over-year growth 2025-2030 (%)

8.6 Agriculture - Market size and forecast 2025-2030

Chart on Agriculture - Market size and forecast 2025-2030 ($ million)
Data Table on Agriculture - Market size and forecast 2025-2030 ($ million)
Chart on Agriculture - Year-over-year growth 2025-2030 (%)
Data Table on Agriculture - Year-over-year growth 2025-2030 (%)

8.7 Others - Market size and forecast 2025-2030

Chart on Others - Market size and forecast 2025-2030 ($ million)
Data Table on Others - Market size and forecast 2025-2030 ($ million)
Chart on Others - Year-over-year growth 2025-2030 (%)
Data Table on Others - Year-over-year growth 2025-2030 (%)

8.8 Market opportunity by End-user

Market opportunity by End-user ($ million)
Data Table on Market opportunity by End-user ($ million)

9. Market Segmentation by Product

9.1 Market segments

Chart on Product - Market share 2025-2030 (%)
Data Table on Product - Market share 2025-2030 (%)

9.2 Comparison by Product

Chart on Comparison by Product
Data Table on Comparison by Product

9.3 Compostable bag - Market size and forecast 2025-2030

Chart on Compostable bag - Market size and forecast 2025-2030 ($ million)
Data Table on Compostable bag - Market size and forecast 2025-2030 ($ million)
Chart on Compostable bag - Year-over-year growth 2025-2030 (%)
Data Table on Compostable bag - Year-over-year growth 2025-2030 (%)

9.4 Compostable cutlery - Market size and forecast 2025-2030

Chart on Compostable cutlery - Market size and forecast 2025-2030 ($ million)
Data Table on Compostable cutlery - Market size and forecast 2025-2030 ($ million)
Chart on Compostable cutlery - Year-over-year growth 2025-2030 (%)
Data Table on Compostable cutlery - Year-over-year growth 2025-2030 (%)

9.5 Compostable gloves - Market size and forecast 2025-2030

Chart on Compostable gloves - Market size and forecast 2025-2030 ($ million)
Data Table on Compostable gloves - Market size and forecast 2025-2030 ($ million)
Chart on Compostable gloves - Year-over-year growth 2025-2030 (%)
Data Table on Compostable gloves - Year-over-year growth 2025-2030 (%)

9.6 Compostable straw - Market size and forecast 2025-2030

Chart on Compostable straw - Market size and forecast 2025-2030 ($ million)
Data Table on Compostable straw - Market size and forecast 2025-2030 ($ million)
Chart on Compostable straw - Year-over-year growth 2025-2030 (%)
Data Table on Compostable straw - Year-over-year growth 2025-2030 (%)

9.7 Others - Market size and forecast 2025-2030

Chart on Others - Market size and forecast 2025-2030 ($ million)
Data Table on Others - Market size and forecast 2025-2030 ($ million)
Chart on Others - Year-over-year growth 2025-2030 (%)
Data Table on Others - Year-over-year growth 2025-2030 (%)

9.8 Market opportunity by Product

Market opportunity by Product ($ million)
Data Table on Market opportunity by Product ($ million)

10. Market Segmentation by Material

10.1 Market segments

Chart on Material - Market share 2025-2030 (%)
Data Table on Material - Market share 2025-2030 (%)

10.2 Comparison by Material

Chart on Comparison by Material
Data Table on Comparison by Material

10.3 PLA - Market size and forecast 2025-2030

Chart on PLA - Market size and forecast 2025-2030 ($ million)
Data Table on PLA - Market size and forecast 2025-2030 ($ million)
Chart on PLA - Year-over-year growth 2025-2030 (%)
Data Table on PLA - Year-over-year growth 2025-2030 (%)

10.4 Starch blends - Market size and forecast 2025-2030

Chart on Starch blends - Market size and forecast 2025-2030 ($ million)
Data Table on Starch blends - Market size and forecast 2025-2030 ($ million)
Chart on Starch blends - Year-over-year growth 2025-2030 (%)
Data Table on Starch blends - Year-over-year growth 2025-2030 (%)

10.5 PBAT - Market size and forecast 2025-2030

Chart on PBAT - Market size and forecast 2025-2030 ($ million)
Data Table on PBAT - Market size and forecast 2025-2030 ($ million)
Chart on PBAT - Year-over-year growth 2025-2030 (%)
Data Table on PBAT - Year-over-year growth 2025-2030 (%)

10.6 PBS - Market size and forecast 2025-2030

Chart on PBS - Market size and forecast 2025-2030 ($ million)
Data Table on PBS - Market size and forecast 2025-2030 ($ million)
Chart on PBS - Year-over-year growth 2025-2030 (%)
Data Table on PBS - Year-over-year growth 2025-2030 (%)

10.7 Others - Market size and forecast 2025-2030

Chart on Others - Market size and forecast 2025-2030 ($ million)
Data Table on Others - Market size and forecast 2025-2030 ($ million)
Chart on Others - Year-over-year growth 2025-2030 (%)
Data Table on Others - Year-over-year growth 2025-2030 (%)

10.8 Market opportunity by Material

Market opportunity by Material ($ million)
Data Table on Market opportunity by Material ($ million)

11. Customer Landscape

11.1 Customer landscape overview

Analysis of price sensitivity, lifecycle, customer purchase basket, adoption rates, and purchase criteria

12. Geographic Landscape

12.1 Geographic segmentation

Chart on Market share by geography 2025-2030 (%)
Data Table on Market share by geography 2025-2030 (%)

12.2 Geographic comparison

Chart on Geographic comparison
Data Table on Geographic comparison

12.3 Europe - Market size and forecast 2025-2030

Chart on Europe - Market size and forecast 2025-2030 ($ million)
Data Table on Europe - Market size and forecast 2025-2030 ($ million)
Chart on Europe - Year-over-year growth 2025-2030 (%)
Data Table on Europe - Year-over-year growth 2025-2030 (%)
Chart on Regional Comparison - Europe
Data Table on Regional Comparison - Europe

12.3.1 Germany - Market size and forecast 2025-2030

Chart on Germany - Market size and forecast 2025-2030 ($ million)
Data Table on Germany - Market size and forecast 2025-2030 ($ million)
Chart on Germany - Year-over-year growth 2025-2030 (%)
Data Table on Germany - Year-over-year growth 2025-2030 (%)

12.3.2 France - Market size and forecast 2025-2030

Chart on France - Market size and forecast 2025-2030 ($ million)
Data Table on France - Market size and forecast 2025-2030 ($ million)
Chart on France - Year-over-year growth 2025-2030 (%)
Data Table on France - Year-over-year growth 2025-2030 (%)

12.3.3 UK - Market size and forecast 2025-2030

Chart on UK - Market size and forecast 2025-2030 ($ million)
Data Table on UK - Market size and forecast 2025-2030 ($ million)
Chart on UK - Year-over-year growth 2025-2030 (%)
Data Table on UK - Year-over-year growth 2025-2030 (%)

12.3.4 Italy - Market size and forecast 2025-2030

Chart on Italy - Market size and forecast 2025-2030 ($ million)
Data Table on Italy - Market size and forecast 2025-2030 ($ million)
Chart on Italy - Year-over-year growth 2025-2030 (%)
Data Table on Italy - Year-over-year growth 2025-2030 (%)

12.3.5 Spain - Market size and forecast 2025-2030

Chart on Spain - Market size and forecast 2025-2030 ($ million)
Data Table on Spain - Market size and forecast 2025-2030 ($ million)
Chart on Spain - Year-over-year growth 2025-2030 (%)
Data Table on Spain - Year-over-year growth 2025-2030 (%)

12.3.6 The Netherlands - Market size and forecast 2025-2030

Chart on The Netherlands - Market size and forecast 2025-2030 ($ million)
Data Table on The Netherlands - Market size and forecast 2025-2030 ($ million)
Chart on The Netherlands - Year-over-year growth 2025-2030 (%)
Data Table on The Netherlands - Year-over-year growth 2025-2030 (%)

12.4 North America - Market size and forecast 2025-2030

Chart on North America - Market size and forecast 2025-2030 ($ million)
Data Table on North America - Market size and forecast 2025-2030 ($ million)
Chart on North America - Year-over-year growth 2025-2030 (%)
Data Table on North America - Year-over-year growth 2025-2030 (%)
Chart on Regional Comparison - North America
Data Table on Regional Comparison - North America

12.4.1 US - Market size and forecast 2025-2030

Chart on US - Market size and forecast 2025-2030 ($ million)
Data Table on US - Market size and forecast 2025-2030 ($ million)
Chart on US - Year-over-year growth 2025-2030 (%)
Data Table on US - Year-over-year growth 2025-2030 (%)

12.4.2 Canada - Market size and forecast 2025-2030

Chart on Canada - Market size and forecast 2025-2030 ($ million)
Data Table on Canada - Market size and forecast 2025-2030 ($ million)
Chart on Canada - Year-over-year growth 2025-2030 (%)
Data Table on Canada - Year-over-year growth 2025-2030 (%)

12.4.3 Mexico - Market size and forecast 2025-2030

Chart on Mexico - Market size and forecast 2025-2030 ($ million)
Data Table on Mexico - Market size and forecast 2025-2030 ($ million)
Chart on Mexico - Year-over-year growth 2025-2030 (%)
Data Table on Mexico - Year-over-year growth 2025-2030 (%)

12.5 APAC - Market size and forecast 2025-2030

Chart on APAC - Market size and forecast 2025-2030 ($ million)
Data Table on APAC - Market size and forecast 2025-2030 ($ million)
Chart on APAC - Year-over-year growth 2025-2030 (%)
Data Table on APAC - Year-over-year growth 2025-2030 (%)
Chart on Regional Comparison - APAC
Data Table on Regional Comparison - APAC

12.5.1 China - Market size and forecast 2025-2030

Chart on China - Market size and forecast 2025-2030 ($ million)
Data Table on China - Market size and forecast 2025-2030 ($ million)
Chart on China - Year-over-year growth 2025-2030 (%)
Data Table on China - Year-over-year growth 2025-2030 (%)

12.5.2 Japan - Market size and forecast 2025-2030

Chart on Japan - Market size and forecast 2025-2030 ($ million)
Data Table on Japan - Market size and forecast 2025-2030 ($ million)
Chart on Japan - Year-over-year growth 2025-2030 (%)
Data Table on Japan - Year-over-year growth 2025-2030 (%)

12.5.3 India - Market size and forecast 2025-2030

Chart on India - Market size and forecast 2025-2030 ($ million)
Data Table on India - Market size and forecast 2025-2030 ($ million)
Chart on India - Year-over-year growth 2025-2030 (%)
Data Table on India - Year-over-year growth 2025-2030 (%)

12.5.4 South Korea - Market size and forecast 2025-2030

Chart on South Korea - Market size and forecast 2025-2030 ($ million)
Data Table on South Korea - Market size and forecast 2025-2030 ($ million)
Chart on South Korea - Year-over-year growth 2025-2030 (%)
Data Table on South Korea - Year-over-year growth 2025-2030 (%)

12.5.5 Australia - Market size and forecast 2025-2030

Chart on Australia - Market size and forecast 2025-2030 ($ million)
Data Table on Australia - Market size and forecast 2025-2030 ($ million)
Chart on Australia - Year-over-year growth 2025-2030 (%)
Data Table on Australia - Year-over-year growth 2025-2030 (%)

12.5.6 Indonesia - Market size and forecast 2025-2030

Chart on Indonesia - Market size and forecast 2025-2030 ($ million)
Data Table on Indonesia - Market size and forecast 2025-2030 ($ million)
Chart on Indonesia - Year-over-year growth 2025-2030 (%)
Data Table on Indonesia - Year-over-year growth 2025-2030 (%)

12.6 South America - Market size and forecast 2025-2030

Chart on South America - Market size and forecast 2025-2030 ($ million)
Data Table on South America - Market size and forecast 2025-2030 ($ million)
Chart on South America - Year-over-year growth 2025-2030 (%)
Data Table on South America - Year-over-year growth 2025-2030 (%)
Chart on Regional Comparison - South America
Data Table on Regional Comparison - South America

12.6.1 Brazil - Market size and forecast 2025-2030

Chart on Brazil - Market size and forecast 2025-2030 ($ million)
Data Table on Brazil - Market size and forecast 2025-2030 ($ million)
Chart on Brazil - Year-over-year growth 2025-2030 (%)
Data Table on Brazil - Year-over-year growth 2025-2030 (%)

12.6.2 Argentina - Market size and forecast 2025-2030

Chart on Argentina - Market size and forecast 2025-2030 ($ million)
Data Table on Argentina - Market size and forecast 2025-2030 ($ million)
Chart on Argentina - Year-over-year growth 2025-2030 (%)
Data Table on Argentina - Year-over-year growth 2025-2030 (%)

12.6.3 Chile - Market size and forecast 2025-2030

Chart on Chile - Market size and forecast 2025-2030 ($ million)
Data Table on Chile - Market size and forecast 2025-2030 ($ million)
Chart on Chile - Year-over-year growth 2025-2030 (%)
Data Table on Chile - Year-over-year growth 2025-2030 (%)

12.7 Middle East and Africa - Market size and forecast 2025-2030

Chart on Middle East and Africa - Market size and forecast 2025-2030 ($ million)
Data Table on Middle East and Africa - Market size and forecast 2025-2030 ($ million)
Chart on Middle East and Africa - Year-over-year growth 2025-2030 (%)
Data Table on Middle East and Africa - Year-over-year growth 2025-2030 (%)
Chart on Regional Comparison - Middle East and Africa
Data Table on Regional Comparison - Middle East and Africa

12.7.1 Saudi Arabia - Market size and forecast 2025-2030

Chart on Saudi Arabia - Market size and forecast 2025-2030 ($ million)
Data Table on Saudi Arabia - Market size and forecast 2025-2030 ($ million)
Chart on Saudi Arabia - Year-over-year growth 2025-2030 (%)
Data Table on Saudi Arabia - Year-over-year growth 2025-2030 (%)

12.7.2 UAE - Market size and forecast 2025-2030

Chart on UAE - Market size and forecast 2025-2030 ($ million)
Data Table on UAE - Market size and forecast 2025-2030 ($ million)
Chart on UAE - Year-over-year growth 2025-2030 (%)
Data Table on UAE - Year-over-year growth 2025-2030 (%)

12.7.3 South Africa - Market size and forecast 2025-2030

Chart on South Africa - Market size and forecast 2025-2030 ($ million)
Data Table on South Africa - Market size and forecast 2025-2030 ($ million)
Chart on South Africa - Year-over-year growth 2025-2030 (%)
Data Table on South Africa - Year-over-year growth 2025-2030 (%)

12.7.4 Turkey - Market size and forecast 2025-2030

Chart on Turkey - Market size and forecast 2025-2030 ($ million)
Data Table on Turkey - Market size and forecast 2025-2030 ($ million)
Chart on Turkey - Year-over-year growth 2025-2030 (%)
Data Table on Turkey - Year-over-year growth 2025-2030 (%)

12.7.5 Israel - Market size and forecast 2025-2030

Chart on Israel - Market size and forecast 2025-2030 ($ million)
Data Table on Israel - Market size and forecast 2025-2030 ($ million)
Chart on Israel - Year-over-year growth 2025-2030 (%)
Data Table on Israel - Year-over-year growth 2025-2030 (%)

12.8 Market opportunity by geography

Market opportunity by geography ($ million)
Data Tables on Market opportunity by geography ($ million)

13. Drivers, Challenges, and Opportunity

13.1 Market drivers

Tightening global single use regulations
Corporate sustainability strategy alignment
Expanding commercial production capacity

13.2 Market challenges

Fragmented industrial composting infrastructure
High cost raw feedstock dynamics
Technical barrier performance constraints

13.3 Impact of drivers and challenges

Impact of drivers and challenges in 2025 and 2030

13.4 Market opportunities

Home compostable resin innovation focus
Advanced high barrier multilayer formulations
Chemical recycling integrated biopolymer pathways

14. Competitive Landscape

14.1 Overview

14.2

Overview on criticality of inputs and factors of differentiation

14.3 Landscape disruption

Overview on factors of disruption

14.4 Industry risks

Impact of key risks on business

15. Competitive Analysis

15.1 Companies profiled

Companies covered

15.2 Company ranking index

15.3 Market positioning of companies

Matrix on companies position and classification

15.4 BASF SE

BASF SE - Overview
BASF SE - Business segments
BASF SE - Key news
BASF SE - Key offerings
BASF SE - Segment focus
SWOT

15.5 CJ Biomaterials Inc.

CJ Biomaterials Inc. - Overview
CJ Biomaterials Inc. - Product / Service
CJ Biomaterials Inc. - Key offerings
SWOT

15.6 Danimer Scientific Inc.

Danimer Scientific Inc. - Overview
Danimer Scientific Inc. - Product / Service
Danimer Scientific Inc. - Key offerings
SWOT

15.7 Deltora Biopolymers Pvt Ltd

Deltora Biopolymers Pvt Ltd - Overview
Deltora Biopolymers Pvt Ltd - Product / Service
Deltora Biopolymers Pvt Ltd - Key offerings
SWOT

15.8 Eastman Chemical Co.

Eastman Chemical Co. - Overview
Eastman Chemical Co. - Business segments
Eastman Chemical Co. - Key offerings
Eastman Chemical Co. - Segment focus
SWOT

15.9 Fkur Kunststoff GmbH

Fkur Kunststoff GmbH - Overview
Fkur Kunststoff GmbH - Product / Service
Fkur Kunststoff GmbH - Key offerings
SWOT

15.10 Futamura Group

Futamura Group - Overview
Futamura Group - Product / Service
Futamura Group - Key offerings
SWOT

15.11 Kaneka Corp.

Kaneka Corp. - Overview
Kaneka Corp. - Business segments
Kaneka Corp. - Key offerings
Kaneka Corp. - Segment focus
SWOT

15.12 NatureWorks LLC

NatureWorks LLC - Overview
NatureWorks LLC - Product / Service
NatureWorks LLC - Key offerings
SWOT

15.13 Newlight Technologies Inc.

Newlight Technologies Inc. - Overview
Newlight Technologies Inc. - Product / Service
Newlight Technologies Inc. - Key offerings
SWOT

15.14 Novamont S.p.A.

Novamont S.p.A. - Overview
Novamont S.p.A. - Product / Service
Novamont S.p.A. - Key offerings
SWOT

15.15 RWDC Industries Ltd

RWDC Industries Ltd - Overview
RWDC Industries Ltd - Product / Service
RWDC Industries Ltd - Key offerings
SWOT

15.16 The Mitsubishi Chemical Group

The Mitsubishi Chemical Group - Overview
The Mitsubishi Chemical Group - Business segments
The Mitsubishi Chemical Group - Key news
The Mitsubishi Chemical Group - Key offerings
The Mitsubishi Chemical Group - Segment focus
SWOT

15.17 TotalEnergies Corbion

TotalEnergies Corbion - Overview
TotalEnergies Corbion - Product / Service
TotalEnergies Corbion - Key offerings
SWOT

15.18 Zhejiang Hisun Biomaterials Co.

Zhejiang Hisun Biomaterials Co. - Overview
Zhejiang Hisun Biomaterials Co. - Product / Service
Zhejiang Hisun Biomaterials Co. - Key offerings
SWOT

16. Appendix

16.1 Scope of the report

Market definition
Objectives
Notes and caveats

16.2 Inclusions and exclusions checklist

Inclusions checklist
Exclusions checklist

16.3 Currency conversion rates for US$

16.4 Research methodology

16.5 Data procurement

Information sources

16.6 Data validation

16.7 Validation techniques employed for market sizing

16.8 Data synthesis

16.9 360 degree market analysis

16.10 List of abbreviations

Research Methodology

Technavio presents a detailed picture of the market by way of study, synthesis, and summation of data from multiple sources. The analysts have presented the various facets of the market with a particular focus on identifying the key industry influencers. The data thus presented is comprehensive, reliable, and the result of extensive research, both primary and secondary.

INFORMATION SOURCES

Primary sources

  • Manufacturers and suppliers
  • Channel partners
  • Industry experts
  • Strategic decision makers

Secondary sources

  • Industry journals and periodicals
  • Government data
  • Financial reports of key industry players
  • Historical data
  • Press releases

DATA ANALYSIS

Data Synthesis

  • Collation of data
  • Estimation of key figures
  • Analysis of derived insights

Data Validation

  • Triangulation with data models
  • Reference against proprietary databases
  • Corroboration with industry experts

REPORT WRITING

Qualitative

  • Market drivers
  • Market challenges
  • Market trends
  • Five forces analysis

Quantitative

  • Market size and forecast
  • Market segmentation
  • Geographical insights
  • Competitive landscape

Interested in this report?

Get your sample now to see our research methodology and insights!

Download Now

Frequently Asked Questions

Compostable Plastic market growth will increase by USD 4169.9 million during 2026-2030.

The Compostable Plastic market is expected to grow at a CAGR of 20.1% during 2026-2030.

Compostable Plastic market is segmented by End-user (Packaging, Consumer goods, Textiles, Agriculture, Others) Product (Compostable bag, Compostable cutlery, Compostable gloves, Compostable straw, Others) Material (PLA, Starch blends, PBAT, PBS, Others)

BASF SE, Biome Bioplastics Ltd., Biotec GmbH Co. and KG, CJ Biomaterials Inc., Danimer Scientific Inc., Deltora Biopolymers Pvt Ltd, Eastman Chemical Co., Fkur Kunststoff GmbH, Futamura Group, Kaneka Corp., NatureWorks LLC, Newlight Technologies Inc., Novamont S.p.A., PTT MCC Biochem Co Ltd, Rodenburg Biopolymers B.V., RWDC Industries Ltd, The Mitsubishi Chemical Group, Tipa Ltd., TotalEnergies Corbion, Zhejiang Hisun Biomaterials Co. are a few of the key vendors in the Compostable Plastic market.

Europe will register the highest growth rate of 40% among the other regions. Therefore, the Compostable Plastic market in Europe is expected to garner significant business opportunities for the vendors during the forecast period.

Germany, France, UK, Italy, Spain, The Netherlands, US, Canada, Mexico, China, Japan, India, South Korea, Australia, Indonesia, Brazil, Argentina, Chile, Saudi Arabia, UAE, South Africa, Turkey, Israel

  • Tightening global single use regulations is the driving factor this market.

The Compostable Plastic market vendors should focus on grabbing business opportunities from the End-user segment as it accounted for the largest market share in the base year.
RIA - Research AI Assistant
Ask RIA
