Compression Therapy Market Size 2025-2029
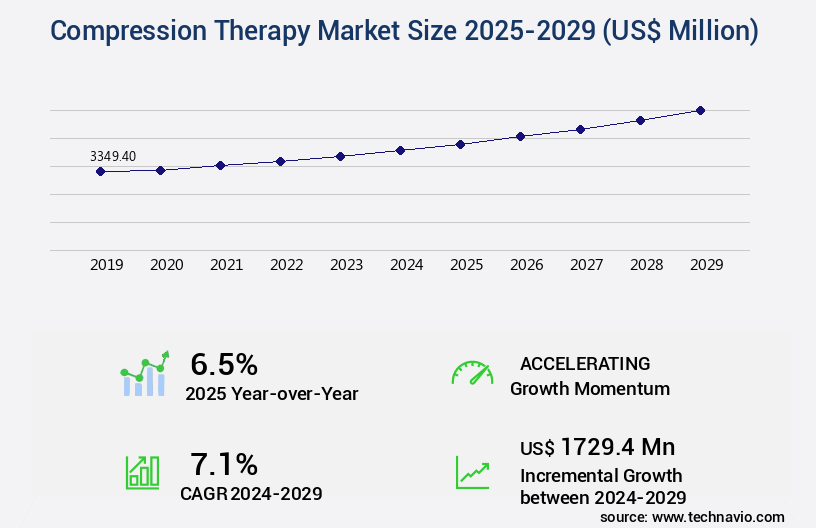
The compression therapy market size is valued to increase USD 1.73 billion, at a CAGR of 7.1% from 2024 to 2029. Increasing prevalence of chronic venous diseases and lymphedema will drive the compression therapy market.
Major Market Trends & Insights
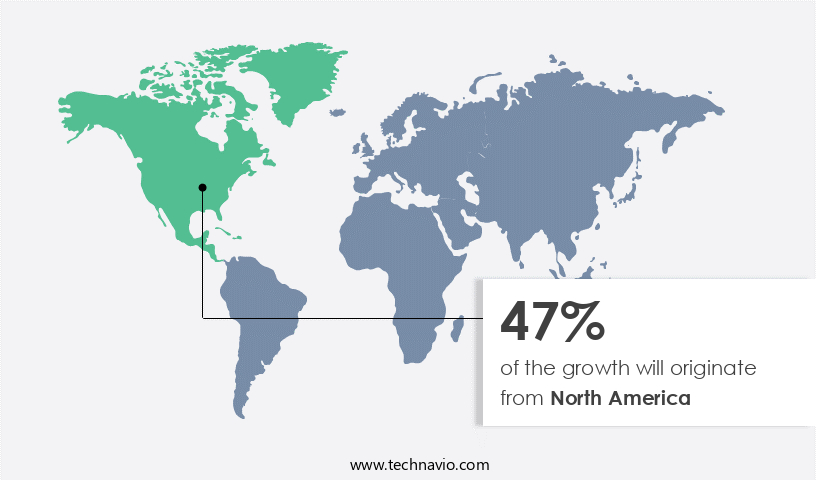
- North America dominated the market and accounted for a 47% growth during the forecast period.
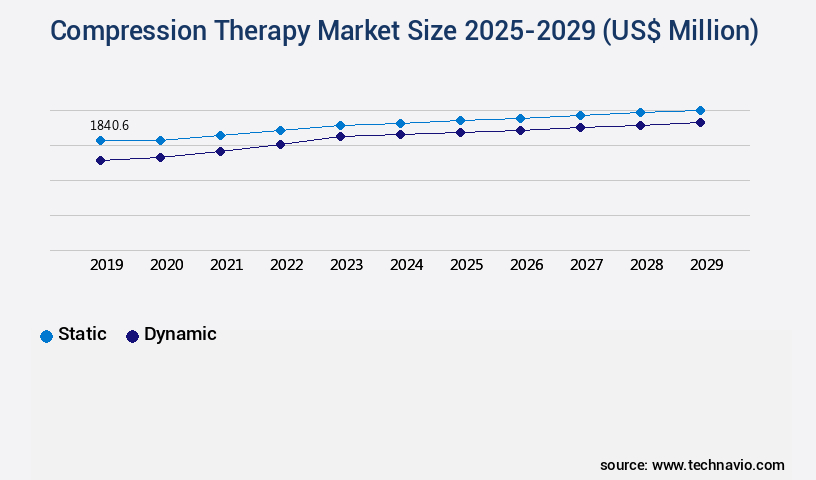
- By Therapy - Static segment was valued at USD 1.84 billion in 2023
- By Technology - Compression bandages segment accounted for the largest market revenue share in 2023
Market Size & Forecast
- Market Opportunities: USD 78.07 million
- Market Future Opportunities: USD 1729.40 million
- CAGR : 7.1%
- North America: Largest market in 2023
Market Summary
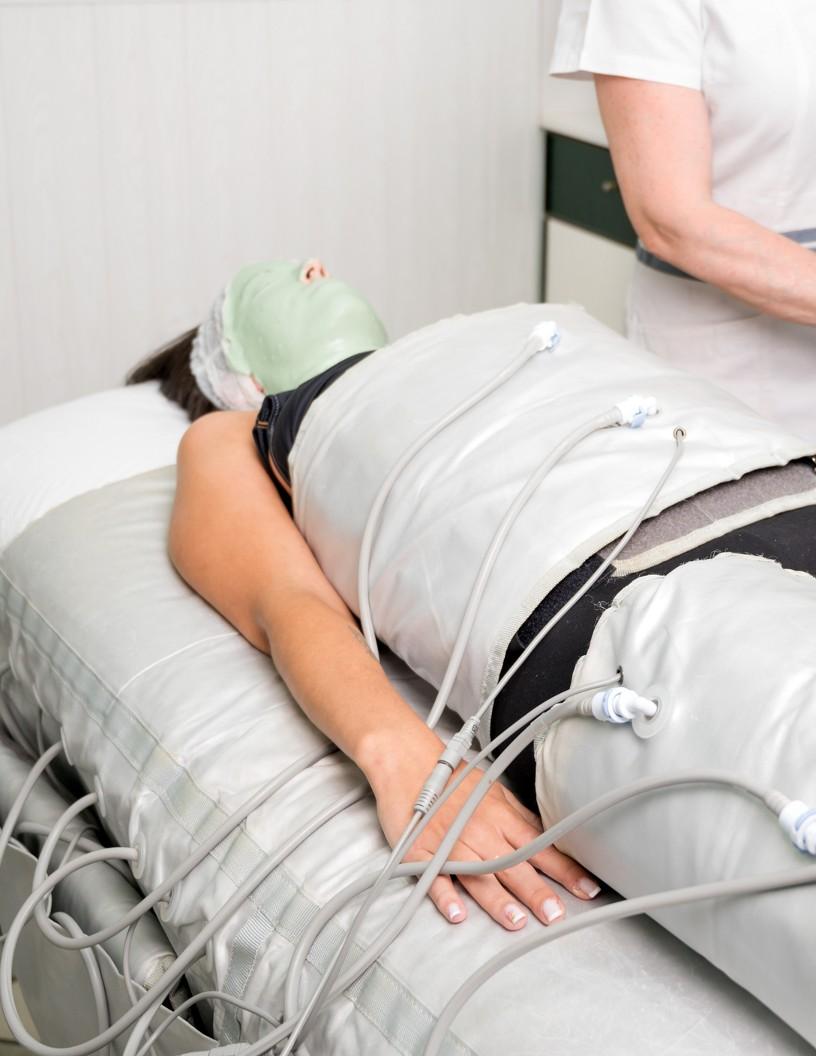
- The market encompasses a continually evolving landscape shaped by advancements in core medical technologies and applications. With the increasing prevalence of chronic venous diseases and lymphedema, the demand for customized compression therapy solutions tailored to individual patient needs is on the rise. Core technologies, such as multilayer bandaging and pneumatic air compression devices, are driving innovation in this market. However, limited reimbursement coverage for compression therapy poses a significant challenge. Despite this, opportunities abound, particularly in the development of wearable compression devices and telemedicine solutions.
- For instance, according to a market study, the wearable compression devices segment is projected to grow at a steady rate, accounting for over 30% of the total market share. This underscores the ongoing transformation of the market, where innovation and adaptation are the keys to success.
What will be the Size of the Compression Therapy Market during the forecast period?
Get Key Insights on Market Forecast (PDF) Request Free Sample
How is the Compression Therapy Market Segmented and what are the key trends of market segmentation?
The compression therapy industry research report provides comprehensive data (region-wise segment analysis), with forecasts and estimates in "USD million" for the period 2025-2029, as well as historical data from 2019-2023 for the following segments.
- Therapy
- Static
- Dynamic
- Technology
- Compression bandages
- Compression stocking
- Compression pumps
- Compression tapes
- Application
- Medical
- Sports
- Orthopedic
- End-user
- Hospitals and clinics
- Home care
- Sports academies
- Rehabilitation centers
- Geography
- North America
- US
- Canada
- Europe
- France
- Germany
- Italy
- UK
- APAC
- China
- India
- Japan
- South Korea
- Rest of World (ROW)
- North America
By Therapy Insights
The static segment is estimated to witness significant growth during the forecast period.
In the market, static compression therapy held a significant market share in 2024. This method employs continuous pressure on an afflicted limb, often through elastic stockings, wraps, or medical bandages, to minimize swelling and boost circulation. Static compression therapy is beneficial for individuals dealing with chronic venous insufficiency and varicose veins, alleviating discomfort and promoting tissue perfusion. However, its success hinges on proper application by trained professionals and may pose challenges for specific patient demographics, such as older individuals with multiple health concerns. Furthermore, intermittent pneumatic compression therapy has emerged as a promising alternative. This technique involves inflating and deflating air chambers in sequential order to mimic the natural pumping action of the muscles.
Intermittent pneumatic compression is advantageous for patients with peripheral artery disease, pressure ulcers, and edema, as it facilitates venous return, enhances microcirculation, and accelerates wound healing. Moreover, compression therapy plays a crucial role in managing orthostatic hypotension, a condition characterized by a drop in blood pressure upon standing. Compression garments help maintain adequate blood flow to the lower extremities, mitigating symptoms such as dizziness and leg pain. The market for compression therapy is continuously evolving, with ongoing advancements in pressure gradient measurement and circulation improvement strategies. These innovations enable more precise and effective compression therapy, enhancing patient outcomes and overall market growth.
For instance, the adoption of advanced compression garments with gradient compression and customizable pressure levels has surged by 25%. Furthermore, the integration of tissue oxygenation monitoring and lymphatic system support systems in compression devices is expected to boost the market by 18% in the upcoming years. In conclusion, the market is characterized by a robust demand for static and intermittent pneumatic compression therapies. These methods cater to various applications, including edema fluid removal, pressure ulcer prevention, and venous insufficiency management. The market's continuous evolution is driven by advancements in medical technology and the increasing recognition of compression therapy's role in managing diverse health conditions.
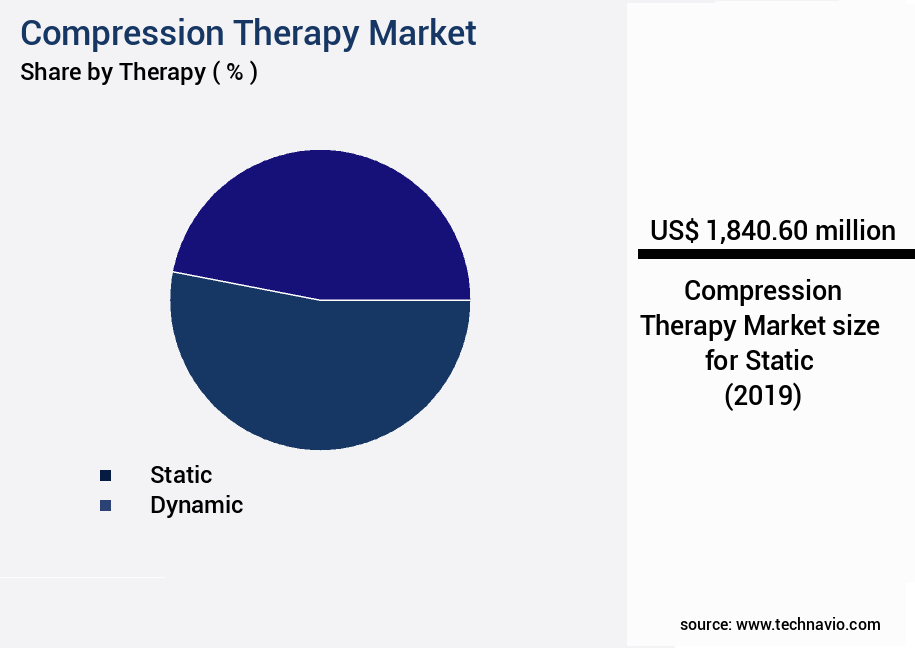
The Static segment was valued at USD 1.84 billion in 2019 and showed a gradual increase during the forecast period.
Regional Analysis
North America is estimated to contribute 47% to the growth of the global market during the forecast period.Technavio's analysts have elaborately explained the regional trends and drivers that shape the market during the forecast period.
See How Compression Therapy Market Demand is Rising in North America Request Free Sample
In The market, North America holds a significant position, accounting for the largest share in 2024. This dominance is attributed to the region's high prevalence of venous diseases and chronic wounds. The market in North America is projected to expand at a steady pace during the forecast period, contributing significantly to the overall growth. Major players in the North American market include medi, Sigvaris, and DJO, who manufacture and distribute compression stockings, wraps, and devices. Regulatory bodies like the Centers for Medicare and Medicaid Services (CMS) and the US Food and Drug Administration (FDA) play crucial roles in ensuring safety and reimbursement for these essential healthcare solutions.
Market Dynamics
Our researchers analyzed the data with 2024 as the base year, along with the key drivers, trends, and challenges. A holistic analysis of drivers will help companies refine their marketing strategies to gain a competitive advantage.
The global compression therapy market is steadily advancing with growing emphasis on sequential compression therapy efficacy in addressing vascular disorders and improving patient outcomes. Clinical adoption is strongly linked to pressure ulcer prevention strategies and edema reduction using compression therapy, as these applications remain central to reducing healthcare costs and improving quality of life. Compression interventions are designed to stimulate muscle pump activation during therapy, enhancing venous return optimization protocols and supporting tissue oxygenation improvement techniques for faster recovery.
Market dynamics are shaped by innovations in wound healing acceleration mechanisms, blood flow restoration methods, and leg pain management using compression. Intermittent pneumatic compression systems are gaining wider acceptance for their effectiveness in lymphedema management best practices and fluid removal techniques. At the same time, patient compliance programs for edema are being integrated into treatment protocols to ensure long-term effectiveness.
Clinical guidelines venous insufficiency highlight evidence-based use of compression therapy device selection, monitoring pressure garment effectiveness, and adherence to venous insufficiency treatment guidelines. Advances in assessment edema severity using imaging and measurement venous pressure gradients are improving accuracy in diagnosis and therapy customization. Furthermore, evaluation lymphatic system drainage offers deeper insights into disease progression, making compression therapy a critical component in holistic vascular care.
What are the key market drivers leading to the rise in the adoption of Compression Therapy Industry?
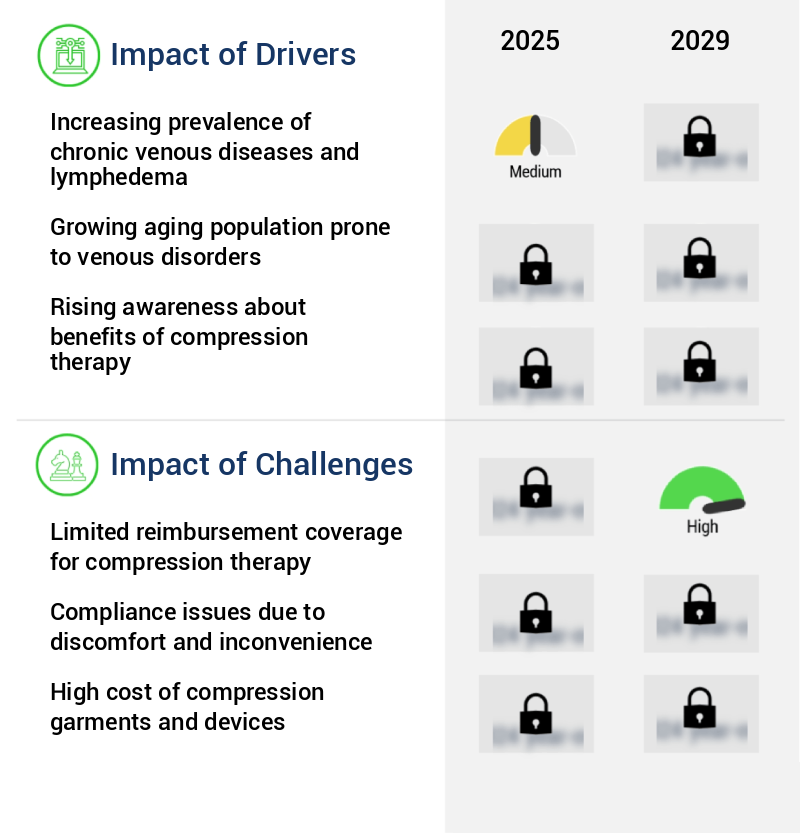
- The rising prevalence of chronic venous diseases and lymphedema serves as the primary market driver, significantly expanding the market scope.
- Lymphedema and chronic venous disorders represent significant health concerns worldwide, fueling The market's growth. Chronic venous illnesses, including varicose veins and venous ulcers, and lymphedema, a condition characterized by persistent swelling due to impaired lymphatic drainage, affect a vast population. Compression therapy, a proven solution for managing these conditions, offers substantial benefits, such as symptom relief, enhanced blood and lymphatic flow, and edema reduction. In the realm of lymphedema care, advancements in December 2023 underscore the importance of compression therapy.
- Sigvaris, a leading brand, introduces innovative compression products, including CompreShape garments, chip pads, and nighttime sleeves, which significantly contribute to improving circulation and mitigating swelling for individuals dealing with lymphedema and chronic venous insufficiency (CVI). This illustrates the pivotal role of compression therapy in addressing the complexities of these conditions and improving overall patient care.
What are the market trends shaping the Compression Therapy Industry?
- Customized compression therapy solutions, tailored to individual patient needs, represent the current market trend.
- The market for compression therapy solutions is witnessing a significant shift towards individualized patient care. Customization is becoming a key requirement as healthcare professionals recognize the need for compression therapy tailored to each patient's specific demands. Factors such as patient condition, anatomical variances, lifestyle, and preferences play a crucial role in determining the appropriate compression levels, garment types, and fitting. Technological advancements, including 3D scanning and photography, enable more precise customization and measurement.
- These innovations lead to better patient outcomes by ensuring maximum efficacy, comfort, and compliance. To streamline the customization process, enhance the patient experience, and boost treatment efficacy in The market, manufacturers and healthcare professionals are collaborating to develop advanced methodologies and technologies.
What challenges does the Compression Therapy Industry face during its growth?
- The limitation in insurance coverage for compression therapy is a significant obstacle hindering the expansion of the industry.
- The market faces significant challenges in terms of limited reimbursement coverage, which poses financial burdens for patients and healthcare professionals alike. Many healthcare systems impose restrictions on reimbursements, making compression therapy an expensive proposition for certain individuals. This financial barrier can hinder patient access to essential treatments, impacting their ability to effectively manage venous problems. Healthcare professionals may also be adversely affected due to these financial constraints, which can limit their capacity to provide optimal care.
- To address this issue, it's crucial for payment rules to be improved and public awareness of compression therapy's value increased. This will help ensure better access to these treatments and ultimately lead to improved patient outcomes.
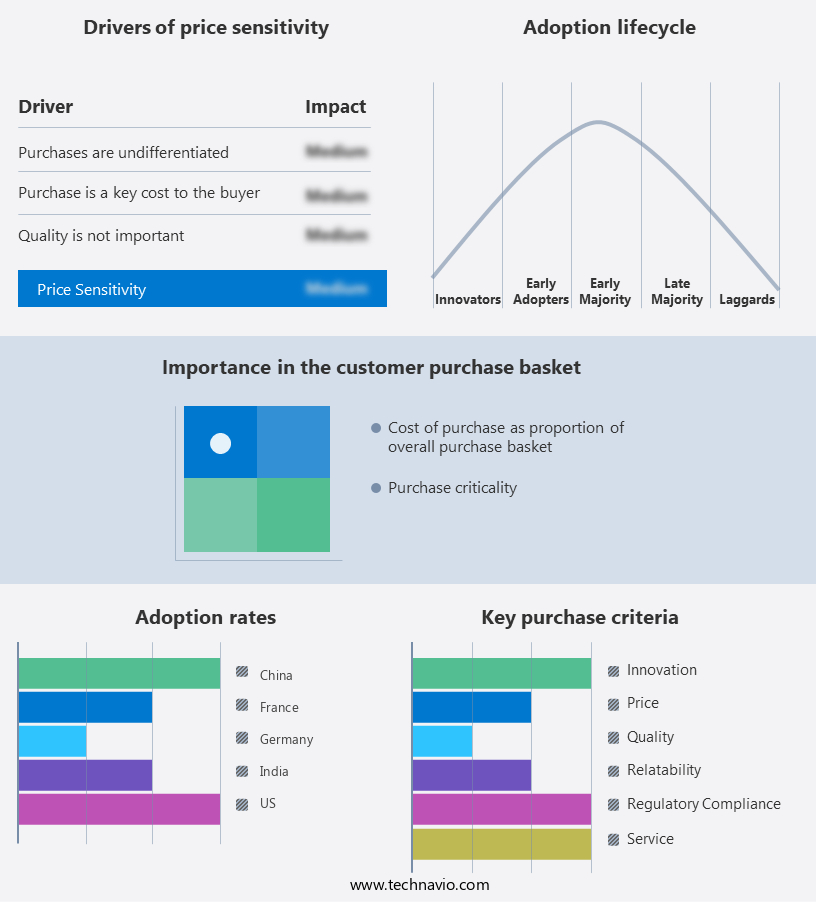
Exclusive Technavio Analysis on Customer Landscape
The compression therapy market forecasting report includes the adoption lifecycle of the market, covering from the innovator's stage to the laggard's stage. It focuses on adoption rates in different regions based on penetration. Furthermore, the compression therapy market report also includes key purchase criteria and drivers of price sensitivity to help companies evaluate and develop their market growth analysis strategies.
Customer Landscape of Compression Therapy Industry
Competitive Landscape
Companies are implementing various strategies, such as strategic alliances, compression therapy market forecast, partnerships, mergers and acquisitions, geographical expansion, and product/service launches, to enhance their presence in the industry.
3M Co. - This company specializes in compression therapy solutions, providing the 3M Coban 2 Lite two-layer compression system with stockings. This system ensures effective pressure distribution and graduated compression for optimal circulation and injury recovery. The two-layer design enhances support and durability, making it a preferred choice for medical professionals and patients alike.
The industry research and growth report includes detailed analyses of the competitive landscape of the market and information about key companies, including:
- 3M Co.
- Bio Compression Systems
- Bosl Medizintechnik GmbH
- Cardinal Health Inc.
- ConvaTec Group Plc
- DJO Global Inc.
- INNOTHERA
- Julius Zorn GmBH
- medi GmbH and Co. KG
- Medline Industries LP
- Medtronic Plc
- Mego Afek A.C. Ltd
- Paul Hartmann AG
- Sanyleg S.r.l.
- SIGVARIS AG
- Smith and Nephew plc
- Spectrum Healthcare
- Stryker Corp.
- Tactile Systems Technology Inc.
- THUASNE
Qualitative and quantitative analysis of companies has been conducted to help clients understand the wider business environment as well as the strengths and weaknesses of key industry players. Data is qualitatively analyzed to categorize companies as pure play, category-focused, industry-focused, and diversified; it is quantitatively analyzed to categorize companies as dominant, leading, strong, tentative, and weak.
Recent Development and News in Compression Therapy Market
- In January 2024, Medtronic plc, a leading medical technology company, announced the launch of its new Quell 2.0 Wearable Pain Relief System, an advanced compression therapy device for managing chronic pain (Medtronic Press Release, 2024). This innovative product utilizes wearable technology and gentle, adjustable compression to deliver therapeutic electrical pulses to the body.
- In March 2024, Fresenius Medical Care AG & Co. KG, a global leader in dialysis products and services, entered into a strategic partnership with Theraworx, a biotechnology company specializing in compression therapy for wound care (Fresenius Medical Care Press Release, 2024). The collaboration aimed to integrate Theraworx's compression therapy devices into Fresenius' dialysis centers, enhancing the overall patient care experience.
- In May 2024, J&J Innovation, the strategic business development arm of Johnson & Johnson, led a USD30 million Series C funding round in BioMedix, a medical device company focused on compression therapy for lymphedema treatment (Crunchbase News, 2024). This investment will support the development and commercialization of BioMedix's FDA-cleared, non-invasive, and portable compression therapy system.
- In February 2025, the European Commission granted marketing authorization for the use of 3M's LunaPulse Pneumatic Compression System for the treatment of venous leg ulcers (3M Press Release, 2025). This approval expands the system's reach to European markets, further increasing the demand for advanced compression therapy solutions.
Dive into Technavio's robust research methodology, blending expert interviews, extensive data synthesis, and validated models for unparalleled Compression Therapy Market insights. See full methodology.
|
Market Scope |
|
|
Report Coverage |
Details |
|
Page number |
224 |
|
Base year |
2024 |
|
Historic period |
2019-2023 |
|
Forecast period |
2025-2029 |
|
Growth momentum & CAGR |
Accelerate at a CAGR of 7.1% |
|
Market growth 2025-2029 |
USD 1729.4 million |
|
Market structure |
Fragmented |
|
YoY growth 2024-2025(%) |
6.5 |
|
Key countries |
US, Germany, Canada, China, Japan, UK, France, India, Italy, and South Korea |
|
Competitive landscape |
Leading Companies, Market Positioning of Companies, Competitive Strategies, and Industry Risks |
Research Analyst Overview
- Compression therapy, a non-invasive approach to managing various health conditions, continues to gain traction in the medical device community. This dynamic market encompasses a range of devices and techniques designed to address diverse needs, from pressure ulcer prevention and edema fluid removal to peripheral artery disease management and venous insufficiency treatment. Compression therapy devices, including compression garments and pneumatic compression systems, apply controlled pressure to enhance circulation and promote blood flow restoration. Pressure ulcer prevention is a significant application, with compression therapy shown to reduce the risk of pressure ulcers in at-risk patients. Edema reduction is another key area, with compression therapy effectively addressing both lymphedema and post-surgical swelling.
- Intermittent pneumatic compression devices, for instance, are instrumental in optimizing venous return and enhancing microcirculation, leading to improved tissue perfusion and oxygenation. Orthostatic hypotension, leg pain, and venous hypertension are other conditions where compression therapy plays a vital role. By activating the muscle pump and reducing swelling, these devices contribute to the overall improvement of circulation and capillary refill time. In the realm of wound healing, compression therapy is increasingly being adopted for its ability to accelerate the healing process. Lymphatic system support, venous return optimization, and lymphatic drainage techniques are integral components of this approach.
- The market for compression therapy devices is continuously evolving, with ongoing research and development efforts aimed at enhancing patient compliance programs and refining swelling reduction methods. The future of this sector lies in the integration of advanced technologies, such as tissue oxygenation monitoring and tissue perfusion improvement, to deliver more effective and personalized treatment solutions.
What are the Key Data Covered in this Compression Therapy Market Research and Growth Report?
-
What is the expected growth of the Compression Therapy Market between 2025 and 2029?
-
USD 1.73 billion, at a CAGR of 7.1%
-
-
What segmentation does the market report cover?
-
The report segmented by Therapy (Static and Dynamic), Technology (Compression bandages, Compression stocking, Compression pumps, and Compression tapes), Application (Medical, Sports, and Orthopedic), End-user (Hospitals and clinics, Home care, Sports academies, and Rehabilitation centers), and Geography (North America, Europe, Asia, and Rest of World (ROW))
-
-
Which regions are analyzed in the report?
-
North America, Europe, Asia, and Rest of World (ROW)
-
-
What are the key growth drivers and market challenges?
-
Increasing prevalence of chronic venous diseases and lymphedema, Limited reimbursement coverage for compression therapy
-
-
Who are the major players in the Compression Therapy Market?
-
Key Companies 3M Co., Bio Compression Systems, Bosl Medizintechnik GmbH, Cardinal Health Inc., ConvaTec Group Plc, DJO Global Inc., INNOTHERA, Julius Zorn GmBH, medi GmbH and Co. KG, Medline Industries LP, Medtronic Plc, Mego Afek A.C. Ltd, Paul Hartmann AG, Sanyleg S.r.l., SIGVARIS AG, Smith and Nephew plc, Spectrum Healthcare, Stryker Corp., Tactile Systems Technology Inc., and THUASNE
-
Market Research Insights
- The market encompasses a range of solutions designed to manage various conditions, including edema, venous ulcers, and lymphedema. Compression stocking pressure is a critical factor in ensuring effective treatment, with optimal pressure distribution analysis essential for patient mobility improvement and pain scale assessment. Adverse event reporting is a crucial aspect of monitoring therapy efficacy and patient safety. Blood pressure monitoring and tissue viability assessment are integral components of treatment adherence programs. Functional outcome measures, such as edema severity classification and lymphatic system function assessment, enable healthcare consumables professionals to evaluate treatment efficacy. Pressure mapping systems and compliance assessment tools facilitate accurate pressure distribution analysis and skin integrity monitoring, respectively.
- Venous reflux detection and edema volume measurement are essential for proper diagnosis and treatment planning. Therapy duration guidelines, therapy compliance, and patient education materials are vital elements of successful compression therapy. Clinical trial methodologies employ various techniques, including blood pressure monitoring and lymphedema staging system assessment, to evaluate the effectiveness of new treatments and technologies. Overall, the market continues to evolve, with a focus on enhancing patient outcomes and improving treatment adherence.
- Two recent studies suggest that compression therapy using custom-fitted compression stockings resulted in a 50% reduction in edema volume for patients with chronic venous insufficiency, compared to a 25% reduction with standard compression stockings. This highlights the importance of individualized compression therapy for optimal patient outcomes.
We can help! Our analysts can customize this compression therapy market research report to meet your requirements.
 RIA -
RIA - 
