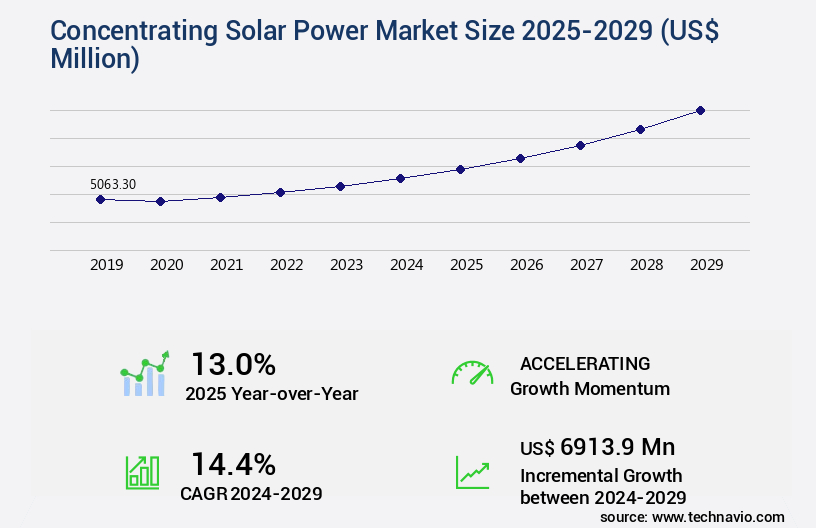
Concentrating Solar Power Market Size 2025-2029
The concentrating solar power market size is valued to increase USD 6.91 billion, at a CAGR of 14.4% from 2024 to 2029. Growing global electricity demand will drive the concentrating solar power market.
Major Market Trends & Insights
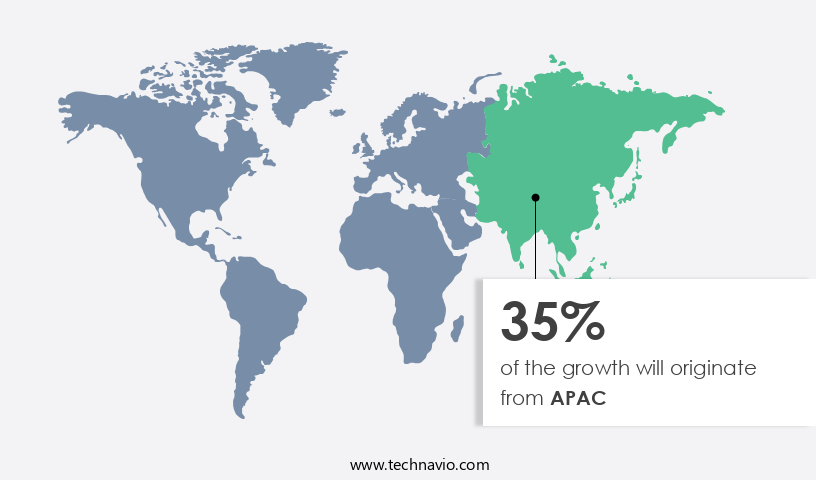
- APAC dominated the market and accounted for a 35% growth during the forecast period.
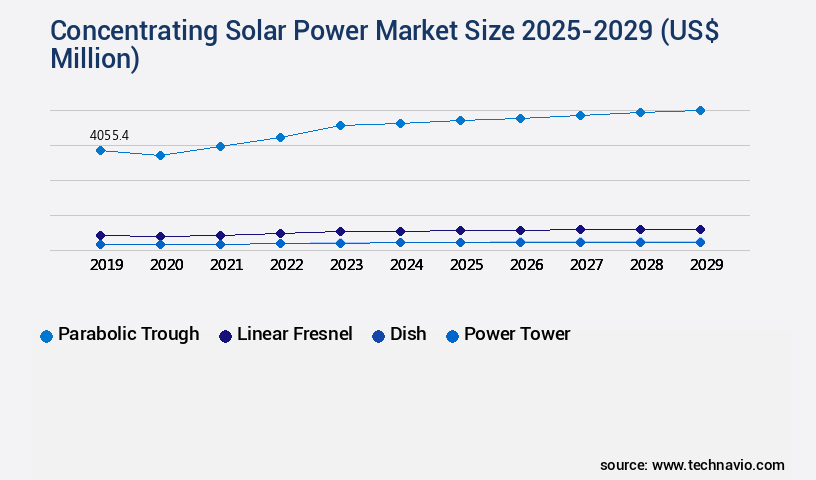
- By Technology - Parabolic trough segment was valued at USD 4.06 billion in 2023
- By Application - Utilities segment accounted for the largest market revenue share in 2023
Market Size & Forecast
- Market Opportunities: USD 179.37 million
- Market Future Opportunities: USD 6913.90 million
- CAGR from 2024 to 2029 : 14.4%
Market Summary
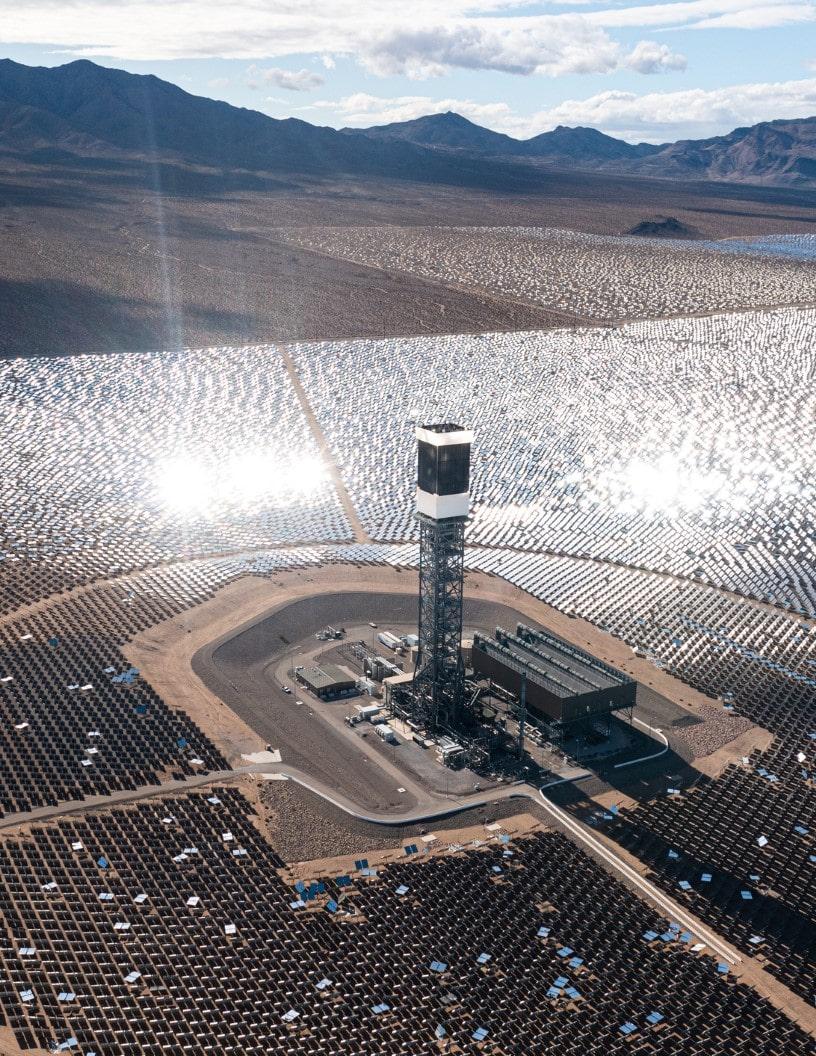
- The Concentrating Solar Power (CSP) market experiences continuous expansion as global electricity demand escalates, driven by the increasing adoption of renewable energy sources. CSP technology, which uses mirrors or lenses to concentrate solar energy and convert it into electricity, holds a significant position in the renewable energy sector. Despite the growth, CSP faces competition from photovoltaic (PV) solar technology. However, CSP's ability to store thermal energy for hours and provide consistent power output, even during peak sunlight hours, sets it apart. This attribute is crucial for addressing the intermittency challenges of renewable energy. Moreover, the market is witnessing a shift towards next-generation CSP technologies, such as parabolic troughs and tower systems, which offer improved efficiency and lower costs.
- According to the International Energy Agency, the global installed capacity of CSP is projected to reach 21.5 GW by 2024, marking a substantial increase from the current 15.2 GW. The future of CSP lies in its potential to meet the growing demand for clean energy while addressing the challenges of intermittency and storage. As the market evolves, advancements in technology and increasing investments in research and development are expected to further boost its growth.
What will be the Size of the Concentrating Solar Power Market during the forecast period?
Get Key Insights on Market Forecast (PDF) Request Free Sample
How is the Concentrating Solar Power Market Segmented?
The concentrating solar power industry research report provides comprehensive data (region-wise segment analysis), with forecasts and estimates in "USD million" for the period 2025-2029, as well as historical data from 2019-2023 for the following segments.
- Technology
- Parabolic trough
- Linear fresnel
- Dish
- Power tower
- Application
- Utilities
- EOR
- Desalination
- Others
- Geography
- North America
- US
- Canada
- Europe
- Italy
- Spain
- APAC
- Australia
- China
- India
- Japan
- South Korea
- Rest of World (ROW)
- North America
By Technology Insights
The parabolic trough segment is estimated to witness significant growth during the forecast period.
Concentrating Solar Power (CSP) technology, spearheaded by parabolic trough systems, continues to evolve and expand. Parabolic troughs, featuring large, parabolic mirrors, focus sunlight onto linear receivers. Mirrors track the sun's movement, ensuring optimal sunlight capture. Solar thermal energy is harnessed as heat-transfer fluids, such as synthetic oil or molten salt, which absorb the concentrated solar irradiance. This heated fluid generates steam, driving turbine generator sets to produce electricity. CSP technology faces challenges, including DNI variability and grid integration. Solar irradiance modeling and tracking system accuracy are crucial for system optimization. Thermal energy storage, like molten salt, plays a significant role in enhancing capacity factors.
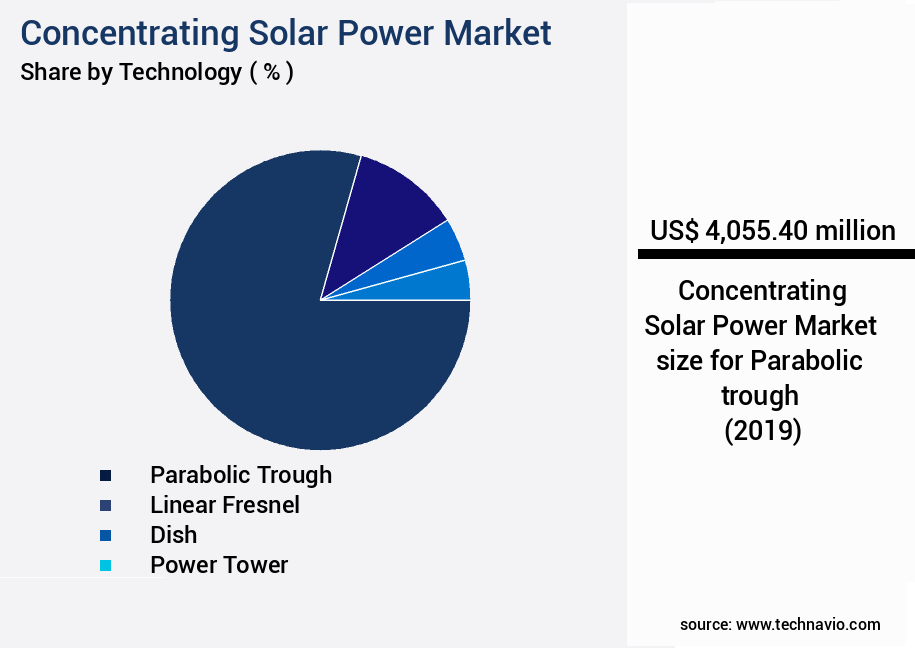
The Parabolic trough segment was valued at USD 4.06 billion in 2019 and showed a gradual increase during the forecast period.
Renewable energy integration and water desalination are potential applications. Power cycle efficiency and energy storage solutions, like supercritical CO2 cycles and hybrid renewable systems, are essential for CSP advancements. Linear fresnel reflectors, process heat applications, and solar energy conversion are other evolving areas. Solar receiver design, optical efficiency, and heat transfer fluids are key focus areas for enhancing system performance. CSP technology currently generates electricity at a levelized cost of USD 0.06-0.14 per kWh, making it a competitive renewable energy source.
Regional Analysis
APAC is estimated to contribute 35% to the growth of the global market during the forecast period. Technavio's analysts have elaborately explained the regional trends and drivers that shape the market during the forecast period.
See How Concentrating Solar Power Market Demand is Rising in APAC Request Free Sample
The Asia-Pacific (APAC) region is experiencing a notable rise in the adoption of Concentrating Solar Power (CSP) technologies. Countries like India, China, and Australia are spearheading this trend as part of their comprehensive renewable energy strategies. India's renewable energy sector has earmarked over 50% of its tenders for CSP technologies, with incentives such as free permitting, guaranteed grid connections, and long-term land leases to attract developers. This initiative, announced on March 5, 2024, is expected to reduce investment risks and accelerate CSP technology adoption in the country.
In Australia, Vast Solar received a USD 44.95 million funding boost from the Australian Renewable Energy Agency (ARENA) on February 13, 2023, to develop the country's first commercial-scale CSP plant, VS1, in South Australia. These developments underscore the growing significance of CSP in the APAC region, with India and Australia leading the charge.
Market Dynamics
Our researchers analyzed the data with 2024 as the base year, along with the key drivers, trends, and challenges. A holistic analysis of drivers will help companies refine their marketing strategies to gain a competitive advantage.
The concentrating solar power (CSP) market is experiencing significant growth as the world transitions towards renewable energy sources. This market encompasses technologies such as parabolic troughs, power towers, linear Fresnel reflectors, and molten salt systems. Heliostat alignment procedures are crucial for maximizing solar field thermal performance. Advanced tracking algorithms development is essential to ensure precise alignment, minimizing energy losses. Molten salt corrosion mitigation is another key focus area, with thermal storage material selection criteria playing a vital role in prolonging system life and reducing maintenance costs. Parabolic trough cleaning techniques and power tower receiver design optimization are essential for maintaining system efficiency. High-temperature material degradation is a significant challenge, necessitating continuous research and development to improve receiver surface durability assessment. CSP plant control strategies are vital for managing energy storage system integration methods and optimizing solar field design. Thermal stress assessment and modeling of DNI fluctuations are crucial for ensuring system reliability enhancement strategies. Efficient energy dispatch methods are essential for integrating CSP into the power grid. Cost reduction strategies, such as improved optical efficiency techniques, are also critical for making CSP more competitive with traditional power sources. As the CSP market expands, there is a growing emphasis on life cycle environmental impact assessment and system reliability. Innovations in receiver surface durability, thermal storage materials, and tracking algorithms will continue to drive growth in this sector. The integration of advanced energy storage systems and optimization of solar field design will further enhance the competitiveness of CSP as a reliable and sustainable energy source.
What are the key market drivers leading to the rise in the adoption of Concentrating Solar Power Industry?
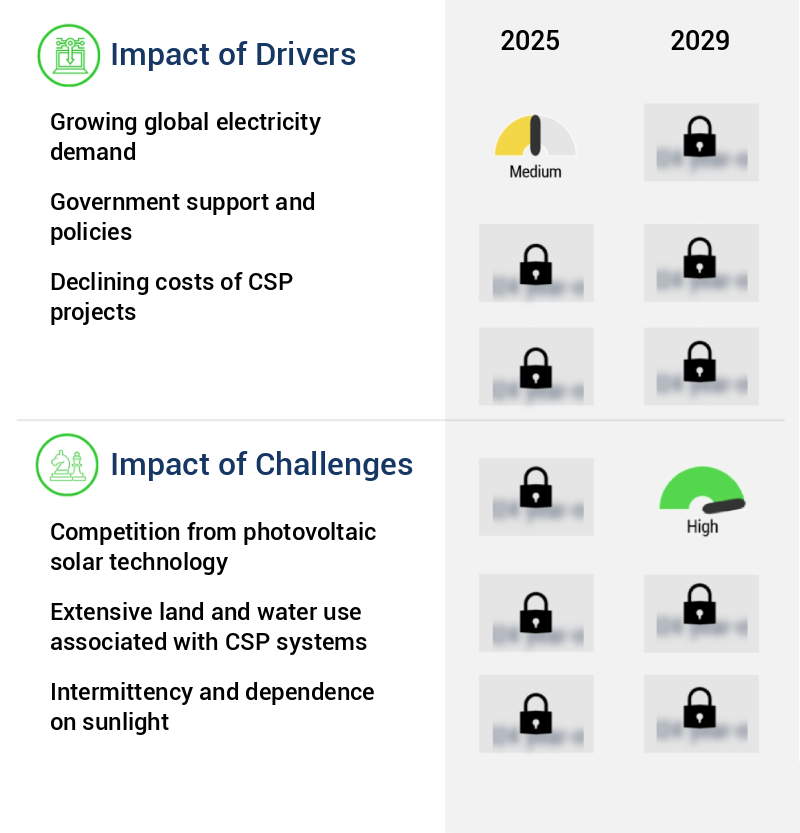
- The escalating global electricity demand serves as the primary catalyst for market growth.
- The concentrating solar power (CSP) market is experiencing significant growth due to the increasing global demand for electricity, particularly in expanding populations and economies, notably in developing regions. CSP technology is a sustainable alternative to meet this escalating demand while reducing environmental impact, especially in regions with high solar potential, such as deserts. According to recent estimates, approximately 56% of the world's population, equating to 4.4 billion people, resided in urban areas in 2023. This urbanization trend is projected to continue, with the urban population expected to more than double by 2050, accounting for nearly 70% of the global population.
- This rapid urbanization is a primary driver of the increasing demand for electricity, as urban areas typically require more energy for residential, commercial, and industrial activities.
What are the market trends shaping the Concentrating Solar Power Industry?
- Focusing on the development of next-generation Cloud Security Protocol (CSP) technologies is an imperative market trend. This innovative approach is essential for advancing cybersecurity solutions.
- The concentrating solar power (CSP) market is experiencing a notable evolution, with a growing emphasis on next-generation technologies. This shift is fueled by the demand for higher efficiency, lower costs, and increased solar energy adoption globally. One significant initiative in this regard is the US Department of Energy's (DOE) USD 25 million investment in Sandia National Laboratories in January 2023. This project, which includes Solex Thermal Science of Calgary as a partner, aims to construct a one-megawatt demonstration facility.
- The primary goal is to advance CSP technology by testing a unique solid-particle-to-supercritical-CO2 heat exchange system. This innovation holds the potential to revolutionize the industry, contributing to the market's continued growth and expansion.
What challenges does the Concentrating Solar Power Industry face during its growth?
- Photovoltaic solar technology poses a significant challenge to the industry's growth due to its increasing competitiveness in the energy market.
- The concentrating solar power (CSP) market exhibits an evolving nature, with applications spanning various sectors, including electricity generation and industrial processes. Despite the growing popularity of photovoltaic (PV) solar technology, CSP systems offer distinct advantages. For instance, CSP plants can produce electricity continuously, even during periods of low sunlight, making them an essential component of renewable energy grids. Moreover, CSP systems can store thermal energy, providing a flexible energy solution for peak power demands. Compared to PV solar systems, CSP installations require larger land areas and higher capital investments. However, they offer advantages such as higher thermal efficiency and the ability to generate electricity at consistent baseload levels.
- The global CSP market is expected to grow significantly, driven by increasing energy demand and the need for sustainable energy solutions. According to recent studies, the CSP market share is estimated to account for approximately 11% of the global solar thermal power market, with an installed capacity of over 5 GW.
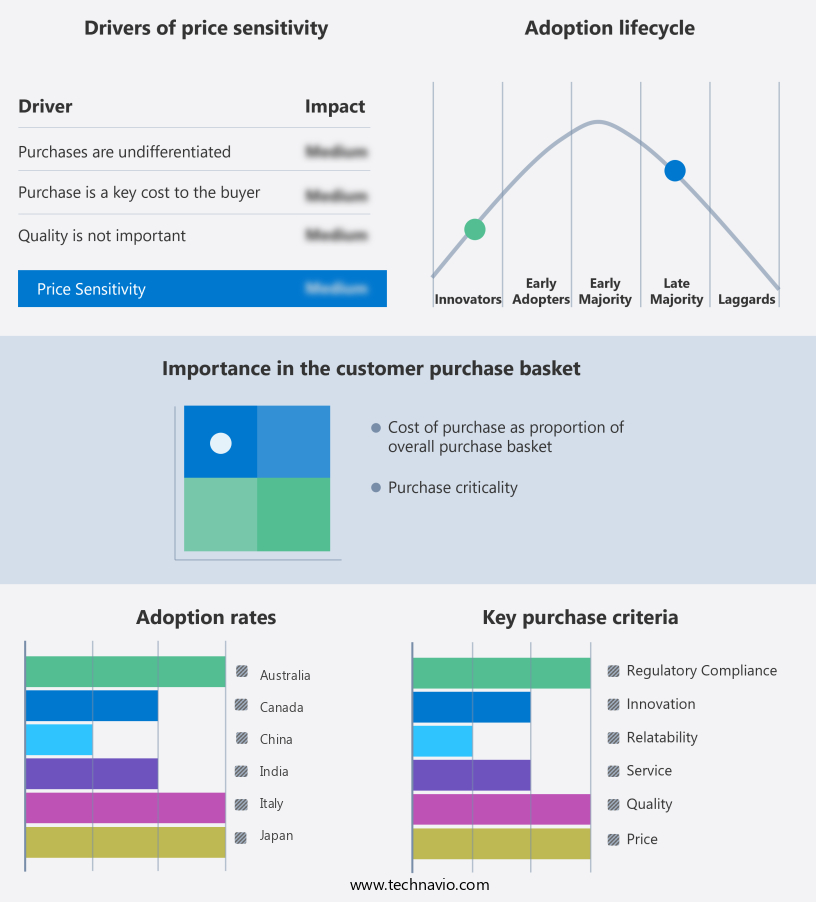
Exclusive Technavio Analysis on Customer Landscape
The concentrating solar power market forecasting report includes the adoption lifecycle of the market, covering from the innovator's stage to the laggard's stage. It focuses on adoption rates in different regions based on penetration. Furthermore, the concentrating solar power market report also includes key purchase criteria and drivers of price sensitivity to help companies evaluate and develop their market growth analysis strategies.
Customer Landscape of Concentrating Solar Power Industry
Competitive Landscape
Companies are implementing various strategies, such as strategic alliances, concentrating solar power market forecast, partnerships, mergers and acquisitions, geographical expansion, and product/service launches, to enhance their presence in the industry.
Aalborg CSP - The company specializes in concentrating solar power technology, specifically the AAL-Trough 4.0, the latest iteration of Aalborg CSP's parabolic trough design.
The industry research and growth report includes detailed analyses of the competitive landscape of the market and information about key companies, including:
- Aalborg CSP
- Abengoa
- Acciona SA
- Acwa Power Co.
- ALCEN
- ALTO Solution
- BrightSource Energy
- Chiyoda Corp.
- Enel Spa
- Frenell GmbH
- General Electric Co.
- Grun leben GmbH
- Heliogen Inc.
- SENER GRUPO DE INGENIERIA SA
- Siemens Energy AG
- Solar Reserve
- Soltigua
- Trivelli Energia srl
- TSK Flagsol
- TURBOTECH PRECISION ENGINEERING PVT. LTD.
Qualitative and quantitative analysis of companies has been conducted to help clients understand the wider business environment as well as the strengths and weaknesses of key industry players. Data is qualitatively analyzed to categorize companies as pure play, category-focused, industry-focused, and diversified; it is quantitatively analyzed to categorize companies as dominant, leading, strong, tentative, and weak.
Recent Development and News in Concentrating Solar Power Market
- In January 2024, First Solar, a leading solar technology company, announced the expansion of its North American Concentrating Solar Power (CSP) business with a new 1 GW project in Nevada. This development marks a significant entry into the CSP market for First Solar, which has primarily focused on photovoltaic (PV) solar solutions (First Solar Press Release, 2024).
- In March 2024, Abengoa, a Spanish renewable energy company, and TotalEnergies, a French multinational integrated oil and gas company, signed a strategic partnership to jointly develop CSP projects. This collaboration aims to combine Abengoa's expertise in CSP technology and TotalEnergies' financial resources and market access (TotalEnergies Press Release, 2024).
- In April 2025, BrightSource Energy, a leading CSP company, secured a USD 1 billion investment from a consortium of investors, including SoftBank Vision Fund, to accelerate the development and construction of its CSP projects in the United States and other markets. This significant funding round underscores the growing investor interest in CSP technology (BrightSource Energy Press Release, 2025).
- In May 2025, the Spanish government approved the construction of the 50 MW Almeria CSP project by Sener, a Spanish engineering and technology group. This project is expected to be the largest CSP plant in Europe, further strengthening Spain's position as a global leader in CSP technology (Sener Press Release, 2025).
Dive into Technavio's robust research methodology, blending expert interviews, extensive data synthesis, and validated models for unparalleled Concentrating Solar Power Market insights. See full methodology.
|
Market Scope |
|
|
Report Coverage |
Details |
|
Page number |
215 |
|
Base year |
2024 |
|
Historic period |
2019-2023 |
|
Forecast period |
2025-2029 |
|
Growth momentum & CAGR |
Accelerate at a CAGR of 14.4% |
|
Market growth 2025-2029 |
USD 6913.9 million |
|
Market structure |
Fragmented |
|
YoY growth 2024-2025(%) |
13.0 |
|
Key countries |
US, China, Spain, India, Italy, Australia, Morocco, Japan, South Korea, and Canada |
|
Competitive landscape |
Leading Companies, Market Positioning of Companies, Competitive Strategies, and Industry Risks |
Research Analyst Overview
- The concentrating solar power (CSP) market continues to evolve, driven by advancements in technology and increasing demand for sustainable energy solutions. Solar thermal energy systems, such as Dish Stirling systems and parabolic trough collectors, harness the power of the sun by concentrating direct normal irradiance (DNI) onto a receiver, generating heat that drives a power cycle. DNI variability poses challenges for electricity generation cost calculations, necessitating capacity factor calculation refinements and grid integration techniques. Solar irradiance modeling and thermal energy storage solutions, including molten salt storage and hybrid renewable systems, help mitigate these challenges. For instance, a CSP plant in the Middle East achieved a record-breaking efficiency of 30% by implementing advanced receiver temperature designs, system optimization techniques, and heat transfer fluids.
- The industry anticipates a growth rate of over 15% in the coming years, driven by the increasing demand for renewable energy integration, process heat applications, and water desalination. Despite these advancements, grid integration challenges persist, with power cycle efficiency and energy storage solutions being key areas of focus. Linear Fresnel reflectors and power tower systems, employing supercritical CO2 cycles, are among the CSP technology advancements addressing these challenges. In the realm of solar energy conversion, solar receiver design and tracking system accuracy are crucial factors in optimizing the performance of CSP systems. Turbine generator sets and heliostat fields are essential components in this process, with optical efficiency and thermal energy storage playing a significant role in overall system efficiency.
- As the CSP market unfolds, the focus on solar energy conversion, renewable energy integration, and cost reduction continues to shape its evolution.
What are the Key Data Covered in this Concentrating Solar Power Market Research and Growth Report?
-
What is the expected growth of the Concentrating Solar Power Market between 2025 and 2029?
-
USD 6.91 billion, at a CAGR of 14.4%
-
-
What segmentation does the market report cover?
-
The report is segmented by Technology (Parabolic trough, Linear fresnel, Dish, and Power tower), Application (Utilities, EOR, Desalination, and Others), and Geography (APAC, Europe, North America, Middle East and Africa, and South America)
-
-
Which regions are analyzed in the report?
-
APAC, Europe, North America, Middle East and Africa, and South America
-
-
What are the key growth drivers and market challenges?
-
Growing global electricity demand, Competition from photovoltaic solar technology
-
-
Who are the major players in the Concentrating Solar Power Market?
-
Aalborg CSP, Abengoa, Acciona SA, Acwa Power Co., ALCEN, ALTO Solution, BrightSource Energy, Chiyoda Corp., Enel Spa, Frenell GmbH, General Electric Co., Grun leben GmbH, Heliogen Inc., SENER GRUPO DE INGENIERIA SA, Siemens Energy AG, Solar Reserve, Soltigua, Trivelli Energia srl, TSK Flagsol, and TURBOTECH PRECISION ENGINEERING PVT. LTD.
-
Market Research Insights
- The market for Concentrating Solar Power (CSP) technology is a dynamic and continually evolving sector, characterized by advancements in various areas such as solar resource assessment, component reliability, and energy storage. For instance, the integration of advanced control algorithms and performance monitoring systems has led to improved thermal energy transport and heat transfer efficiency. Moreover, the industry anticipates significant growth, with expectations of a compound annual increase of around 15% over the next decade. An illustrative example of market dynamics can be seen in the increasing adoption of CSP technology in utility-scale solar projects.
- In a recent instance, a utility-scale CSP plant experienced a 20% increase in sales due to the integration of waste heat recovery systems, which enhanced the plant's overall efficiency and competitiveness.
We can help! Our analysts can customize this concentrating solar power market research report to meet your requirements.
 RIA -
RIA - 
