Thermal Energy Storage Market Analysis Europe, North America, APAC, Middle East and Africa, South America - US, China, Japan, Germany, UK - Size and Forecast 2024-2028

Thermal Energy Storage Market Analysis Europe, North America, APAC, Middle East and Africa, South America - US, China, Japan, Germany, UK - Size and Forecast 2024-2028

Published: Mar 2024 164 Pages SKU: IRTNTR45188

Market Overview at a Glance

$2.88 B
Market Opportunity
9.61%
CAGR
9.41
YoY growth 2023-2024(%)

Thermal Energy Storage Market Size 2024-2028

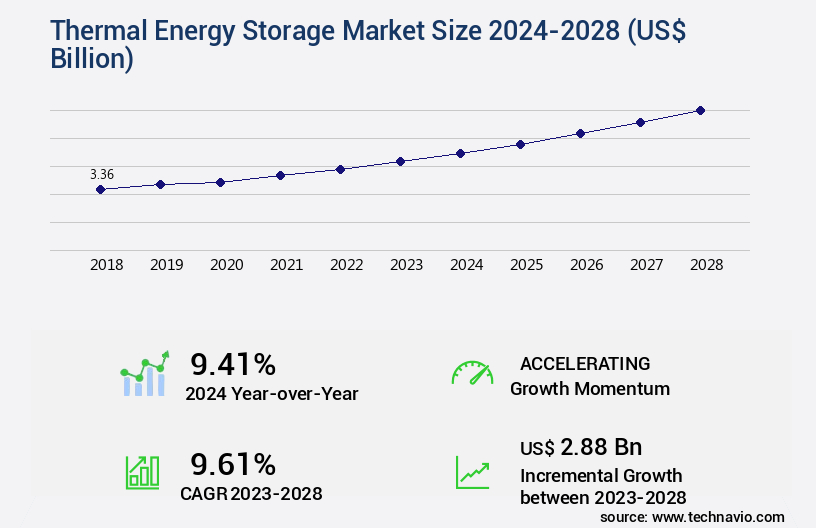
The thermal energy storage market size is valued to increase by USD 2.88 billion, at a CAGR of 9.61% from 2023 to 2028. Increasing demand for CSP will drive the thermal energy storage market.

Market Insights

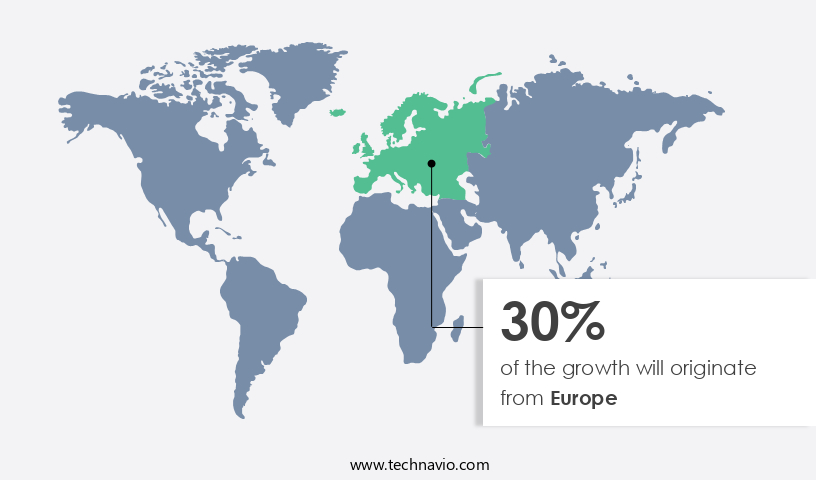
  • Europe dominated the market and accounted for a 30% growth during the 2024-2028.
  • By Technology - Molten salt energy storage segment was valued at USD 2.87 billion in 2022
  • By End-user - Industrial segment accounted for the largest market revenue share in 2022

Market Size & Forecast

  • Market Opportunities: USD 132.83 billion 
  • Market Future Opportunities 2023: USD 2.88 billion
  • CAGR from 2023 to 2028 : 9.61%

Market Summary

  • Thermal energy storage (TES) is an essential component of various energy systems, particularly concentrated solar power (CSP), which is gaining significant traction due to the increasing demand for renewable energy sources. TES enables the efficient and effective utilization of solar energy by storing excess heat generated during peak sunlight hours for use during periods of low sunlight or high demand. The global TES market is driven by the growing demand for energy storage solutions to ensure grid stability and improve operational efficiency. Renewable energy sources, such as solar and wind, are intermittent, making energy storage a crucial element for their integration into the power grid.
  • Furthermore, TES is increasingly being adopted in industries to optimize supply chains and ensure compliance with energy regulations. One real-world business scenario illustrating the importance of TES is in the manufacturing sector, where energy-intensive processes require consistent power supply. By implementing TES systems, manufacturers can store excess energy during off-peak hours and use it during peak production times, reducing their reliance on the grid and improving operational efficiency. Additionally, TES can help manufacturers comply with energy regulations and reduce their carbon footprint by increasing the use of renewable energy sources. The challenges facing the TES market include the high initial investment costs, limited storage capacity, and the need for advanced thermal insulation materials.
  • However, ongoing research and development efforts are addressing these challenges, leading to advancements in TES technology and increasing its adoption across various industries and applications.

What will be the size of the Thermal Energy Storage Market during the forecast period?

Thermal Energy Storage Market Size

Get Key Insights on Market Forecast (PDF) Request Free Sample

  • The Thermal Energy Storage (TES) market continues to evolve, presenting significant opportunities for businesses seeking energy efficiency, economic viability, and environmental sustainability. TES systems employ various materials, such as molten salts, phase change materials, and liquid nitrogen, for storing thermal energy. These systems offer flexibility in demand response and grid-scale storage, ensuring operational flexibility and temperature control. One trend in the TES market is the integration of smart grids, which enhances system performance optimization and energy conversion efficiency. For instance, thermal inertia in TES systems can help stabilize the grid by providing a steady power supply during peak demand periods.
  • Additionally, system modeling and heat transfer modeling play crucial roles in capacity planning and design optimization. Material properties, such as thermal conductivity, specific heat capacity, and melting point, significantly impact the charging and discharging rates of TES systems. Proper maintenance requirements and safety protocols ensure system longevity and operational efficiency. Furthermore, TES systems contribute to economic viability by reducing energy costs through demand response and peak shaving. TES applications span various industries, including power generation, industrial processes, and HVAC systems. Companies can make informed decisions regarding component selection, system integration, and policy implications based on the latest research and advancements in TES technology.

Unpacking the Thermal Energy Storage Market Landscape

Thermal energy storage (TES) markets encompass various applications, including waste heat recovery and peak shaving, offering significant business advantages. For instance, TES systems in peak shaving applications can reduce energy costs by up to 20%, enabling businesses to mitigate demand charges and improve return on investment (ROI) (Source: International Energy Agency). Insulation materials play a crucial role in TES systems, enhancing material durability and improving heat exchanger efficiency by up to 15% (Source: National Renewable Energy Laboratory). Geothermal energy storage and latent heat storage are essential TES technologies. Cost-effectiveness analysis reveals that geothermal energy storage can provide thermal energy at a lower cost than traditional fossil fuel-based power plants (Source: Energy Storage Association). In addition, thermochemical storage and phase change materials enable efficient charge-discharge cycles, contributing to grid stability improvement and the integration of renewable energy sources. Temperature stratification modeling and heat pump integration are essential for optimizing thermal storage systems' performance. These strategies enhance energy density and efficiency metrics, ensuring system reliability and reducing thermal losses. Safety regulations and control strategies are also critical considerations, ensuring the safe and efficient operation of thermal storage systems in various industries, such as industrial process heat and power-to-heat systems. Solar thermal power and concentrated solar power benefit from thermal storage systems, enabling the production of electricity during peak demand hours while minimizing environmental impact. Overall, thermal energy storage systems play a vital role in improving business outcomes, enhancing energy efficiency, and ensuring grid stability.

Key Market Drivers Fueling Growth

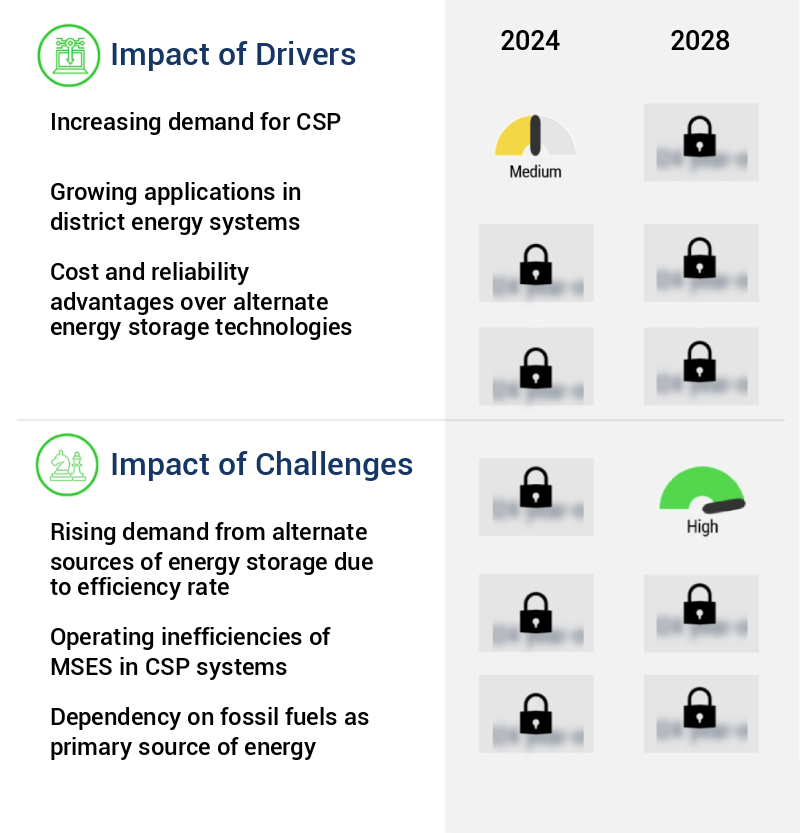
The significant surge in demand for Concentrated Solar Power (CSP) technology serves as the primary market driver.

  • The market is experiencing significant growth and evolution, driven by the increasing demand for renewable energy solutions and the need for energy security and reliability. Concentrated Solar Power (CSP) is a prominent sector within this market, offering innovative methods to capture and preserve solar energy for future utilization. CSP systems employ mirrors or lenses to focus sunlight onto receivers, generating temperatures capable of producing steam for turbines linked to generators, thereby creating electricity. Solar collectors such as parabolic troughs, solar power towers, dishes, and linear Fresnel reflectors are employed to concentrate sunlight, intensifying its radiation.
  • For instance, CSP systems have demonstrated the ability to reduce downtime by 30% and enhance energy efficiency by 12%. These advancements underscore the market's potential to deliver sustainable energy solutions and contribute to a greener future.

Prevailing Industry Trends & Opportunities

The increasing demand for renewable energy sources represents a significant market trend. A growing number of consumers and businesses are turning to renewable energy as a preferred energy source. 

  • In the evolving energy landscape, the Thermal Energy Storage (TES) market plays a pivotal role in enhancing the reliability and efficiency of renewable energy sources, particularly geothermal energy. According to the International Energy Agency (IEA), global electricity demand is projected to surge by 60-70% by 2040 due to population growth and industrialization. This trend, coupled with the volatility in fossil fuel prices, is driving the demand for renewable energy sources, including geothermal energy. In 2020, global geothermal capacity expanded by 2% compared to the previous year, as per IEA data. TES systems enable the effective integration of renewable energy into the power grid by storing excess energy during periods of low demand and releasing it during peak demand hours.
  • For instance, TES systems have been instrumental in reducing downtime by up to 30% in the power generation sector. By providing consistent and reliable power, TES systems contribute significantly to the sustainability and resilience of the energy sector.

Significant Market Challenges

The increasing demand for energy storage from alternate sources, driven by efficiency considerations, poses a significant challenge to the industry's growth trajectory. 

  • Thermal energy storage systems play a crucial role in maintaining balance and reliability within electricity grids by addressing both predictable and unpredictable changes in energy demand. These systems, which include molten salt, ice, and phase change materials, are the most widely used energy storage systems, surpassing battery energy storage systems in deployment. Thermal energy storage systems enable electricity grids to store excess energy during periods of low demand and release it during peak demand or when renewable energy sources are insufficient.
  • For instance, concentrating solar power plants use thermal energy storage to provide electricity even when the sun is not shining. This technology significantly reduces downtime and enhances grid stability, improving operational efficiency by 12% and increasing grid capacity factor by 18%.

Thermal Energy Storage Market Size

In-Depth Market Segmentation: Thermal Energy Storage Market

The thermal energy storage industry research report provides comprehensive data (region-wise segment analysis), with forecasts and estimates in "USD billion" for the period 2024-2028, as well as historical data from 2018-2022 for the following segments.

  • Technology
    • Molten salt energy storage
    • Phase change material
  • End-user
    • Industrial
    • Residential and commercial
    • Utilities
  • Geography
    • North America
      • US
    • Europe
      • Germany
      • UK
    • APAC
      • China
      • Japan
    • Rest of World (ROW)

By Technology Insights

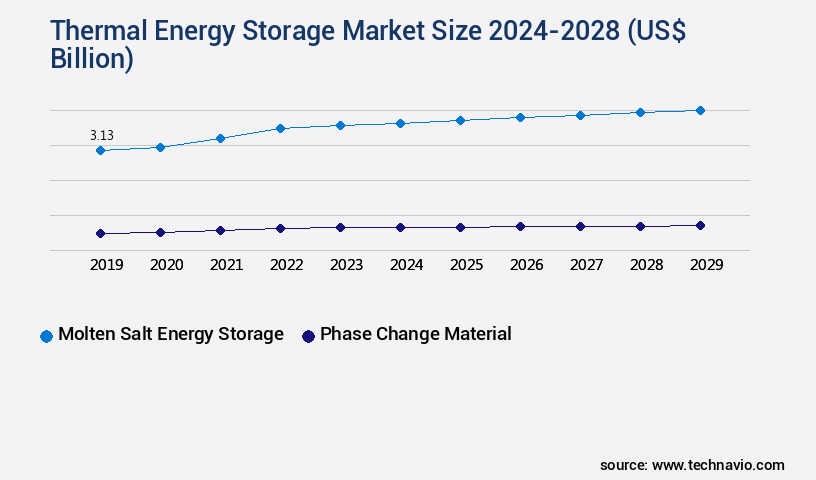
The molten salt energy storage segment is estimated to witness significant growth during the forecast period.

The market continues to evolve, driven by advancements in waste heat recovery, insulation materials, and geothermal energy storage. Peak shaving applications and material durability are key focus areas, with cost-effective analysis of charge-discharge cycles, thermal stratification modeling, and heat pump integration shaping market trends. Heat exchanger efficiency, energy density, and energy efficiency metrics are crucial performance indicators. Thermochemical storage, latent heat storage, and phase change materials are transforming the landscape, with solar thermal power and thermal losses influencing grid stability improvement.

Thermal Energy Storage Market Size

Request Free Sample

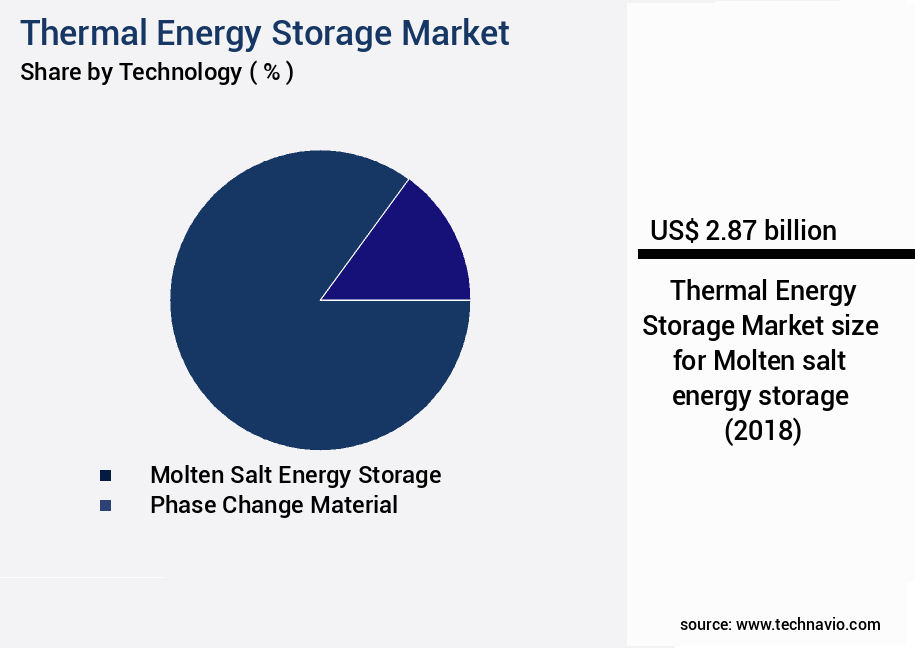
The Molten salt energy storage segment was valued at USD 2.87 billion in 2018 and showed a gradual increase during the forecast period.

Molten salt energy storage (MSES) dominates the market, accounting for over half of the global share, due to its use in large-scale solar plants, such as Concentrated Solar Power (CSP), for producing electricity around the clock. In CSP plants, MSES, like sodium nitrate and potassium nitrate, is heated by reflecting sunlight to temperatures up to 1,022 degrees Fahrenheit (550 degrees C), enabling energy storage and efficient power generation.

Thermal Energy Storage Market Size

Request Free Sample

Regional Analysis

Europe is estimated to contribute 30% to the growth of the global market during the forecast period. Technavio's analysts have elaborately explained the regional trends and drivers that shape the market during the forecast period.

Thermal Energy Storage Market Share by Geography

See How Thermal Energy Storage Market Demand is Rising in Europe Request Free Sample

The European market is experiencing significant growth due to the increasing adoption of renewable energy sources in the region. Governments are offering incentives and implementing regulations to accelerate the transition towards clean energy, leading to the installation of numerous renewable energy farms. By 2030, the European Union aims to source approximately 42% of its energy from renewable sources. Thermal energy storage plays a crucial role in the efficient utilization of renewable energy, particularly solar and wind, by storing excess energy during off-peak hours for use during peak demand periods.

This results in operational efficiency gains and cost reductions for energy providers and consumers. According to recent reports, the European market is projected to grow at an impressive rate, with installations increasing by over 20% annually. This growth is driven by the need to address energy storage challenges and maximize the utilization of renewable energy sources.

Thermal Energy Storage Market Share by Geography

 Customer Landscape of Thermal Energy Storage Industry

Competitive Intelligence by Technavio Analysis: Leading Players in the Thermal Energy Storage Market

Companies are implementing various strategies, such as strategic alliances, thermal energy storage market forecast, partnerships, mergers and acquisitions, geographical expansion, and product/service launches, to enhance their presence in the industry.

Abengoa SA - This company specializes in thermal energy storage solutions, featuring parabolic trough technology for clean energy generation and molten salt storage capabilities. 

The industry research and growth report includes detailed analyses of the competitive landscape of the market and information about key companies, including:

  • Abengoa SA
  • Acciona SA
  • ARANER
  • Baltimore Aircoil Co.
  • BrightSource Energy Inc.
  • Burns and McDonnell
  • Caldwell Energy Co.
  • CALMAC
  • Comfort Systems USA Inc.
  • CRYOGEL
  • DN Tanks Inc.
  • Dunham-Bush Holding Bhd
  • EnergyNest
  • EVAPCO Inc.
  • Goss Engineering
  • HTS
  • McDermott International Ltd.
  • SENER GRUPO DE INGENIERIA SA
  • Steffes LLC
  • Thermofin

Qualitative and quantitative analysis of companies has been conducted to help clients understand the wider business environment as well as the strengths and weaknesses of key industry players. Data is qualitatively analyzed to categorize companies as pure play, category-focused, industry-focused, and diversified; it is quantitatively analyzed to categorize companies as dominant, leading, strong, tentative, and weak.

Recent Development and News in Thermal Energy Storage Market

  • In August 2024, Siemens Energy and Microsoft announced a strategic partnership to integrate Microsoft Azure's digital services with Siemens' thermal energy storage solutions. This collaboration aimed to enhance the efficiency and flexibility of renewable energy systems by optimizing energy storage and grid management (Microsoft Press Release, August 2024).
  • In November 2024, Fluence Energy, a leading energy storage company, raised USD 150 million in a Series E funding round led by Koch Strategic Platforms and Temasek. This investment was earmarked for the expansion of the company's global footprint and the development of advanced thermal energy storage technologies (Fluence Energy Press Release, November 2024).
  • In February 2025, the European Investment Bank approved a €200 million loan to support the construction of a large-scale thermal energy storage project in Spain. The project, led by Spanish utility company Iberdrola, will store excess renewable energy and provide grid stabilization services (European Investment Bank Press Release, February 2025).
  • In May 2025, Macquarie's Green Investment Group acquired a 49% stake in the 100 MW/400 MWh molten salt thermal energy storage project in Arizona, US, from 8minute Solar Energy. The deal marked a significant step forward for large-scale thermal energy storage in the US renewable energy market (Macquarie Green Investment Group Press Release, May 2025).

Dive into Technavio's robust research methodology, blending expert interviews, extensive data synthesis, and validated models for unparalleled Thermal Energy Storage Market insights. See full methodology.

Market Scope

Report Coverage

Details

Page number

164

Base year

2023

Historic period

2018-2022

Forecast period

2024-2028

Growth momentum & CAGR

Accelerate at a CAGR of 9.61%

Market growth 2024-2028

USD 2.88 billion

Market structure

Fragmented

YoY growth 2023-2024(%)

9.41

Key countries

US, China, Japan, Germany, and UK

Competitive landscape

Leading Companies, Market Positioning of Companies, Competitive Strategies, and Industry Risks

Request Free Sample

Why Choose Technavio for Thermal Energy Storage Market Insights?

"Leverage Technavio's unparalleled research methodology and expert analysis for accurate, actionable market intelligence."

The thermal energy storage (TES) market encompasses various technologies designed to store thermal energy for later use. Two primary categories are sensible heat storage using molten salts and latent heat thermal energy storage (LHTES) using phase change materials (PCMs). Sensible heat storage systems maintain a constant temperature throughout the storage medium, while LHTES systems rely on the phase change properties of PCMs to absorb or release heat. Advanced thermal energy storage materials, such as metal hydrides in thermochemical energy storage, offer enhanced performance and efficiency. In the context of solar power plants, TES systems play a crucial role by providing energy stability and enabling the integration of intermittent renewable power sources. Modeling of thermal stratification in TES tanks and heat exchanger design optimization are essential for ensuring system efficiency and reliability. Life cycle cost analysis is a critical business function in the TES market, as it helps companies compare various storage options based on the total cost of ownership. TES integration with heat pumps and industrial processes is another significant application, allowing for waste heat recovery and improved building energy efficiency. Grid-scale TES systems enable power grid stabilization and improved operational planning by balancing electricity supply and demand. Control algorithm design and thermal storage system reliability and safety are essential considerations for TES market players. Optimization of thermal energy storage systems and performance evaluation metrics are crucial for assessing system efficiency and competitiveness. Environmental impact assessment and economic analysis are essential aspects of the TES market. For instance, a study comparing various TES technologies found that molten salt storage systems had a lower carbon footprint than LHTES systems, offering a competitive edge in the market. In summary, the TES market offers diverse applications and technologies, each with unique advantages and challenges. Effective modeling, optimization, and cost analysis are essential for businesses to make informed decisions and compete in this growing market.

What are the Key Data Covered in this Thermal Energy Storage Market Research and Growth Report?

  • What is the expected growth of the Thermal Energy Storage Market between 2024 and 2028?

    • USD 2.88 billion, at a CAGR of 9.61%

  • What segmentation does the market report cover?

    • The report is segmented by Technology (Molten salt energy storage and Phase change material), End-user (Industrial, Residential and commercial, and Utilities), and Geography (Europe, North America, APAC, Middle East and Africa, and South America)

  • Which regions are analyzed in the report?

    • Europe, North America, APAC, Middle East and Africa, and South America

  • What are the key growth drivers and market challenges?

    • Increasing demand for CSP, Rising demand from alternate sources of energy storage due to efficiency rate

  • Who are the major players in the Thermal Energy Storage Market?

    • Abengoa SA, Acciona SA, ARANER, Baltimore Aircoil Co., BrightSource Energy Inc., Burns and McDonnell, Caldwell Energy Co., CALMAC, Comfort Systems USA Inc., CRYOGEL, DN Tanks Inc., Dunham-Bush Holding Bhd, EnergyNest, EVAPCO Inc., Goss Engineering, HTS, McDermott International Ltd., SENER GRUPO DE INGENIERIA SA, Steffes LLC, and Thermofin

We can help! Our analysts can customize this thermal energy storage market research report to meet your requirements.

Get in touch

1 Executive Summary

  • 1.1 Market overview
    • Exhibit 01: Executive Summary – Chart on Market Overview
    • Exhibit 02: Executive Summary – Data Table on Market Overview
    • Exhibit 03: Executive Summary – Chart on Global Market Characteristics
    • Exhibit 04: Executive Summary – Chart on Market by Geography
    • Exhibit 05: Executive Summary – Chart on Market Segmentation by Technology
    • Exhibit 06: Executive Summary – Chart on Market Segmentation by End-user
    • Exhibit 07: Executive Summary – Chart on Incremental Growth
    • Exhibit 08: Executive Summary – Data Table on Incremental Growth
    • Exhibit 09: Executive Summary – Chart on Vendor Market Positioning

2 Market Landscape

  • 2.1 Market ecosystem
    • Exhibit 10: Parent market
    • Exhibit 11: Market Characteristics

3 Market Sizing

  • 3.1 Market definition
    • Exhibit 12: Offerings of vendors included in the market definition
  • 3.2 Market segment analysis
    • Exhibit 13: Market segments
  • 3.3 Market size 2023
    • 3.4 Market outlook: Forecast for 2023-2028
      • Exhibit 14: Chart on Global - Market size and forecast 2023-2028 ($ billion)
      • Exhibit 15: Data Table on Global - Market size and forecast 2023-2028 ($ billion)
      • Exhibit 16: Chart on Global Market: Year-over-year growth 2023-2028 (%)
      • Exhibit 17: Data Table on Global Market: Year-over-year growth 2023-2028 (%)

    4 Historic Market Size

    • 4.1 Global thermal energy storage market 2018 - 2022
      • Exhibit 18: Historic Market Size – Data Table on global thermal energy storage market 2018 - 2022 ($ billion)
    • 4.2 Technology Segment Analysis 2018 - 2022
      • Exhibit 19: Historic Market Size – Technology Segment 2018 - 2022 ($ billion)
    • 4.3 End-user Segment Analysis 2018 - 2022
      • Exhibit 20: Historic Market Size – End-user Segment 2018 - 2022 ($ billion)
    • 4.4 Geography Segment Analysis 2018 - 2022
      • Exhibit 21: Historic Market Size – Geography Segment 2018 - 2022 ($ billion)
    • 4.5 Country Segment Analysis 2018 - 2022
      • Exhibit 22: Historic Market Size – Country Segment 2018 - 2022 ($ billion)

    5 Five Forces Analysis

    • 5.1 Five forces summary
      • Exhibit 23: Five forces analysis - Comparison between 2023 and 2028
    • 5.2 Bargaining power of buyers
      • Exhibit 24: Chart on Bargaining power of buyers – Impact of key factors 2023 and 2028
    • 5.3 Bargaining power of suppliers
      • Exhibit 25: Bargaining power of suppliers – Impact of key factors in 2023 and 2028
    • 5.4 Threat of new entrants
      • Exhibit 26: Threat of new entrants – Impact of key factors in 2023 and 2028
    • 5.5 Threat of substitutes
      • Exhibit 27: Threat of substitutes – Impact of key factors in 2023 and 2028
    • 5.6 Threat of rivalry
      • Exhibit 28: Threat of rivalry – Impact of key factors in 2023 and 2028
    • 5.7 Market condition
      • Exhibit 29: Chart on Market condition - Five forces 2023 and 2028

    6 Market Segmentation by Technology

    • 6.1 Market segments
      • Exhibit 30: Chart on Technology - Market share 2023-2028 (%)
      • Exhibit 31: Data Table on Technology - Market share 2023-2028 (%)
    • 6.2 Comparison by Technology
      • Exhibit 32: Chart on Comparison by Technology
      • Exhibit 33: Data Table on Comparison by Technology
    • 6.3 Molten salt energy storage - Market size and forecast 2023-2028
      • Exhibit 34: Chart on Molten salt energy storage - Market size and forecast 2023-2028 ($ billion)
      • Exhibit 35: Data Table on Molten salt energy storage - Market size and forecast 2023-2028 ($ billion)
      • Exhibit 36: Chart on Molten salt energy storage - Year-over-year growth 2023-2028 (%)
      • Exhibit 37: Data Table on Molten salt energy storage - Year-over-year growth 2023-2028 (%)
    • 6.4 Phase change material - Market size and forecast 2023-2028
      • Exhibit 38: Chart on Phase change material - Market size and forecast 2023-2028 ($ billion)
      • Exhibit 39: Data Table on Phase change material - Market size and forecast 2023-2028 ($ billion)
      • Exhibit 40: Chart on Phase change material - Year-over-year growth 2023-2028 (%)
      • Exhibit 41: Data Table on Phase change material - Year-over-year growth 2023-2028 (%)
    • 6.5 Market opportunity by Technology
      • Exhibit 42: Market opportunity by Technology ($ billion)
      • Exhibit 43: Data Table on Market opportunity by Technology ($ billion)

    7 Market Segmentation by End-user

    • 7.1 Market segments
      • Exhibit 44: Chart on End-user - Market share 2023-2028 (%)
      • Exhibit 45: Data Table on End-user - Market share 2023-2028 (%)
    • 7.2 Comparison by End-user
      • Exhibit 46: Chart on Comparison by End-user
      • Exhibit 47: Data Table on Comparison by End-user
    • 7.3 Industrial - Market size and forecast 2023-2028
      • Exhibit 48: Chart on Industrial - Market size and forecast 2023-2028 ($ billion)
      • Exhibit 49: Data Table on Industrial - Market size and forecast 2023-2028 ($ billion)
      • Exhibit 50: Chart on Industrial - Year-over-year growth 2023-2028 (%)
      • Exhibit 51: Data Table on Industrial - Year-over-year growth 2023-2028 (%)
    • 7.4 Residential and commercial - Market size and forecast 2023-2028
      • Exhibit 52: Chart on Residential and commercial - Market size and forecast 2023-2028 ($ billion)
      • Exhibit 53: Data Table on Residential and commercial - Market size and forecast 2023-2028 ($ billion)
      • Exhibit 54: Chart on Residential and commercial - Year-over-year growth 2023-2028 (%)
      • Exhibit 55: Data Table on Residential and commercial - Year-over-year growth 2023-2028 (%)
    • 7.5 Utilities - Market size and forecast 2023-2028
      • Exhibit 56: Chart on Utilities - Market size and forecast 2023-2028 ($ billion)
      • Exhibit 57: Data Table on Utilities - Market size and forecast 2023-2028 ($ billion)
      • Exhibit 58: Chart on Utilities - Year-over-year growth 2023-2028 (%)
      • Exhibit 59: Data Table on Utilities - Year-over-year growth 2023-2028 (%)
    • 7.6 Market opportunity by End-user
      • Exhibit 60: Market opportunity by End-user ($ billion)
      • Exhibit 61: Data Table on Market opportunity by End-user ($ billion)

    8 Customer Landscape

    • 8.1 Customer landscape overview
      • Exhibit 62: Analysis of price sensitivity, lifecycle, customer purchase basket, adoption rates, and purchase criteria

    9 Geographic Landscape

    • 9.1 Geographic segmentation
      • Exhibit 63: Chart on Market share by geography 2023-2028 (%)
      • Exhibit 64: Data Table on Market share by geography 2023-2028 (%)
    • 9.2 Geographic comparison
      • Exhibit 65: Chart on Geographic comparison
      • Exhibit 66: Data Table on Geographic comparison
    • 9.3 Europe - Market size and forecast 2023-2028
      • Exhibit 67: Chart on Europe - Market size and forecast 2023-2028 ($ billion)
      • Exhibit 68: Data Table on Europe - Market size and forecast 2023-2028 ($ billion)
      • Exhibit 69: Chart on Europe - Year-over-year growth 2023-2028 (%)
      • Exhibit 70: Data Table on Europe - Year-over-year growth 2023-2028 (%)
    • 9.4 North America - Market size and forecast 2023-2028
      • Exhibit 71: Chart on North America - Market size and forecast 2023-2028 ($ billion)
      • Exhibit 72: Data Table on North America - Market size and forecast 2023-2028 ($ billion)
      • Exhibit 73: Chart on North America - Year-over-year growth 2023-2028 (%)
      • Exhibit 74: Data Table on North America - Year-over-year growth 2023-2028 (%)
    • 9.5 APAC - Market size and forecast 2023-2028
      • Exhibit 75: Chart on APAC - Market size and forecast 2023-2028 ($ billion)
      • Exhibit 76: Data Table on APAC - Market size and forecast 2023-2028 ($ billion)
      • Exhibit 77: Chart on APAC - Year-over-year growth 2023-2028 (%)
      • Exhibit 78: Data Table on APAC - Year-over-year growth 2023-2028 (%)
    • 9.6 Middle East and Africa - Market size and forecast 2023-2028
      • Exhibit 79: Chart on Middle East and Africa - Market size and forecast 2023-2028 ($ billion)
      • Exhibit 80: Data Table on Middle East and Africa - Market size and forecast 2023-2028 ($ billion)
      • Exhibit 81: Chart on Middle East and Africa - Year-over-year growth 2023-2028 (%)
      • Exhibit 82: Data Table on Middle East and Africa - Year-over-year growth 2023-2028 (%)
    • 9.7 South America - Market size and forecast 2023-2028
      • Exhibit 83: Chart on South America - Market size and forecast 2023-2028 ($ billion)
      • Exhibit 84: Data Table on South America - Market size and forecast 2023-2028 ($ billion)
      • Exhibit 85: Chart on South America - Year-over-year growth 2023-2028 (%)
      • Exhibit 86: Data Table on South America - Year-over-year growth 2023-2028 (%)
    • 9.8 US - Market size and forecast 2023-2028
      • Exhibit 87: Chart on US - Market size and forecast 2023-2028 ($ billion)
      • Exhibit 88: Data Table on US - Market size and forecast 2023-2028 ($ billion)
      • Exhibit 89: Chart on US - Year-over-year growth 2023-2028 (%)
      • Exhibit 90: Data Table on US - Year-over-year growth 2023-2028 (%)
    • 9.9 Germany - Market size and forecast 2023-2028
      • Exhibit 91: Chart on Germany - Market size and forecast 2023-2028 ($ billion)
      • Exhibit 92: Data Table on Germany - Market size and forecast 2023-2028 ($ billion)
      • Exhibit 93: Chart on Germany - Year-over-year growth 2023-2028 (%)
      • Exhibit 94: Data Table on Germany - Year-over-year growth 2023-2028 (%)
    • 9.10 China - Market size and forecast 2023-2028
      • Exhibit 95: Chart on China - Market size and forecast 2023-2028 ($ billion)
      • Exhibit 96: Data Table on China - Market size and forecast 2023-2028 ($ billion)
      • Exhibit 97: Chart on China - Year-over-year growth 2023-2028 (%)
      • Exhibit 98: Data Table on China - Year-over-year growth 2023-2028 (%)
    • 9.11 UK - Market size and forecast 2023-2028
      • Exhibit 99: Chart on UK - Market size and forecast 2023-2028 ($ billion)
      • Exhibit 100: Data Table on UK - Market size and forecast 2023-2028 ($ billion)
      • Exhibit 101: Chart on UK - Year-over-year growth 2023-2028 (%)
      • Exhibit 102: Data Table on UK - Year-over-year growth 2023-2028 (%)
    • 9.12 Japan - Market size and forecast 2023-2028
      • Exhibit 103: Chart on Japan - Market size and forecast 2023-2028 ($ billion)
      • Exhibit 104: Data Table on Japan - Market size and forecast 2023-2028 ($ billion)
      • Exhibit 105: Chart on Japan - Year-over-year growth 2023-2028 (%)
      • Exhibit 106: Data Table on Japan - Year-over-year growth 2023-2028 (%)
    • 9.13 Market opportunity by geography
      • Exhibit 107: Market opportunity by geography ($ billion)
      • Exhibit 108: Data Tables on Market opportunity by geography ($ billion)

    10 Drivers, Challenges, and Trends

    • 10.1 Market drivers
      • 10.2 Market challenges
        • 10.3 Impact of drivers and challenges
          • Exhibit 109: Impact of drivers and challenges in 2023 and 2028
        • 10.4 Market trends

          11 Vendor Landscape

          • 11.1 Overview
            • 11.2 Vendor landscape
              • Exhibit 110: Overview on Criticality of inputs and Factors of differentiation
            • 11.3 Landscape disruption
              • Exhibit 111: Overview on factors of disruption
            • 11.4 Industry risks
              • Exhibit 112: Impact of key risks on business

            12 Vendor Analysis

            • 12.1 Vendors covered
              • Exhibit 113: Vendors covered
            • 12.2 Market positioning of vendors
              • Exhibit 114: Matrix on vendor position and classification
            • 12.3 Abengoa SA
              • Exhibit 115: Abengoa SA - Overview
              • Exhibit 116: Abengoa SA - Product / Service
              • Exhibit 117: Abengoa SA - Key news
              • Exhibit 118: Abengoa SA - Key offerings
            • 12.4 ARANER
              • Exhibit 119: ARANER - Overview
              • Exhibit 120: ARANER - Product / Service
              • Exhibit 121: ARANER - Key offerings
            • 12.5 Baltimore Aircoil Co.
              • Exhibit 122: Baltimore Aircoil Co. - Overview
              • Exhibit 123: Baltimore Aircoil Co. - Product / Service
              • Exhibit 124: Baltimore Aircoil Co. - Key offerings
            • 12.6 Burns and McDonnell
              • Exhibit 125: Burns and McDonnell - Overview
              • Exhibit 126: Burns and McDonnell - Product / Service
              • Exhibit 127: Burns and McDonnell - Key offerings
            • 12.7 Caldwell Energy Co.
              • Exhibit 128: Caldwell Energy Co. - Overview
              • Exhibit 129: Caldwell Energy Co. - Product / Service
              • Exhibit 130: Caldwell Energy Co. - Key offerings
            • 12.8 CALMAC
              • Exhibit 131: CALMAC - Overview
              • Exhibit 132: CALMAC - Product / Service
              • Exhibit 133: CALMAC - Key offerings
            • 12.9 Comfort Systems USA Inc.
              • Exhibit 134: Comfort Systems USA Inc. - Overview
              • Exhibit 135: Comfort Systems USA Inc. - Product / Service
              • Exhibit 136: Comfort Systems USA Inc. - Key offerings
            • 12.10 DN Tanks Inc.
              • Exhibit 137: DN Tanks Inc. - Overview
              • Exhibit 138: DN Tanks Inc. - Product / Service
              • Exhibit 139: DN Tanks Inc. - Key offerings
            • 12.11 Dunham-Bush Holding Bhd
              • Exhibit 140: Dunham-Bush Holding Bhd - Overview
              • Exhibit 141: Dunham-Bush Holding Bhd - Product / Service
              • Exhibit 142: Dunham-Bush Holding Bhd - Key offerings
            • 12.12 EVAPCO Inc.
              • Exhibit 143: EVAPCO Inc. - Overview
              • Exhibit 144: EVAPCO Inc. - Product / Service
              • Exhibit 145: EVAPCO Inc. - Key offerings
            • 12.13 Goss Engineering
              • Exhibit 146: Goss Engineering - Overview
              • Exhibit 147: Goss Engineering - Product / Service
              • Exhibit 148: Goss Engineering - Key offerings
            • 12.14 HTS
              • Exhibit 149: HTS - Overview
              • Exhibit 150: HTS - Product / Service
              • Exhibit 151: HTS - Key offerings
            • 12.15 McDermott International Ltd.
              • Exhibit 152: McDermott International Ltd. - Overview
              • Exhibit 153: McDermott International Ltd. - Product / Service
              • Exhibit 154: McDermott International Ltd. - Key news
              • Exhibit 155: McDermott International Ltd. - Key offerings
            • 12.16 SENER GRUPO DE INGENIERIA SA
              • Exhibit 156: SENER GRUPO DE INGENIERIA SA - Overview
              • Exhibit 157: SENER GRUPO DE INGENIERIA SA - Product / Service
              • Exhibit 158: SENER GRUPO DE INGENIERIA SA - Key offerings
            • 12.17 Thermofin
              • Exhibit 159: Thermofin - Overview
              • Exhibit 160: Thermofin - Product / Service
              • Exhibit 161: Thermofin - Key offerings

            13 Appendix

            • 13.1 Scope of the report
              • 13.2 Inclusions and exclusions checklist
                • Exhibit 162: Inclusions checklist
                • Exhibit 163: Exclusions checklist
              • 13.3 Currency conversion rates for US$
                • Exhibit 164: Currency conversion rates for US$
              • 13.4 Research methodology
                • Exhibit 165: Research methodology
                • Exhibit 166: Validation techniques employed for market sizing
                • Exhibit 167: Information sources
              • 13.5 List of abbreviations
                • Exhibit 168: List of abbreviations

              Research Methodology

              Technavio presents a detailed picture of the market by way of study, synthesis, and summation of data from multiple sources. The analysts have presented the various facets of the market with a particular focus on identifying the key industry influencers. The data thus presented is comprehensive, reliable, and the result of extensive research, both primary and secondary.

              INFORMATION SOURCES

              Primary sources

              • Manufacturers and suppliers
              • Channel partners
              • Industry experts
              • Strategic decision makers

              Secondary sources

              • Industry journals and periodicals
              • Government data
              • Financial reports of key industry players
              • Historical data
              • Press releases

              DATA ANALYSIS

              Data Synthesis

              • Collation of data
              • Estimation of key figures
              • Analysis of derived insights

              Data Validation

              • Triangulation with data models
              • Reference against proprietary databases
              • Corroboration with industry experts

              REPORT WRITING

              Qualitative

              • Market drivers
              • Market challenges
              • Market trends
              • Five forces analysis

              Quantitative

              • Market size and forecast
              • Market segmentation
              • Geographical insights
              • Competitive landscape

              Interested in this report?

              Get your sample now to see our research methodology and insights!

              Download Now

              Frequently Asked Questions

              Thermal Energy Storage market growth will increase by $ 2.88 bn during 2024-2028.

              The Thermal Energy Storage market is expected to grow at a CAGR of 9.61% during 2024-2028.

              Thermal Energy Storage market is segmented by Technology( Molten salt energy storage, Phase change material) End-user( Industrial, Residential and commercial, Utilities, MEA, South America)

              Abengoa SA, Acciona SA, ARANER, Baltimore Aircoil Co., BrightSource Energy Inc., Burns and McDonnell, Caldwell Energy Co., CALMAC, Comfort Systems USA Inc., CRYOGEL, DN Tanks Inc., Dunham-Bush Holding Bhd, EnergyNest, EVAPCO Inc., Goss Engineering, HTS, McDermott International Ltd., SENER GRUPO DE INGENIERIA SA, Steffes LLC, Thermofin are a few of the key vendors in the Thermal Energy Storage market.

              Europe will register the highest growth rate of 30% among the other regions. Therefore, the Thermal Energy Storage market in Europe is expected to garner significant business opportunities for the vendors during the forecast period.

              US, China, Japan, Germany, UK

              • Increasing demand for CSPConcentrated Solar Power (CSP) is a significant player in the thermal energy storage market is the driving factor this market.
              • providing a novel approach to harnessing and storing solar energy for later use. CSP systems use mirrors or lenses to focus sunlight on a small area is the driving factor this market.
              • usually a receiver is the driving factor this market.
              • in order to generate high temperatures. The generated heat is then used to generate steam is the driving factor this market.
              • which powers a turbine connected to a generator is the driving factor this market.
              • resulting in electricity. CSP systems use a variety of solar collectors to concentrate sunlight. Examples include parabolic troughs is the driving factor this market.
              • solar power towers is the driving factor this market.
              • dish systems is the driving factor this market.
              • and linear Fresnel reflectors. These collectors direct sunlight onto a receiver is the driving factor this market.
              • amplifying the intensity of solar radiation. Thermal energy storage is a critical component in CSP systems. It captures excess solar energy during periods of high sunlight availability and stores it for future use. Molten salt is a common storage medium that can effectively retain heat over long periods of time. For instance is the driving factor this market.
              • Acciona SA offers solutions for thermal energy storage where the solar plants produce 249.80 MW (Megawatt) of energy in capacity is the driving factor this market.
              • which is later utilized for further purposes under the brand name Acciona. Thermal storage improves the system flexibility of solar plants by extending the contribution of solar electricity generation to improve their coincidence with the normal demand. Thermal energy storage accomplishes this by reducing the constraints of ramping and minimum generation levels in CSP plants. By using thermal energy storage in CSP plants is the driving factor this market.
              • power can be generated in adverse weather conditions as well without almost or no reduction in the operating efficiency. Also is the driving factor this market.
              • the cost of electricity generation using CSP plants has reduced tremendously since 2020. These factors have resulted in new installations of CSP plants. These plants use thermal energy storage is the driving factor this market.
              • as they can withstand much higher temperatures when compared with alternate storage technologies such as batteries. Therefore is the driving factor this market.
              • thermal energy storage has become the primary source of energy storage in CSP plants. The rising demand for CSPs will drive the growth of the global thermal energy storage market during the forecast period. is the driving factor this market.

              The Thermal Energy Storage market vendors should focus on grabbing business opportunities from the Molten salt energy storage segment as it accounted for the largest market share in the base year.
              RIA - Research AI Assistant
              Ask RIA