Waste Heat Recovery Market Size 2024-2028
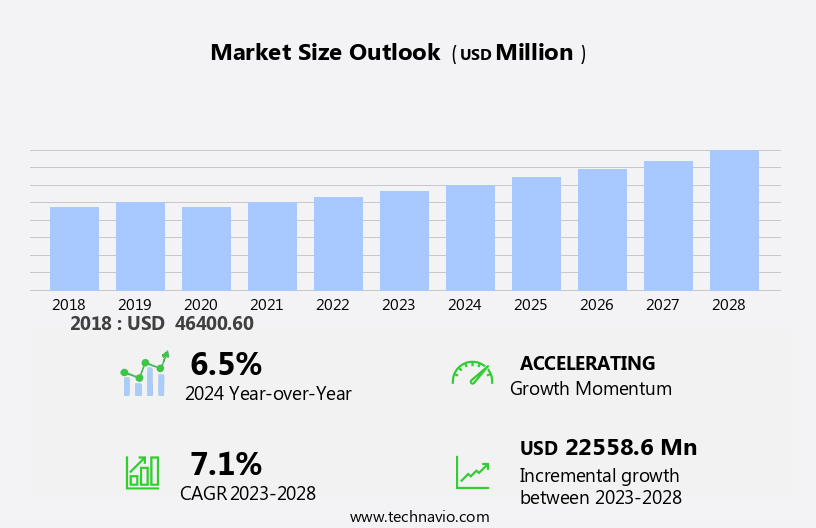
The waste heat recovery market size is forecast to increase by USD 22.56 billion at a CAGR of 7.1% between 2023 and 2028.
- The market is experiencing significant growth due to the rise in industrialization, particularly in BRICS countries. This trend is driven by the increasing demand for energy efficiency and cost savings in various industries. Another emerging trend is the use of direct waste heat recovery using thermoelectric materials, which offers higher efficiency and lower emissions compared to traditional methods. Heat exchanger technology plays a pivotal role in this market, facilitating the transfer from a source to a destination, thereby enhancing energy efficiency and reducing greenhouse gas emissions. However, challenges persist in the form of concerns related to fouling in the systems, which can lead to downtime and increased maintenance costs. To mitigate these challenges, advancements in materials science and system design are being explored to improve durability and reliability. Overall, the market is expected to continue its growth trajectory, driven by these trends and the need to reduce waste and improve sustainability.
What will be the Size of the Waste Heat Recovery Market During the Forecast Period?
- The market is a significant segment of the clean technologies sector, gaining momentum. This market focuses on the utilization of thermal energy from various industrial processes and exhaust gases to generate electricity or produce heat for space heating, hot water, and other applications. Sensors and digital controls enable real-time monitoring and optimization of the source temperature, ensuring efficient power generation and minimizing installation challenges.
- The market trends include the adoption of cascade systems for utilizing low-temperature heat and the integration of organic Rankine cycle technology for improved carbon emission reduction. The construction sector, particularly in cement production, is a significant consumer due to the preheating application. Installation challenges persist, particularly in relation to combustion air requirements and furnace loads. However, advancements in technology, such as improved heat exchanger materials and heat exchanger corrosion mitigation strategies, are addressing these challenges. Overall, the market offers substantial opportunities for energy-efficient solutions, contributing to a more sustainable landscape.
How is this Waste Heat Recovery Industry segmented and which is the largest segment?
The industry research report provides comprehensive data (region-wise segment analysis), with forecasts and estimates in "USD billion" for the period 2024-2028, as well as historical data from 2018-2022 for the following segments.
- End-user
- Chemical
- Petroleum refining
- Paper
- Commercial and institutional
- Others
- Geography
- North America
- US
- Europe
- Germany
- APAC
- China
- Japan
- South Korea
- Middle East and Africa
- South America
- North America
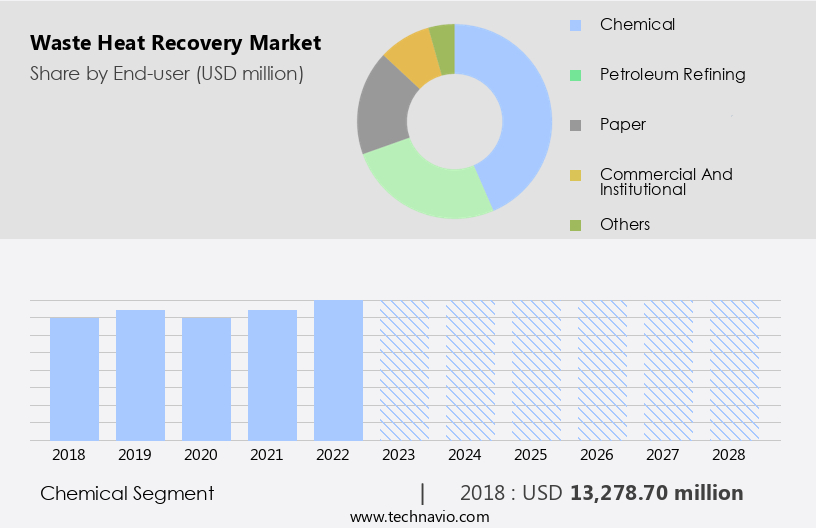
By End-user Insights
- The chemical segment is estimated to witness significant growth during the forecast period.
The chemical industry, which encompasses the production of polymers, petrochemicals, agrochemicals, pharmaceuticals, fertilizers, and dyes, is characterized by energy-intensive processes that generate substantial waste heat. These high-temperature processes, including inorganic and organic chemical production, consume vast quantities of thermal and electrical energy. Consequently, there is a growing demand to enhance energy efficiency and reduce costs. In the chemical sector, recovered waste heat can be utilized to preheat mill water and chlorine dioxide in chemical pulp mills. The chemical industry is experiencing notable expansion in key markets such as the US and China, driven by increasing demands for petrochemicals, pesticides and fertilizers, synthetic rubber, and other chemical products. Energy transition, climate change mitigation, and energy conservation are top priorities for industries worldwide, necessitating the adoption of clean technologies and energy-efficient solutions.
Furthermore, these play a crucial role in this regard, offering significant potential for carbon emission reduction and contributing to climate action plans. These systems can be implemented through various methods, including liquid-liquid phase systems and liquid-gas phase systems, and employ advanced technologies such as heat exchangers, sensors, digital controls, real-time monitoring, and the Organic Rankine Cycle. Despite the challenges associated with installation and maintenance, the benefits far outweigh the costs, particularly in energy-intensive industries. By harnessing waste heat, industries can reduce their reliance on fossil fuels, lower greenhouse gas emissions, and optimize the usage, contributing to on-site power generation and overall energy efficiency.
Get a glance at the Industry report of share of various segments Request Free Sample
The chemical segment was valued at USD 13.28 billion in 2018 and showed a gradual increase during the forecast period.
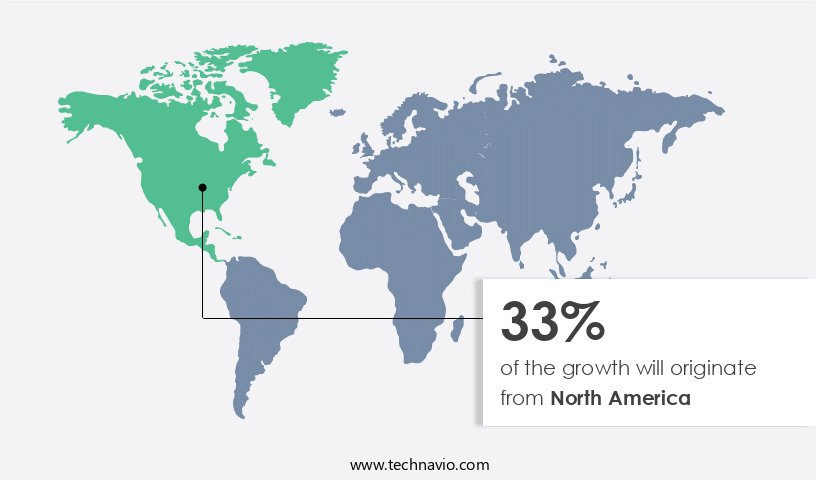
Regional Analysis
- North America is estimated to contribute 33% to the growth of the global market during the forecast period.
Technavio's analysts have elaborately explained the regional trends and drivers that shape the market during the forecast period.
For more insights on the market share of various regions, Request Free Sample
The North American market dominates the market due to substantial investments in modernizing industrial processes for enhanced economic returns and fuel efficiency. With industrial consumption accounting for approximately 25% of the total usage and 25% of greenhouse gas emissions In the US, there is a pressing need to address CO2 emissions. Strict regulations such as the Clean Air Act aim to reduce hazardous air pollutants, including CO2, mercury, and particulate matter. Industrial sectors in North America, including petroleum refining, metal production, and chemical, contribute significantly to CO2 emissions. To comply with emission standards and minimize energy costs, industries are adopting energy-efficient solutions.
Furthermore, these systems, which include sensors, digital controls, real-time monitoring, and heat source temperature optimization, enable on-site power generation and energy conservation. Technologies such as Organic Rankine Cycle, Liquid-Liquid Phase System, and Liquid-Gas Phase System are being employed to recover and convert it into usable energy. The construction sector, particularly in preheating applications, also benefits. The transition, climate change mitigation, and climate action plans further focus on the importance of reducing carbon emissions and increasing energy efficiency. Advanced control systems and IoT sensors play a crucial role in optimizing performance and minimizing corrosion.
Market Dynamics
Our market researchers analyzed the data with 2023 as the base year, along with the key drivers, trends, and challenges. A holistic analysis of drivers will help companies refine their marketing strategies to gain a competitive advantage.
What are the key market drivers leading to the rise In the adoption of Waste Heat Recovery Industry?
The rise in industrialization in BRICS is the key driver of the market.
- The market is experiencing significant growth due to the increasing focus on energy efficiency and carbon footprint reduction In the industrial sector. With the transition towards clean technologies, there is a growing demand for energy-efficient solutions that can minimize greenhouse gas emissions. Thermal energy, derived from waste heat, is an attractive alternative to traditional energy sources, as it reduces costs and lowers carbon emissions. Sensors, digital controls, and real-time monitoring systems play a crucial role in optimizing heat source temperature and maximizing recovery. Power generation, steam generation, and petroleum refining industries are major consumers of waste heat, with CO2 emissions being a significant concern. The construction sector, particularly in cement production, also presents a substantial opportunity through preheating applications.
- Furthermore, the increasing costs, climate change, and supply crisis have led to the adoption of on-site power generation and energy conservation strategies. The climate action plan focuses on the importance of advanced control systems, IoT sensors, and smart technologies in reducing industrial emissions. Organic Rankine Cycle systems, cascade systems, and heat exchanger technologies are gaining popularity for their ability to recover low-temperature heat and convert it into usable energy. Despite the benefits, installation challenges such as exchanger corrosion and furnace loads remain significant barriers to market growth. Boiler feed water and combustion air management are essential considerations for effective recovery. The market is expected to grow steadily during the forecast period, driven by the need for carbon emission reduction and the alignment with climate goals.
What are the market trends shaping the Waste Heat Recovery Industry?
The emergence of direct waste heat recovery using thermoelectric materials is the upcoming market trend.
- Waste heat recovery is a significant issue In the industrial sector, as the energy transition towards clean technologies necessitates reducing carbon footprint and greenhouse gas emissions. The financial implications of high costs and CO2 emissions make conservation a priority. Waste heat, generated from various industrial processes, can be harnessed to produce thermal energy, reducing the demand for primary sources. Sensors, digital controls, and real-time monitoring systems enable effective recovery by optimizing heat source temperature and efficiency. Thermal energy can be generated through various systems, such as liquid-liquid phase systems and liquid-gas phase systems, for power generation, steam generation, and space heating applications.
- Furthermore, carbon emission reduction is a critical climate action plan goal. Industrial processes, including petroleum refining, metal production, chemical manufacturing, and electricity generation, contribute significantly to greenhouse gas emissions. Waste heat recovery through advanced technologies like Organic Rankine Cycle systems can help mitigate these emissions. Installation challenges, such as corrosion and furnace loads, necessitate the use of energy-efficient solutions. IoT sensors and advanced control systems can help monitor and manage heat exchanger performance and optimize boiler feed water temperatures. Effective waste heat recovery can help industries meet climate goals while reducing costs. The market for clean technologies is expected to grow as industries seek to improve their environmental performance and operational efficiency.
What challenges does the Waste Heat Recovery Industry face during its growth?
Concerns related to fouling in waste heat recovery systems are a key challenge affecting the industry's growth.
- Waste heat recovery is a critical component of industrial processes in reducing carbon footprint and mitigating greenhouse gas emissions in various sectors, including petroleum refining, metal production, chemical, and cement. Financial incentives, climate action plans, and energy conservation initiatives drive the adoption of clean technologies such as sensors, digital controls, and real-time monitoring to optimize efficiency and minimize costs. However, they face challenges, including heat source temperature fluctuations, corrosion in the exchangers, and fouling. Fouling, the deposition or accumulation of unwanted materials on equipment surfaces, can significantly impact system performance and reliability. Industrial exhausts, with moisture and contaminants like alumina particulates, and low-temperature waste heat streams containing water vapor and fibers, pose challenges in maintaining heat transfer efficiency and preventing plugging of gas passages.
- Furthermore, the systems, such as the Organic Rankine Cycle, Liquid-Liquid Phase System, and Liquid-Gas Phase System, are essential for on-site power generation and steam generation applications. The transition and climate change concerns necessitate the implementation of advanced control systems and IoT sensors to monitor the source temperature, combustion air, furnace loads, boiler feed water, and cascade system performance in real-time. Addressing fouling challenges through improved materials selection, regular maintenance, and advanced filtration systems can enhance system efficiency and contribute to carbon emission reduction, aligning with climate goals and efficiency objectives.
Exclusive Customer Landscape
The market forecasting report includes the adoption lifecycle of the market, market growth and forecasting, covering from the innovator's stage to the laggard's stage. It focuses on adoption rates in different regions based on penetration. Furthermore, the market report also includes key purchase criteria and drivers of price sensitivity to help companies evaluate and develop their market growth analysis strategies.

Customer Landscape
Key Companies & Market Insights
Companies are implementing various strategies, such as strategic alliances, market forecast, partnerships, mergers and acquisitions, geographical expansion, and product/service launches, to enhance their presence In the industry. The industry research and growth report includes detailed analyses of the competitive landscape of the market and information about key companies, including:
- ABB Ltd.
- Alfa Laval AB
- ALSTOM SA
- Cannon Spa
- Clean Energy Technologies Inc.
- Econotherm Ltd.
- Forbes Marshall Pvt. Ltd.
- GEA Group AG
- General Electric Co.
- John Wood Group PLC
- KNM Group Berhad
- Mitsubishi Heavy Industries Ltd
- Muhibbah Engineering M Bhd.
- Ormat Technologies Inc.
- Promec Engineering Ltd.
- Questor Technology Inc.
- Robert Bosch GmbH
- Siemens AG
- Thermax Ltd.
- Transparent Energy Systems Pvt. Ltd.
Qualitative and quantitative analysis of companies has been conducted to help clients understand the wider business environment as well as the strengths and weaknesses of key industry players. Data is qualitatively analyzed to categorize companies as pure play, category-focused, industry-focused, and diversified; it is quantitatively analyzed to categorize companies as dominant, leading, strong, tentative, and weak.
Research Analyst Overview
The industrial sector is a significant contributor to global greenhouse gas emissions, with a substantial portion of these emissions stemming from the waste heat generated during various processes. Financial institutions and governments worldwide are increasingly focusing on the implementation of clean technologies to reduce carbon footprints and mitigate the impact of climate change. One such area of focus offers numerous benefits in terms of energy conservation and cost savings. Waste heat, which is the heat generated as a byproduct of industrial processes, can be harnessed and utilized for various applications such as space heating, steam generation, and power generation. This not only reduces the demand for primary sources but also leads to a significant reduction in carbon emissions. Thermal energy can be recovered using various methods, including liquid-liquid phase systems and liquid-gas phase systems. These systems utilize the temperature difference between the waste heat source and the desired application.
Furthermore, the Organic Rankine Cycle (ORC) is a popular method for generating electricity from waste heat, while preheating applications in industries like cement and metal production can benefit from the use of waste heat for process requirements. The integration of sensors, digital controls, and real-time monitoring systems plays a crucial role in optimizing the processes. These technologies enable precise control of the source temperature, combustion air, furnace loads, and boiler feed water, ensuring maximum efficiency and minimal heat loss. The cascade system is another effective method for utilizing low-temperature heat, where the waste heat from one process is used as the source for another process with a lower temperature requirement. This not only reduces costs but also minimizes the carbon emissions from industrial processes. Despite the numerous benefits, there are challenges associated with its implementation. Corrosion and the high capital costs of installing these are some of the key challenges.
However, the adoption of advanced control systems, IoT sensors, and smart technologies is helping to mitigate these challenges and make them a viable and cost-effective solution for industries. The energy transition towards renewable energy sources and the increasing focus on efficiency and carbon emission reduction are driving the demand. Industries, particularly those that are energy-intensive, are under pressure to reduce their carbon footprint and meet climate goals. On-site power generation and the use of waste heat for heating and cooling applications are becoming increasingly popular as industries seek to become more energy-independent and reduce their reliance on primary sources. In summary, it is an essential component of the energy transition and a critical step towards reducing industrial carbon emissions. The use of thermal energy from waste heat sources for various applications, such as space heating, steam generation, and power generation, offers numerous benefits in terms of conservation, cost savings, and carbon emission reduction. The challenges such as corrosion in heat exchangers and high capital costs, are being addressed through the adoption of advanced technologies and smart systems. The future looks promising, with increasing demand from industries seeking to reduce their carbon footprint and become more energy efficient.
|
Waste Heat Recovery Market Scope |
|
|
Report Coverage |
Details |
|
Page number |
160 |
|
Base year |
2023 |
|
Historic period |
2018-2022 |
|
Forecast period |
2024-2028 |
|
Growth momentum & CAGR |
Accelerate at a CAGR of 7.1% |
|
Market growth 2024-2028 |
USD 22.56 billion |
|
Market structure |
Fragmented |
|
YoY growth 2023-2024(%) |
6.5 |
|
Key countries |
US, China, Japan, Germany, and South Korea |
|
Competitive landscape |
Leading Companies, Market Positioning of Companies, Competitive Strategies, and Industry Risks |
What are the Key Data Covered in this Waste Heat Recovery Market Research and Growth Report?
- CAGR of the industry during the forecast period
- Detailed information on factors that will drive the growth and forecasting between 2024 and 2028
- Precise estimation of the size of the market and its contribution of the industry in focus to the parent market
- Accurate predictions about upcoming growth and trends and changes in consumer behaviour
- Growth of the market across North America, Europe, APAC, Middle East and Africa, and South America
- Thorough analysis of the market's competitive landscape and detailed information about companies
- Comprehensive analysis of factors that will challenge the market growth of industry companies
We can help! Our analysts can customize this market research report to meet your requirements.
 RIA -
RIA - 
