Container And Packaging Market Size 2025-2029
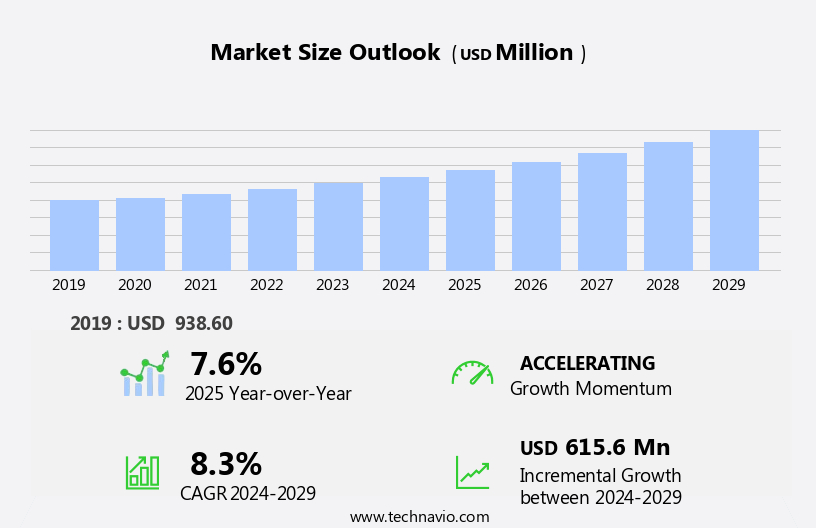
The container and packaging market size is forecast to increase by USD 615.6 million at a CAGR of 8.3% between 2024 and 2029.
- The market is experiencing significant growth, driven by the increasing trend towards e-commerce and the resulting demand for efficient and sustainable solutions. With online sales continuing to rise, there is a heightened focus on optimizing supply chain logistics and reducing transportation costs through the use of standardized containers and efficient packaging designs. Additionally, consumer preferences are shifting towards more eco-friendly options, creating a strong demand for sustainable materials and recyclable packaging solutions. However, this market is not without challenges. The rising cost of raw materials, particularly for plastics and metals, is putting pressure on manufacturers to find cost-effective alternatives while maintaining quality and performance.
- Furthermore, stringent regulations regarding the use and disposal of certain materials, such as single-use plastics, are adding complexity to the market landscape. Companies seeking to capitalize on these opportunities must stay informed of regulatory changes and invest in research and development to bring innovative, sustainable solutions to market. By addressing these challenges and leveraging emerging trends, players in the market can position themselves for long-term success.
What will be the Size of the Container And Packaging Market during the forecast period?

Request Free Sample
- The market encompasses a diverse range of industries producing and supplying various types of containers and packaging solutions. Key market drivers include the growing demand for plastic-based packaging, particularly in sectors such as food and beverage, pharmaceuticals, and industrial chemicals. Sterile bulk containers, metal drums, and glass jars are also prominent in this market, catering to the needs of industries dealing with liquid substrates, solvents, and other hazardous materials. International borders pose challenges in the market due to the complexities of international trade and transportation. Electronic commerce and shipping routes have significantly impacted the market, leading to increased demand for efficient supply chain processes, shipment tracking, and shipment quantities.
- Industrial plants rely on a steady supply of containers and packaging to meet production demands, while the need for secure and reliable transportation remains a critical consideration. Overall, the market is a dynamic and evolving industry, adapting to the changing demands of various sectors and global markets.
How is this Container And Packaging Industry segmented?
The container and packaging industry research report provides comprehensive data (region-wise segment analysis), with forecasts and estimates in "USD million" for the period 2025-2029, as well as historical data from 2019-2023 for the following segments.
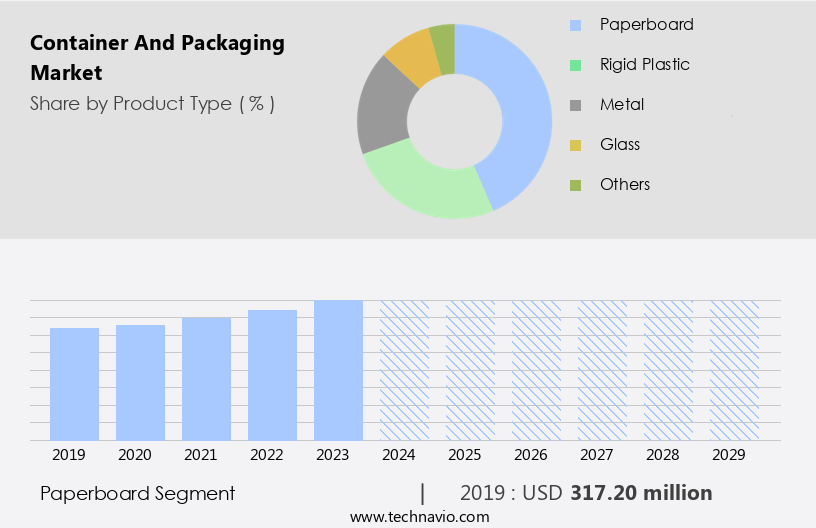
- Product Type
- Paperboard
- Rigid plastic
- Metal
- Glass
- Others
- End-user
- Food and beverage
- Healthcare
- Industrial
- Personal care
- Others
- Type Of Packaging
- Rigid packaging
- Flexible packaging
- Corrugated packaging
- Cartons and boxes
- Bottles and jars
- Type
- Primary packaging
- Secondary packaging
- Tertiary packaging
- Specialty packaging
- Protective packaging
- Geography
- APAC
- China
- India
- Japan
- South Korea
- North America
- Europe
- Middle East and Africa
- South America
- Rest of World (ROW)
By Product Type Insights
The paperboard segment is estimated to witness significant growth during the forecast period. The market encompasses various materials, with the paperboard segment experiencing significant growth. Paperboard, an adaptable material derived from thick paper, is preferred for its lightweight and eco-friendliness. Driven by increasing consumer awareness and the expansion of e-commerce, the paperboard segment's demand increases. Paperboard's advantages, such as recyclability, biodegradability, and a reduced carbon footprint, make it an attractive choice for storing and shipping a wide range of products, including feedstock for industrial plants, sterile bulk liquids, solvents, and hazardous items. Paperboard containers are utilized for manufacturing corrugated boxes, folding cartons, tubes, and cores.
The paperboard segment's dependability is further enhanced by regulatory organizations' stringent safety standards for handling and transporting various substances, such as explosive items, radioactive materials, and toxic items. The supply chain process benefits from paperboard's durability, shipping routes' efficiency, and tracking facilities' ease of use. Additionally, the pooling networks and reconditioning infrastructure support cost savings and sustainability.

Get a glance at the market report of share of various segments Request Free Sample
The Paperboard segment was valued at USD 317.20 million in 2019 and showed a gradual increase during the forecast period.
Regional Analysis
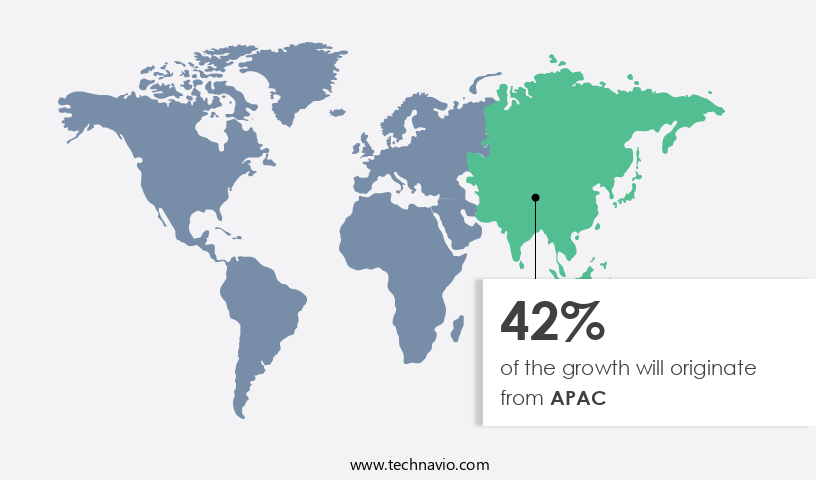
APAC is estimated to contribute 42% to the growth of the global market during the forecast period. Technavio's analysts have elaborately explained the regional trends and drivers that shape the market during the forecast period.

For more insights on the market size of various regions, Request Free Sample
The Asia-Pacific (APAC) region is a significant player in The market, with a substantial share in both consumption and production. Industries such as electronics, automotive, pharmaceuticals, and consumer products, which have a substantial production base in APAC, drive the demand for packaging and containers due to their export-focused nature. China, Japan, India, South Korea, and Australia are the key countries contributing to the expansion of the regional market. China, in particular, is the world's largest manufacturer and consumer of packaging materials. The need for and dependable containers and packaging solutions for the transportation and distribution of various commodities is a primary market dynamic.
The market encompasses various types of containers, including Industrial Bulk Containers (IBCs), Rigid Bulk Containers, and Flexible Intermediate Bulk Containers (FIBCs), used for storing and shipping liquids, solvents, and other substances for industrial plants and shipping purposes. The supply chain process, including shipping routes and tracking facilities, is crucial in ensuring the timely and efficient delivery of these containers. The market caters to diverse industries, including those dealing with hazardous items, explosive and combustible items, radioactive substances, and toxic items. The use of biodegradable materials and reusable bulk containers is also gaining popularity due to environmental concerns.
The durability and lightness of plastic-based packaging and plastic drums are essential factors influencing the market's growth. Regulatory organizations play a crucial role in ensuring the safety and compliance of containers and packaging materials, particularly in international trade.
Market Dynamics
Our researchers analyzed the data with 2024 as the base year, along with the key drivers, trends, and challenges. A holistic analysis of drivers will help companies refine their marketing strategies to gain a competitive advantage.
What are the key market drivers leading to the rise in the adoption of Container And Packaging Industry?
- The growth of e-commerce is the key driver of the market. The market has experienced significant growth due to the expansion of the e-commerce industry. With online shopping gaining popularity worldwide, the demand for packaging materials and solutions has risen. E-commerce retailers and logistics providers require innovative packaging to ensure the safe and secure transportation of products. Innovative packaging solutions, such as corrugated boxes, air-filled cushions, and protective foam, have become essential for e-commerce businesses to maintain the integrity of their products during transit.
- These packaging materials offer resistance to the rigors of long-distance transportation and protection against damage. The market's growth is driven by the increasing demand for efficient and reliable packaging solutions that cater to the unique needs of e-commerce businesses.
What are the market trends shaping the Container And Packaging Industry?
- Sustainability in containers and packaging solutions is the upcoming market trend. The market is witnessing significant attention towards sustainability as businesses strive to minimize their carbon footprint and waste generation in response to growing environmental consciousness and regulations. Consumer preference for eco-friendly packaging solutions is fueling the demand for sustainable alternatives. To achieve sustainability goals, the market is employing various strategies, including: 1. Reducing Material Waste: A crucial aspect of sustainable packaging is minimizing the production of packaging material waste.
- Techniques such as lightweighting, downsizing, and utilizing materials with a higher recycled content are being adopted by market players. By focusing on these tactics, the container and packaging industry can make a substantial contribution towards environmental sustainability while catering to evolving consumer preferences.
What challenges does the Container And Packaging Industry face during its growth?
- Rising cost of raw materials is a key challenge affecting the industry growth. The market faces significant challenges due to increasing raw material prices. Key materials, such as plastics, metals, paper, and glass, are essential for manufacturing containers and packaging solutions. However, the volatility of raw material costs can negatively impact market profitability and sustainability. Global economic conditions and geopolitical tensions are primary drivers of these price fluctuations.
- Trade disputes, embargoes, and political instability in major producing regions can disrupt supply and demand dynamics, leading to price volatility. Market players must closely monitor these factors to mitigate risks and maintain competitiveness.
Exclusive Customer Landscape
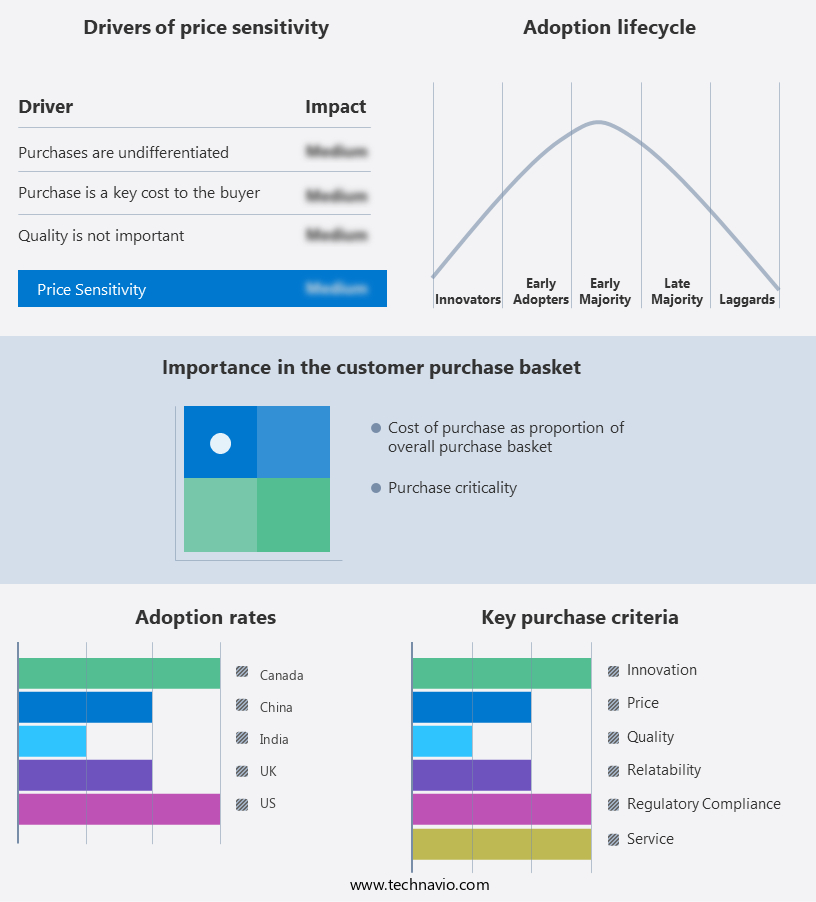
The container and packaging market forecasting report includes the adoption lifecycle of the market, covering from the innovator's stage to the laggard's stage. It focuses on adoption rates in different regions based on penetration. Furthermore, the container and packaging market report also includes key purchase criteria and drivers of price sensitivity to help companies evaluate and develop their market growth analysis strategies.

Customer Landscape
Key Companies & Market Insights
Companies are implementing various strategies, such as strategic alliances, container and packaging market forecast, partnerships, mergers and acquisitions, geographical expansion, and product/service launches, to enhance their presence in the industry.
Ace Packaging - The company specializes in providing innovative container and packaging solutions for various industries, including food, beverage, healthcare, and home and personal care products.
The industry research and growth report includes detailed analyses of the competitive landscape of the market and information about key companies, including:
- Ace Packaging
- Amcor Plc
- Berry Global Inc.
- Buscherhoff Packaging Solutions GmbH
- BWAY Corp.
- Container and Packaging Supply Inc.
- DS Smith Plc
- Greif Inc.
- Hoover Circular Solutions
- International Paper Co.
- Mold Tek Packaging Ltd.
- Mondi Plc
- MY Flexitank Industries Sdn Bhd
- Qingdao LAF Packaging Co. Ltd.
- Jiangsu Rongtai Glass Products Co. Ltd.
- Sealed Air Corp.
- Teijin Ltd.
- The Packaging Co.
- WestRock Co.
- Winpak Ltd.
Qualitative and quantitative analysis of companies has been conducted to help clients understand the wider business environment as well as the strengths and weaknesses of key industry players. Data is qualitatively analyzed to categorize companies as pure play, category-focused, industry-focused, and diversified; it is quantitatively analyzed to categorize companies as dominant, leading, strong, tentative, and weak.
Research Analyst Overview
The market encompasses a diverse range of products and applications, serving various industries and supply chain processes. At the core of this market are feedstocks, which serve as the raw materials for the production of containers and packaging solutions. These feedstocks can include a variety of liquid substrates, such as solvents, as well as rigid intermediates like metal and plastic-based materials. The demand for container and packaging solutions is driven by several factors. One significant factor is the need for efficient and reliable transportation of goods, both domestically and internationally. Containers play a crucial role in this regard, providing a secure and durable means of shipping products across shipping routes.
This is particularly important for industries that deal with hazardous or explosive items, which require specialized containers to ensure safe transport. Another factor driving the growth of the market is the increasing trend towards electronic commerce. As more businesses move towards online sales, there is a growing demand for packaging solutions that can effectively protect and transport products to customers. This has led to the development of innovative packaging solutions, such as reusable bulk containers and flexible intermediate bulk containers (FIBCs), which offer lightweight transportation and improved supply chain efficiency. Regulatory organizations play a crucial role in shaping the market.
These organizations set standards and guidelines for the production and use of containers and packaging solutions, ensuring that they meet safety and quality requirements. This is particularly important for industries dealing with toxic or radioactive substances, which require specialized containers to prevent leaks or contamination. The durability and dependability of containers and packaging solutions are also critical factors in their adoption. Containers must be able to withstand the rigors of shipping and handling, while packaging solutions must be able to protect products during transport and storage. This has led to the development of advanced materials, such as biodegradable materials and glass, which offer improved durability and sustainability.
Pooling networks have also emerged as an important trend in the market. These networks allow companies to share resources, such as reusable bulk containers and plastic drums, reducing the need for each company to maintain its own inventory. This not only saves costs but also reduces the environmental impact of the industry. The market is a dynamic and evolving industry, driven by factors such as transportation needs, electronic commerce, and regulatory requirements. Innovations in materials and technologies continue to shape the market, offering new solutions for industries dealing with a wide range of products and shipping purposes.
The focus on sustainability and efficiency is also driving the adoption of advanced packaging solutions, such as reusable and biodegradable containers, which offer improved durability and reduced environmental impact.
|
Market Scope
|
|
Report Coverage
|
Details
|
|
Page number
|
252
|
|
Base year
|
2024
|
|
Historic period
|
2019-2023 |
|
Forecast period
|
2025-2029
|
|
Growth momentum & CAGR
|
Accelerate at a CAGR of 8.3%
|
|
Market growth 2025-2029
|
USD 615.6 million
|
|
Market structure
|
Fragmented
|
|
YoY growth 2024-2025(%)
|
7.6
|
|
Key countries
|
US, China, Japan, India, Germany, Canada, France, South Korea, Brazil, UK, UAE, and Rest of World (ROW)
|
|
Competitive landscape
|
Leading Companies, Market Positioning of Companies, Competitive Strategies, and Industry Risks
|
Request Free Sample
What are the Key Data Covered in this Container And Packaging Market Research and Growth Report?
- CAGR of the Container And Packaging industry during the forecast period
- Detailed information on factors that will drive the growth and forecasting between 2025 and 2029
- Precise estimation of the size of the market and its contribution of the industry in focus to the parent market
- Accurate predictions about upcoming growth and trends and changes in consumer behaviour
- Growth of the market across APAC, North America, Europe, Middle East and Africa, and South America
- Thorough analysis of the market's competitive landscape and detailed information about companies
- Comprehensive analysis of factors that will challenge the container and packaging market growth of industry companies
We can help! Our analysts can customize this container and packaging market research report to meet your requirements.
Get in touch
1 Executive Summary
- 1.1 Market overview
- Executive Summary - Chart on Market Overview
- Executive Summary - Data Table on Market Overview
- Executive Summary - Chart on Global Market Characteristics
- Executive Summary - Chart on Market by Geography
- Executive Summary - Chart on Market Segmentation by Product Type
- Executive Summary - Chart on Market Segmentation by End-user
- Executive Summary - Chart on Market Segmentation by Type of Packaging
- Executive Summary - Chart on Market Segmentation by Type
- Executive Summary - Chart on Incremental Growth
- Executive Summary - Data Table on Incremental Growth
- Executive Summary - Chart on Company Market Positioning
2 Technavio Analysis
- 2.1 Analysis of price sensitivity, lifecycle, customer purchase basket, adoption rates, and purchase criteria
- Analysis of price sensitivity, lifecycle, customer purchase basket, adoption rates, and purchase criteria
- 2.2 Criticality of inputs and Factors of differentiation
- Overview on criticality of inputs and factors of differentiation
- 2.3 Factors of disruption
- Overview on factors of disruption
- 2.4 Impact of drivers and challenges
- Impact of drivers and challenges in 2024 and 2029
3 Market Landscape
- 3.1 Market ecosystem
- Parent Market
- Data Table on - Parent Market
- 3.2 Market characteristics
- Market characteristics analysis
4 Market Sizing
- 4.1 Market definition
- Offerings of companies included in the market definition
- 4.2 Market segment analysis
- 4.4 Market outlook: Forecast for 2024-2029
- Chart on Global - Market size and forecast 2024-2029 ($ million)
- Data Table on Global - Market size and forecast 2024-2029 ($ million)
- Chart on Global Market: Year-over-year growth 2024-2029 (%)
- Data Table on Global Market: Year-over-year growth 2024-2029 (%)
5 Historic Market Size
- 5.1 Global Container And Packaging Market 2019 - 2023
- Historic Market Size - Data Table on Global Container And Packaging Market 2019 - 2023 ($ million)
- 5.2 Product Type segment analysis 2019 - 2023
- Historic Market Size - Product Type Segment 2019 - 2023 ($ million)
- 5.3 End-user segment analysis 2019 - 2023
- Historic Market Size - End-user Segment 2019 - 2023 ($ million)
- 5.4 Type of Packaging segment analysis 2019 - 2023
- Historic Market Size - Type of Packaging Segment 2019 - 2023 ($ million)
- 5.5 Type segment analysis 2019 - 2023
- Historic Market Size - Type Segment 2019 - 2023 ($ million)
- 5.6 Geography segment analysis 2019 - 2023
- Historic Market Size - Geography Segment 2019 - 2023 ($ million)
- 5.7 Country segment analysis 2019 - 2023
- Historic Market Size - Country Segment 2019 - 2023 ($ million)
6 Qualitative Analysis
- 6.1 Impact of AI on the global container and packaging market
7 Five Forces Analysis
- 7.1 Five forces summary
- Five forces analysis - Comparison between 2024 and 2029
- 7.2 Bargaining power of buyers
- Bargaining power of buyers - Impact of key factors 2024 and 2029
- 7.3 Bargaining power of suppliers
- Bargaining power of suppliers - Impact of key factors in 2024 and 2029
- 7.4 Threat of new entrants
- Threat of new entrants - Impact of key factors in 2024 and 2029
- 7.5 Threat of substitutes
- Threat of substitutes - Impact of key factors in 2024 and 2029
- 7.6 Threat of rivalry
- Threat of rivalry - Impact of key factors in 2024 and 2029
- 7.7 Market condition
- Chart on Market condition - Five forces 2024 and 2029
8 Market Segmentation by Product Type
- 8.1 Market segments
- Chart on Product Type - Market share (2024-2029) (%)
- Data Table on Product Type - Market share (2024-2029) (%)
- 8.2 Comparison by Product Type
- Chart on Comparison by Product Type
- Data Table on Comparison by Product Type
- 8.3 Paperboard - Market size and forecast (2024-2029)
- Chart on Paperboard - Market size and forecast (2024-2029) ($ million)
- Data Table on Paperboard - Market size and forecast (2024-2029) ($ million)
- Chart on Paperboard - Year-over-year growth (2024-2029) (%)
- Data Table on Paperboard - Year-over-year growth (2024-2029) (%)
- 8.4 Rigid plastic - Market size and forecast (2024-2029)
- Chart on Rigid plastic - Market size and forecast (2024-2029) ($ million)
- Data Table on Rigid plastic - Market size and forecast (2024-2029) ($ million)
- Chart on Rigid plastic - Year-over-year growth (2024-2029) (%)
- Data Table on Rigid plastic - Year-over-year growth (2024-2029) (%)
- 8.5 Metal - Market size and forecast (2024-2029)
- Chart on Metal - Market size and forecast (2024-2029) ($ million)
- Data Table on Metal - Market size and forecast (2024-2029) ($ million)
- Chart on Metal - Year-over-year growth (2024-2029) (%)
- Data Table on Metal - Year-over-year growth (2024-2029) (%)
- 8.6 Glass - Market size and forecast (2024-2029)
- Chart on Glass - Market size and forecast (2024-2029) ($ million)
- Data Table on Glass - Market size and forecast (2024-2029) ($ million)
- Chart on Glass - Year-over-year growth (2024-2029) (%)
- Data Table on Glass - Year-over-year growth (2024-2029) (%)
- 8.7 Others - Market size and forecast (2024-2029)
- Chart on Others - Market size and forecast (2024-2029) ($ million)
- Data Table on Others - Market size and forecast (2024-2029) ($ million)
- Chart on Others - Year-over-year growth (2024-2029) (%)
- Data Table on Others - Year-over-year growth (2024-2029) (%)
- 8.8 Market opportunity by Product Type
- Market opportunity by Product Type ($ million)
- Data Table on Market opportunity by Product Type ($ million)
9 Market Segmentation by End-user
- 9.1 Market segments
- Chart on End-user - Market share (2024-2029) (%)
- Data Table on End-user - Market share (2024-2029) (%)
- 9.2 Comparison by End-user
- Chart on Comparison by End-user
- Data Table on Comparison by End-user
- 9.3 Food and beverage - Market size and forecast (2024-2029)
- Chart on Food and beverage - Market size and forecast (2024-2029) ($ million)
- Data Table on Food and beverage - Market size and forecast (2024-2029) ($ million)
- Chart on Food and beverage - Year-over-year growth (2024-2029) (%)
- Data Table on Food and beverage - Year-over-year growth (2024-2029) (%)
- 9.4 Healthcare - Market size and forecast (2024-2029)
- Chart on Healthcare - Market size and forecast (2024-2029) ($ million)
- Data Table on Healthcare - Market size and forecast (2024-2029) ($ million)
- Chart on Healthcare - Year-over-year growth (2024-2029) (%)
- Data Table on Healthcare - Year-over-year growth (2024-2029) (%)
- 9.5 Industrial - Market size and forecast (2024-2029)
- Chart on Industrial - Market size and forecast (2024-2029) ($ million)
- Data Table on Industrial - Market size and forecast (2024-2029) ($ million)
- Chart on Industrial - Year-over-year growth (2024-2029) (%)
- Data Table on Industrial - Year-over-year growth (2024-2029) (%)
- 9.6 Personal care - Market size and forecast (2024-2029)
- Chart on Personal care - Market size and forecast (2024-2029) ($ million)
- Data Table on Personal care - Market size and forecast (2024-2029) ($ million)
- Chart on Personal care - Year-over-year growth (2024-2029) (%)
- Data Table on Personal care - Year-over-year growth (2024-2029) (%)
- 9.7 Others - Market size and forecast (2024-2029)
- Chart on Others - Market size and forecast (2024-2029) ($ million)
- Data Table on Others - Market size and forecast (2024-2029) ($ million)
- Chart on Others - Year-over-year growth (2024-2029) (%)
- Data Table on Others - Year-over-year growth (2024-2029) (%)
- 9.8 Market opportunity by End-user
- Market opportunity by End-user ($ million)
- Data Table on Market opportunity by End-user ($ million)
10 Market Segmentation by Type
- 10.1 Market segments
- Chart on Type - Market share (2024-2029) (%)
- Data Table on Type - Market share (2024-2029) (%)
- 10.2 Comparison by Type
- Chart on Comparison by Type
- Data Table on Comparison by Type
- 10.3 Primary packaging - Market size and forecast (2024-2029)
- Chart on Primary packaging - Market size and forecast (2024-2029) ($ million)
- Data Table on Primary packaging - Market size and forecast (2024-2029) ($ million)
- Chart on Primary packaging - Year-over-year growth (2024-2029) (%)
- Data Table on Primary packaging - Year-over-year growth (2024-2029) (%)
- 10.4 Secondary packaging - Market size and forecast (2024-2029)
- Chart on Secondary packaging - Market size and forecast (2024-2029) ($ million)
- Data Table on Secondary packaging - Market size and forecast (2024-2029) ($ million)
- Chart on Secondary packaging - Year-over-year growth (2024-2029) (%)
- Data Table on Secondary packaging - Year-over-year growth (2024-2029) (%)
- 10.5 Tertiary packaging - Market size and forecast (2024-2029)
- Chart on Tertiary packaging - Market size and forecast (2024-2029) ($ million)
- Data Table on Tertiary packaging - Market size and forecast (2024-2029) ($ million)
- Chart on Tertiary packaging - Year-over-year growth (2024-2029) (%)
- Data Table on Tertiary packaging - Year-over-year growth (2024-2029) (%)
- 10.6 Specialty packaging - Market size and forecast (2024-2029)
- Chart on Specialty packaging - Market size and forecast (2024-2029) ($ million)
- Data Table on Specialty packaging - Market size and forecast (2024-2029) ($ million)
- Chart on Specialty packaging - Year-over-year growth (2024-2029) (%)
- Data Table on Specialty packaging - Year-over-year growth (2024-2029) (%)
- 10.7 Protective packaging - Market size and forecast (2024-2029)
- Chart on Protective packaging - Market size and forecast (2024-2029) ($ million)
- Data Table on Protective packaging - Market size and forecast (2024-2029) ($ million)
- Chart on Protective packaging - Year-over-year growth (2024-2029) (%)
- Data Table on Protective packaging - Year-over-year growth (2024-2029) (%)
- 10.8 Market opportunity by Type
- Market opportunity by Type ($ million)
- Data Table on Market opportunity by Type ($ million)
11 Market Segmentation by Type
- 11.1 Market segments
- Chart on Type - Market share 2024-2029 (%)
- Data Table on Type - Market share 2024-2029 (%)
- 11.2 Comparison by Type
- Chart on Comparison by Type
- Data Table on Comparison by Type
- 11.3 Primary packaging - Market size and forecast 2024-2029
- Chart on Primary packaging - Market size and forecast 2024-2029 ($ million)
- Data Table on Primary packaging - Market size and forecast 2024-2029 ($ million)
- Chart on Primary packaging - Year-over-year growth 2024-2029 (%)
- Data Table on Primary packaging - Year-over-year growth 2024-2029 (%)
- 11.4 Secondary packaging - Market size and forecast 2024-2029
- Chart on Secondary packaging - Market size and forecast 2024-2029 ($ million)
- Data Table on Secondary packaging - Market size and forecast 2024-2029 ($ million)
- Chart on Secondary packaging - Year-over-year growth 2024-2029 (%)
- Data Table on Secondary packaging - Year-over-year growth 2024-2029 (%)
- 11.5 Tertiary packaging - Market size and forecast 2024-2029
- Chart on Tertiary packaging - Market size and forecast 2024-2029 ($ million)
- Data Table on Tertiary packaging - Market size and forecast 2024-2029 ($ million)
- Chart on Tertiary packaging - Year-over-year growth 2024-2029 (%)
- Data Table on Tertiary packaging - Year-over-year growth 2024-2029 (%)
- 11.6 Specialty packaging - Market size and forecast 2024-2029
- Chart on Specialty packaging - Market size and forecast 2024-2029 ($ million)
- Data Table on Specialty packaging - Market size and forecast 2024-2029 ($ million)
- Chart on Specialty packaging - Year-over-year growth 2024-2029 (%)
- Data Table on Specialty packaging - Year-over-year growth 2024-2029 (%)
- 11.7 Protective packaging - Market size and forecast 2024-2029
- Chart on Protective packaging - Market size and forecast 2024-2029 ($ million)
- Data Table on Protective packaging - Market size and forecast 2024-2029 ($ million)
- Chart on Protective packaging - Year-over-year growth 2024-2029 (%)
- Data Table on Protective packaging - Year-over-year growth 2024-2029 (%)
- 11.8 Market opportunity by Type
- Market opportunity by Type ($ million)
- Data Table on Market opportunity by Type ($ million)
12 Customer Landscape
- 12.1 Customer landscape overview
- Analysis of price sensitivity, lifecycle, customer purchase basket, adoption rates, and purchase criteria
13 Geographic Landscape
- 13.1 Geographic segmentation
- Chart on Market share by geography 2024-2029 (%)
- Data Table on Market share by geography 2024-2029 (%)
- 13.2 Geographic comparison
- Chart on Geographic comparison
- Data Table on Geographic comparison
- 13.3 APAC - Market size and forecast 2024-2029
- Chart on APAC - Market size and forecast 2024-2029 ($ million)
- Data Table on APAC - Market size and forecast 2024-2029 ($ million)
- Chart on APAC - Year-over-year growth 2024-2029 (%)
- Data Table on APAC - Year-over-year growth 2024-2029 (%)
- 13.4 North America - Market size and forecast 2024-2029
- Chart on North America - Market size and forecast 2024-2029 ($ million)
- Data Table on North America - Market size and forecast 2024-2029 ($ million)
- Chart on North America - Year-over-year growth 2024-2029 (%)
- Data Table on North America - Year-over-year growth 2024-2029 (%)
- 13.5 Europe - Market size and forecast 2024-2029
- Chart on Europe - Market size and forecast 2024-2029 ($ million)
- Data Table on Europe - Market size and forecast 2024-2029 ($ million)
- Chart on Europe - Year-over-year growth 2024-2029 (%)
- Data Table on Europe - Year-over-year growth 2024-2029 (%)
- 13.6 Middle East and Africa - Market size and forecast 2024-2029
- Chart on Middle East and Africa - Market size and forecast 2024-2029 ($ million)
- Data Table on Middle East and Africa - Market size and forecast 2024-2029 ($ million)
- Chart on Middle East and Africa - Year-over-year growth 2024-2029 (%)
- Data Table on Middle East and Africa - Year-over-year growth 2024-2029 (%)
- 13.7 South America - Market size and forecast 2024-2029
- Chart on South America - Market size and forecast 2024-2029 ($ million)
- Data Table on South America - Market size and forecast 2024-2029 ($ million)
- Chart on South America - Year-over-year growth 2024-2029 (%)
- Data Table on South America - Year-over-year growth 2024-2029 (%)
- 13.8 US - Market size and forecast 2024-2029
- Chart on US - Market size and forecast 2024-2029 ($ million)
- Data Table on US - Market size and forecast 2024-2029 ($ million)
- Chart on US - Year-over-year growth 2024-2029 (%)
- Data Table on US - Year-over-year growth 2024-2029 (%)
- 13.9 China - Market size and forecast 2024-2029
- Chart on China - Market size and forecast 2024-2029 ($ million)
- Data Table on China - Market size and forecast 2024-2029 ($ million)
- Chart on China - Year-over-year growth 2024-2029 (%)
- Data Table on China - Year-over-year growth 2024-2029 (%)
- 13.10 Japan - Market size and forecast 2024-2029
- Chart on Japan - Market size and forecast 2024-2029 ($ million)
- Data Table on Japan - Market size and forecast 2024-2029 ($ million)
- Chart on Japan - Year-over-year growth 2024-2029 (%)
- Data Table on Japan - Year-over-year growth 2024-2029 (%)
- 13.11 India - Market size and forecast 2024-2029
- Chart on India - Market size and forecast 2024-2029 ($ million)
- Data Table on India - Market size and forecast 2024-2029 ($ million)
- Chart on India - Year-over-year growth 2024-2029 (%)
- Data Table on India - Year-over-year growth 2024-2029 (%)
- 13.12 Germany - Market size and forecast 2024-2029
- Chart on Germany - Market size and forecast 2024-2029 ($ million)
- Data Table on Germany - Market size and forecast 2024-2029 ($ million)
- Chart on Germany - Year-over-year growth 2024-2029 (%)
- Data Table on Germany - Year-over-year growth 2024-2029 (%)
- 13.13 Canada - Market size and forecast 2024-2029
- Chart on Canada - Market size and forecast 2024-2029 ($ million)
- Data Table on Canada - Market size and forecast 2024-2029 ($ million)
- Chart on Canada - Year-over-year growth 2024-2029 (%)
- Data Table on Canada - Year-over-year growth 2024-2029 (%)
- 13.14 France - Market size and forecast 2024-2029
- Chart on France - Market size and forecast 2024-2029 ($ million)
- Data Table on France - Market size and forecast 2024-2029 ($ million)
- Chart on France - Year-over-year growth 2024-2029 (%)
- Data Table on France - Year-over-year growth 2024-2029 (%)
- 13.15 South Korea - Market size and forecast 2024-2029
- Chart on South Korea - Market size and forecast 2024-2029 ($ million)
- Data Table on South Korea - Market size and forecast 2024-2029 ($ million)
- Chart on South Korea - Year-over-year growth 2024-2029 (%)
- Data Table on South Korea - Year-over-year growth 2024-2029 (%)
- 13.16 Brazil - Market size and forecast 2024-2029
- Chart on Brazil - Market size and forecast 2024-2029 ($ million)
- Data Table on Brazil - Market size and forecast 2024-2029 ($ million)
- Chart on Brazil - Year-over-year growth 2024-2029 (%)
- Data Table on Brazil - Year-over-year growth 2024-2029 (%)
- 13.17 UK - Market size and forecast 2024-2029
- Chart on UK - Market size and forecast 2024-2029 ($ million)
- Data Table on UK - Market size and forecast 2024-2029 ($ million)
- Chart on UK - Year-over-year growth 2024-2029 (%)
- Data Table on UK - Year-over-year growth 2024-2029 (%)
- 13.18 Market opportunity by geography
- Market opportunity by geography ($ million)
- Data Tables on Market opportunity by geography ($ million)
- 13.19 UAE - Market size and forecast (2024-2029)
- Chart on UAE - Market size and forecast (2024-2029) ($ million)
- Data Table on UAE - Market size and forecast (2024-2029) ($ million)
- Chart on UAE - Year-over-year growth (2024-2029) (%)
- Data Table on UAE - Year-over-year growth (2024-2029) (%)
- 13.20 Rest of World (ROW) - Market size and forecast (2024-2029)
- Chart on Rest of World (ROW) - Market size and forecast (2024-2029) ($ million)
- Data Table on Rest of World (ROW) - Market size and forecast (2024-2029) ($ million)
- Chart on Rest of World (ROW) - Year-over-year growth (2024-2029) (%)
- Data Table on Rest of World (ROW) - Year-over-year growth (2024-2029) (%)
14 Drivers, Challenges, and Opportunity/Restraints
- 14.3 Impact of drivers and challenges
- Impact of drivers and challenges in 2024 and 2029
- 14.4 Market opportunities/restraints
15 Competitive Landscape
- 15.2 Competitive Landscape
- Overview on criticality of inputs and factors of differentiation
- 15.3 Landscape disruption
- Overview on factors of disruption
- 15.4 Industry risks
- Impact of key risks on business
16 Competitive Analysis
- 16.2 Company ranking index
- 16.3 Market positioning of companies
- Matrix on companies position and classification
- 16.4 Amcor Plc
- Amcor Plc - Overview
- Amcor Plc - Business segments
- Amcor Plc - Key news
- Amcor Plc - Key offerings
- Amcor Plc - Segment focus
- SWOT
- 16.5 Berry Global Inc.
- Berry Global Inc. - Overview
- Berry Global Inc. - Business segments
- Berry Global Inc. - Key news
- Berry Global Inc. - Key offerings
- Berry Global Inc. - Segment focus
- SWOT
- 16.6 Buscherhoff Packaging Solutions GmbH
- Buscherhoff Packaging Solutions GmbH - Overview
- Buscherhoff Packaging Solutions GmbH - Product / Service
- Buscherhoff Packaging Solutions GmbH - Key offerings
- SWOT
- 16.7 BWAY Corp.
- BWAY Corp. - Overview
- BWAY Corp. - Product / Service
- BWAY Corp. - Key offerings
- SWOT
- 16.8 Container and Packaging Supply Inc.
- Container and Packaging Supply Inc. - Overview
- Container and Packaging Supply Inc. - Product / Service
- Container and Packaging Supply Inc. - Key offerings
- SWOT
- 16.9 DS Smith Plc
- DS Smith Plc - Overview
- DS Smith Plc - Business segments
- DS Smith Plc - Key news
- DS Smith Plc - Key offerings
- DS Smith Plc - Segment focus
- SWOT
- 16.10 Greif Inc.
- Greif Inc. - Overview
- Greif Inc. - Business segments
- Greif Inc. - Key news
- Greif Inc. - Key offerings
- Greif Inc. - Segment focus
- SWOT
- 16.11 Hoover Circular Solutions
- Hoover Circular Solutions - Overview
- Hoover Circular Solutions - Product / Service
- Hoover Circular Solutions - Key offerings
- SWOT
- 16.12 International Paper Co.
- International Paper Co. - Overview
- International Paper Co. - Business segments
- International Paper Co. - Key news
- International Paper Co. - Key offerings
- International Paper Co. - Segment focus
- SWOT
- 16.13 Mondi Plc
- Mondi Plc - Overview
- Mondi Plc - Business segments
- Mondi Plc - Key news
- Mondi Plc - Key offerings
- Mondi Plc - Segment focus
- SWOT
- 16.14 Jiangsu Rongtai Glass Products Co. Ltd.
- Jiangsu Rongtai Glass Products Co. Ltd. - Overview
- Jiangsu Rongtai Glass Products Co. Ltd. - Product / Service
- Jiangsu Rongtai Glass Products Co. Ltd. - Key offerings
- SWOT
- 16.15 Sealed Air Corp.
- Sealed Air Corp. - Overview
- Sealed Air Corp. - Business segments
- Sealed Air Corp. - Key news
- Sealed Air Corp. - Key offerings
- Sealed Air Corp. - Segment focus
- SWOT
- 16.16 Teijin Ltd.
- Teijin Ltd. - Overview
- Teijin Ltd. - Business segments
- Teijin Ltd. - Key news
- Teijin Ltd. - Key offerings
- Teijin Ltd. - Segment focus
- SWOT
- 16.17 WestRock Co.
- WestRock Co. - Overview
- WestRock Co. - Business segments
- WestRock Co. - Key news
- WestRock Co. - Key offerings
- WestRock Co. - Segment focus
- SWOT
- 16.18 Winpak Ltd.
- Winpak Ltd. - Overview
- Winpak Ltd. - Business segments
- Winpak Ltd. - Key offerings
- Winpak Ltd. - Segment focus
- SWOT
17 Appendix
- 17.2 Inclusions and exclusions checklist
- Inclusions checklist
- Exclusions checklist
- 17.3 Currency conversion rates for US$
- Currency conversion rates for US$
- 17.4 Research methodology
- 17.7 Validation techniques employed for market sizing
- Validation techniques employed for market sizing
- 17.9 360 degree market analysis
- 360 degree market analysis
- 17.10 List of abbreviations