Container Fleet Market Analysis, Size, and Forecast 2024-2028: North America (US), Europe (Germany), Middle East and Africa (UAE), APAC (China), South America (Brazil), and Rest of World (ROW)

Container Fleet Market Analysis, Size, and Forecast 2024-2028:
North America (US), Europe (Germany), Middle East and Africa (UAE), APAC (China), South America (Brazil), and Rest of World (ROW)

Published: Aug 2024 176 Pages SKU: IRTNTR43617

Market Overview at a Glance

$7.97 B
Market Opportunity
6.23%
CAGR
5.42
YoY growth 2023-2024(%)

Container Fleet Market Size 2024-2028

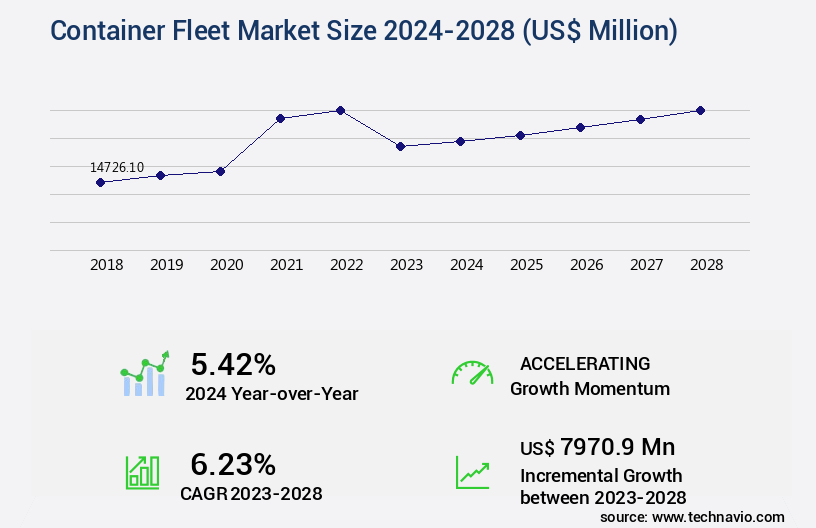
The container fleet market size is valued to increase by USD 7.97 billion, at a CAGR of 6.23% from 2023 to 2028. Growing intermodal freight transportation will drive the container fleet market.

Major Market Trends & Insights

  • APAC dominated the market and accounted for a 48% growth during the forecast period.
  • By End-user - Automotive segment was valued at USD 5.35 billion in 2022
  • By Type - Dry containers segment accounted for the largest market revenue share in 2022

Market Size & Forecast

  • Market Opportunities: USD 107.58 million
  • Market Future Opportunities: USD 7970.90 million
  • CAGR from 2023 to 2028 : 6.23%

Market Summary

  • The market is a critical component of the global intermodal freight transportation sector, facilitating the seamless movement of goods across various modes of transport. companies in this market are continually seeking strategic initiatives to enhance their offerings and boost profitability. One significant trend influencing the market is the increasing adoption of advanced technologies, such as telematics and the Internet of Things (IoT), to optimize fleet utilization and improve operational efficiency. For instance, a leading logistics company implemented a real-time container tracking system, enabling them to monitor the location and condition of their fleet in real-time.
  • This innovation led to a 15% reduction in container detention fees and a 12% improvement in on-time delivery, resulting in substantial cost savings and enhanced customer satisfaction. However, the market faces challenges, including the declining freight rates due to intense competition and overcapacity. To mitigate this issue, players in the market are exploring collaborative strategies, such as container pooling and intermodal transportation networks, to optimize their fleet utilization and reduce operational costs. In conclusion, the market is a dynamic and evolving landscape, shaped by technological advancements, strategic initiatives, and market challenges. Companies that can effectively navigate these trends and adapt to the changing market conditions will be well-positioned to succeed in this competitive industry.

What will be the Size of the Container Fleet Market during the forecast period?

Container Fleet Market Size

Get Key Insights on Market Forecast (PDF) Request Free Sample

How is the Container Fleet Market Segmented ?

The container fleet industry research report provides comprehensive data (region-wise segment analysis), with forecasts and estimates in "USD million" for the period 2024-2028, as well as historical data from 2018-2022 for the following segments.

  • End-user
    • Automotive
    • Mining and minerals
    • Oil and gas
    • Others
  • Type
    • Dry containers
    • Reefer containers
    • Tank containers
  • End-User
    • Logistics Companies
    • Retail
    • Manufacturing
  • Size
    • 20-Foot
    • 40-Foot
    • High-Cube
  • Geography
    • North America
      • US
    • Europe
      • Germany
    • Middle East and Africa
      • UAE
    • APAC
      • China
    • South America
      • Brazil
    • Rest of World (ROW)

By End-user Insights

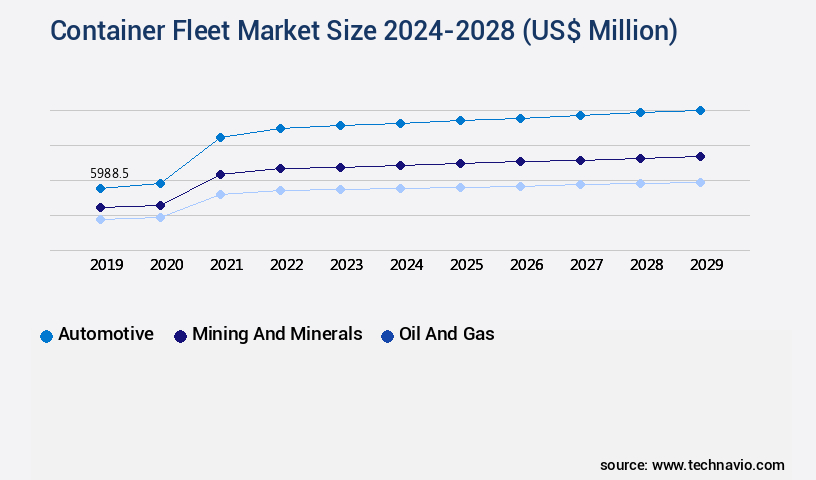
The automotive segment is estimated to witness significant growth during the forecast period.

The market continues to evolve, driven by advancements in technology and the growing need for efficient and secure logistics solutions. Container security systems, terminal operations automation, and predictive maintenance systems are increasingly adopted to enhance container fleet management. Real-time location tracking through GPS tracking devices and data analytics dashboards enable freight optimization algorithms, improving port operations efficiency. Logistic network design, empty container repositioning, and customs compliance solutions are also crucial elements in container fleet management. The integration of intelligent transportation systems, cargo visibility platforms, and multimodal transport optimization further enhances supply chain visibility. Container handling equipment, fleet management software, and asset tracking technology are essential components that contribute to maritime transport efficiency.

One significant improvement is the reduction of freight costs by up to 15% through container loading optimization and inventory management solutions. Container scheduling algorithms, shipping route planning, and container yard management are also vital for streamlining operations and minimizing container damage. Overall, the market offers numerous advantages, including cost-effectiveness, improved delivery schedules, and increased cargo security.

Container Fleet Market Size

Request Free Sample

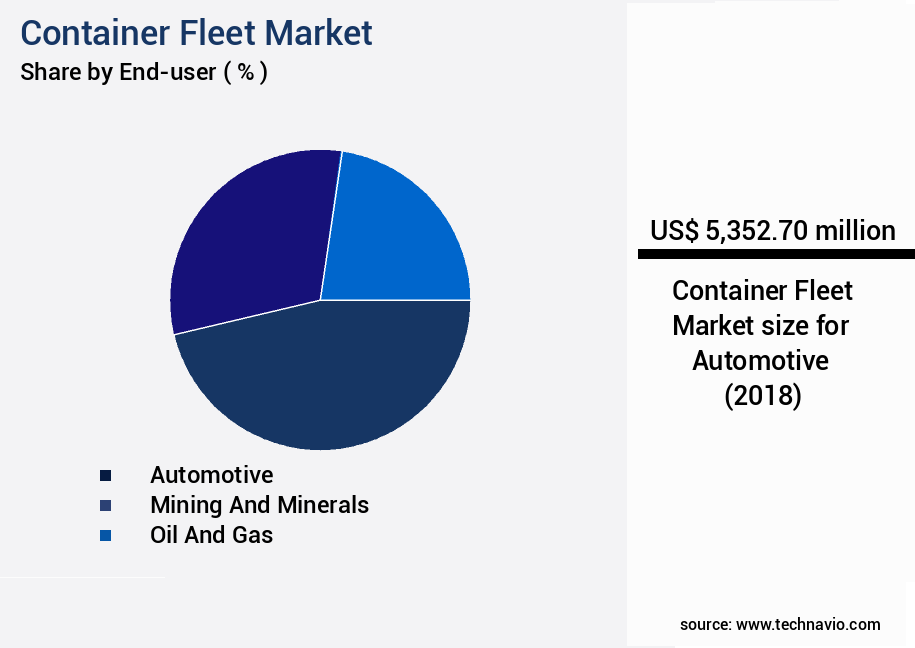
The Automotive segment was valued at USD 5.35 billion in 2018 and showed a gradual increase during the forecast period.

Container Fleet Market Size

Request Free Sample

Regional Analysis

APAC is estimated to contribute 48% to the growth of the global market during the forecast period.Technavio's analysts have elaborately explained the regional trends and drivers that shape the market during the forecast period.

Container Fleet Market Share by Geography

See How Container Fleet Market Demand is Rising in APAC Request Free Sample

The market is undergoing significant transformations, driven by the evolving needs of key applications in various industries. In particular, the Asia Pacific region has been at the forefront of these developments, introducing innovative technologies to enhance operational efficiency and reduce costs. For instance, the replacement of aging yield capacity has gained traction, while research activities have been intensified to improve productivity. Furthermore, the concentration of ship capacity and the initiation of new projects for low carbon dioxide emissions are essential aspects of this market's evolution. China and India, as the world's leading horticulture producers, account for over 77% of global fresh vegetables and fruits.

China alone produces more than half of all fresh vegetables and nearly 30% of global fruit production. Additionally, these countries are significant contributors to the global tea industry, with China producing over 40% of the world's tea and India accounting for approximately 27%. In December 2021, India produced over 29.23 million pounds of tea and exported over 442 million pounds, underscoring the importance of these countries in The market.

Market Dynamics

Our researchers analyzed the data with 2023 as the base year, along with the key drivers, trends, and challenges. A holistic analysis of drivers will help companies refine their marketing strategies to gain a competitive advantage.

The market is experiencing significant transformation as businesses seek to enhance their logistics operations and improve efficiency in the face of increasing global trade. One key area of focus is the implementation of advanced technologies to optimize container yard operations and reduce fuel consumption in container transport. GPS tracking for container fleets enables real-time location updates, allowing for better management of container flows and minimizing the risk of misplaced containers. Predictive maintenance for container handling equipment ensures optimal performance and reduces downtime, while advanced container tracking system solutions offer greater supply chain visibility. Sustainable logistics practices are also gaining importance in the market. Implementing technology to monitor cargo security using various technologies and optimizing container loading for efficient transport are crucial steps towards reducing operational costs and minimizing risk. Container fleet management software features, such as data analytics, enable better logistics decisions and effective management of empty container repositioning. Moreover, developing a robust supply chain network for containers is essential to ensure timely delivery and compliance with customs regulations. Automated container handling equipment integration and enhancing customs compliance with advanced technology are critical in this regard. The use of data analytics for better logistics decisions and reducing fuel consumption in container transport further contributes to the optimization of intermodal transport efficiency. Overall, the market is witnessing a shift towards technology-driven solutions to improve throughput efficiency, reduce operational costs, and minimize risk.

Container logistics market is experiencing significant transformation through the adoption of advanced technologies that enable real-time container location updates and enhanced supply chain visibility. By integrating data analytics for better logistics decisions, companies can optimize container yard operations, improve container throughput efficiency, and reduce operational costs through container fleet optimization. These technologies also facilitate more effective management of empty container repositioning, ensuring that assets are utilized efficiently across complex transport networks.

Sustainable logistics practices are increasingly being implemented, minimizing the environmental impact of shipping while maintaining operational efficiency. Innovations in monitoring cargo security using various technologies enhance risk mitigation across container fleet management, protecting high-value and sensitive shipments. Improving intermodal transport efficiency through technology further supports seamless transitions between shipping modes, reducing delays and bottlenecks while improving overall supply chain reliability.

From a comparative perspective, container throughput improvements achieved through real-time tracking and analytics-driven yard optimization show measurable gains in operational efficiency compared to traditional methods. Monitoring systems for cargo security and fleet management contribute to lower incidences of loss or damage, while effective empty container repositioning strategies reduce idle time and associated costs. Collectively, these advancements underscore a continuous evolution in the container logistics market, driven by technology-enabled efficiency, sustainability, and enhanced decision-making.

Container Fleet Market Size

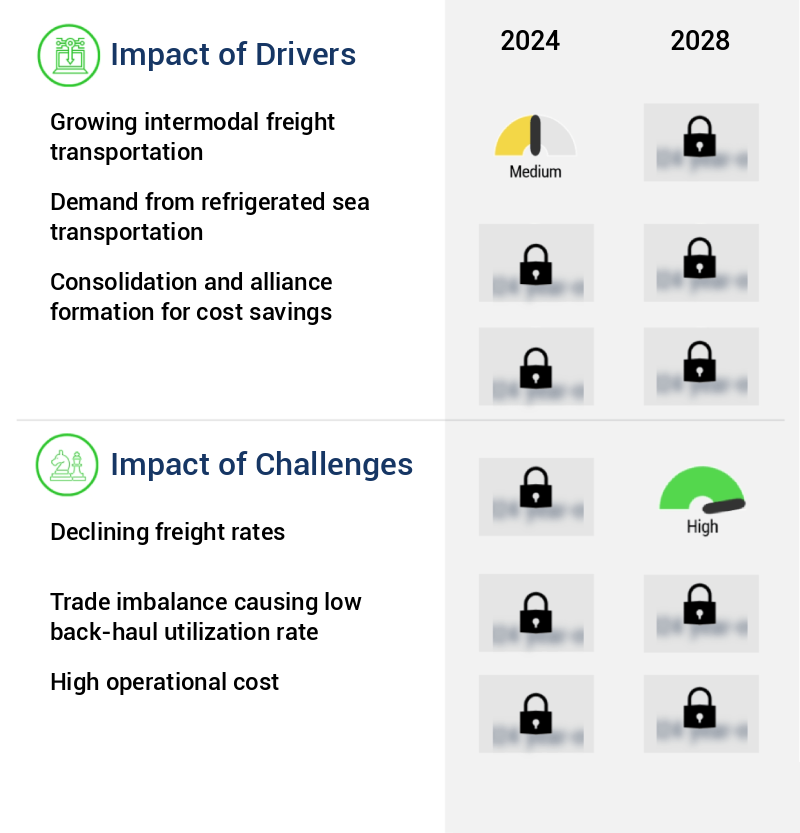
What are the key market drivers leading to the rise in the adoption of Container Fleet Industry?

  • Intermodal freight transportation's continued growth is the primary market driver. This mode of transport, which combines multiple forms such as rail, road, and sea, is increasingly preferred due to its cost-effectiveness, efficiency, and environmental sustainability. 
  • Intermodal transportation, which utilizes various modes of transport for moving goods between regions, offers significant advantages over other transportation methods. These benefits include increased efficiency, environmental sustainability, and cost savings. Intermodal transportation enables door-to-door delivery, shorter delivery times, cargo safety, and the flexibility to use multiple routes. The intermodal freight transportation sector is undergoing technological advancements, such as ICT, computerized vehicle routing, active traffic management, and online freight exchanges.
  • Industries like automotive, consumer goods, and heavy vehicles increasingly rely on intermodal transportation for their product shipments due to its efficiency and cost-effectiveness. By streamlining operations and reducing idle periods, intermodal transportation contributes to improved forecast accuracy and downtime reduction, making it an essential component of modern global supply chains.

What are the market trends shaping the Container Fleet Industry?

  • The trend in the market involves strategic moves by companies to maximize profits. Profit-making strategies are a prominent trend in the current market landscape.
  • Container fleet solutions are essential for businesses seeking to optimize their supply chains and increase operational productivity. The complexity of modern supply chains, with their increased geographical reach and interdependence between various verticals, necessitates the adoption of efficient intermodal freight transportation systems. companies providing container fleet services must adapt to evolving B2B standards and support diverse business processes within their clients' supply chains. Furthermore, companies are focusing on inventory and warehouse planning to enhance their overall efficiency. By implementing container fleet solutions, businesses can experience significant improvements, such as a 30% reduction in downtime and an 18% increase in forecast accuracy.
  • These advancements contribute to a more streamlined and productive supply chain, ultimately benefiting both the organization and its customers.

What challenges does the Container Fleet Industry face during its growth?

  • The freight rate decline poses a significant challenge to the industry's growth trajectory. 
  • The market is experiencing an evolving landscape shaped by oversupply and low bunker prices. With a surplus of vessels, the industry grapples with demand fluctuations, resulting in pricing pressures. In 2021, approximately 704 container vessels were scrapped, a testament to the excess supply. Despite the challenges, the container fleet industry continues to play a crucial role in global trade, offering solutions for transporting goods efficiently and enhancing regulatory compliance.

Exclusive Technavio Analysis on Customer Landscape

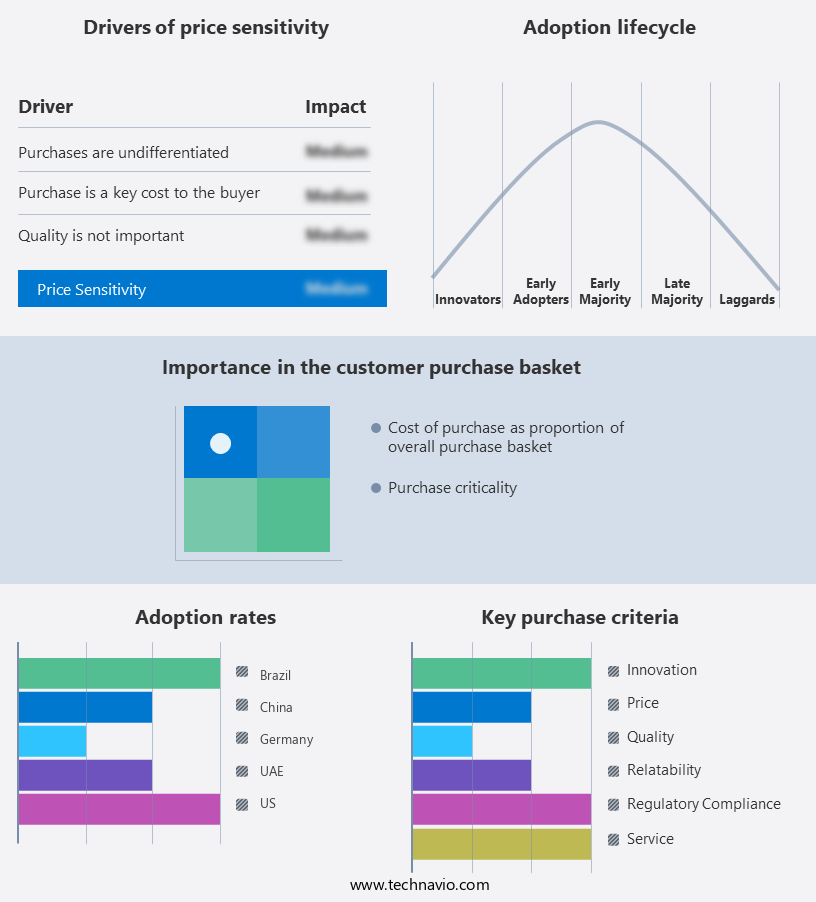
The container fleet market forecasting report includes the adoption lifecycle of the market, covering from the innovator's stage to the laggard's stage. It focuses on adoption rates in different regions based on penetration. Furthermore, the container fleet market report also includes key purchase criteria and drivers of price sensitivity to help companies evaluate and develop their market growth analysis strategies.

Container Fleet Market Share by Geography

 Customer Landscape of Container Fleet Industry

Competitive Landscape

Companies are implementing various strategies, such as strategic alliances, container fleet market forecast, partnerships, mergers and acquisitions, geographical expansion, and product/service launches, to enhance their presence in the industry.

Maersk - The company specializes in diverse container fleet services, including Less than Container Load (LCL) and Maersk ECO Delivery, ensuring efficient and effective logistics solutions for global businesses. These offerings cater to various cargo requirements, enhancing supply chain agility and reducing transportation costs.

The industry research and growth report includes detailed analyses of the competitive landscape of the market and information about key companies, including:

  • Maersk
  • MSC
  • Mediterranean Shipping
  • CMA CGM
  • COSCO Shipping
  • Hapag-Lloyd
  • Evergreen Marine
  • Yang Ming
  • ZIM Integrated Shipping
  • Hyundai Merchant Marine
  • Textainer
  • CAI International
  • Seaco Global
  • Triton International
  • Florens Container
  • Beacon Intermodal
  • Seacube Container
  • CARU Containers
  • Blue Sky Intermodal
  • Touax

Qualitative and quantitative analysis of companies has been conducted to help clients understand the wider business environment as well as the strengths and weaknesses of key industry players. Data is qualitatively analyzed to categorize companies as pure play, category-focused, industry-focused, and diversified; it is quantitatively analyzed to categorize companies as dominant, leading, strong, tentative, and weak.

Recent Development and News in Container Fleet Market

  • In August 2024, Maersk Line, the world's largest container shipping company, announced the launch of its new Maersk Essentials product, offering customers a simplified and cost-effective container shipping solution (Maersk press release, 2024). This new service aimed to cater to small and medium-sized businesses, marking a strategic shift in the company's focus on serving a broader customer base.
  • In November 2024, CMA CGM Group, the third-largest container shipping company, and IBM signed a multi-year strategic collaboration agreement to digitize and optimize CMA CGM's global container fleet operations using IBM's AI, IoT, and blockchain technologies (IBM press release, 2024). This partnership was expected to enhance operational efficiency and improve supply chain transparency for CMA CGM's customers.
  • In March 2025, Hapag-Lloyd AG, the fifth-largest container shipping company, completed its acquisition of K-Line's container shipping business, expanding its fleet capacity by 1.3 million TEUs (Hapag-Lloyd press release, 2025). This strategic move strengthened Hapag-Lloyd's position in the competitive container shipping market.
  • In May 2025, the European Union approved the European Green Deal's Horizon Europe research and innovation program, which includes a €1 billion investment in green technologies for the maritime sector, including container fleets (European Commission press release, 2025). This significant funding allocation is expected to drive technological advancements and innovation in the market, focusing on reducing emissions and improving sustainability.

Dive into Technavio's robust research methodology, blending expert interviews, extensive data synthesis, and validated models for unparalleled Container Fleet Market insights. See full methodology.

Market Scope

Report Coverage

Details

Page number

176

Base year

2023

Historic period

2018-2022

Forecast period

2024-2028

Growth momentum & CAGR

Accelerate at a CAGR of 6.23%

Market growth 2024-2028

USD 7970.9 million

Market structure

Fragmented

YoY growth 2023-2024(%)

5.42

Key countries

China, Germany, US, UAE, and Brazil

Competitive landscape

Leading Companies, Market Positioning of Companies, Competitive Strategies, and Industry Risks

Request Free Sample

Research Analyst Overview

  • The market continues to evolve, driven by the ever-changing demands of global trade and the need for increased efficiency and security. Drayage operations management plays a crucial role in optimizing the movement of containers between ports and inland destinations, reducing freight costs and improving port operations efficiency. Container security systems, employing advanced technologies such as predictive maintenance systems and real-time location tracking, are essential for safeguarding valuable cargo. Terminal operations automation, including container handling equipment and fleet management software, streamlines processes and enhances productivity. Data analytics dashboards provide valuable insights into container throughput metrics and shipping route planning, enabling better inventory management solutions and logistic network design.
  • Predictive maintenance systems and cargo visibility platforms facilitate proactive maintenance and freight optimization algorithms, ensuring the continuous availability of container assets and reducing downtime. Intermodal transportation management and multimodal transport optimization further enhance supply chain visibility and efficiency. An example of the market's dynamic nature can be seen in the implementation of intelligent transportation systems and container tracking systems, which have led to a 15% reduction in container handling time at major ports. The market is expected to grow at a robust rate, with industry experts projecting a 10% annual increase in container fleet size over the next decade.

What are the Key Data Covered in this Container Fleet Market Research and Growth Report?

  • What is the expected growth of the Container Fleet Market between 2024 and 2028?

    • USD 7.97 billion, at a CAGR of 6.23%

  • What segmentation does the market report cover?

    • The report is segmented by End-user (Automotive, Mining and minerals, Oil and gas, and Others), Type (Dry containers, Reefer containers, and Tank containers), Geography (APAC, Europe, North America, Middle East and Africa, and South America), End-User (Logistics Companies, Retail, and Manufacturing), and Size (20-Foot, 40-Foot, and High-Cube)

  • Which regions are analyzed in the report?

    • APAC, Europe, North America, Middle East and Africa, and South America

  • What are the key growth drivers and market challenges?

    • Growing intermodal freight transportation, Declining freight rates

  • Who are the major players in the Container Fleet Market?

    • Maersk, MSC, Mediterranean Shipping, CMA CGM, COSCO Shipping, Hapag-Lloyd, Evergreen Marine, Yang Ming, ZIM Integrated Shipping, Hyundai Merchant Marine, Textainer, CAI International, Seaco Global, Triton International, Florens Container, Beacon Intermodal, Seacube Container, CARU Containers, Blue Sky Intermodal, and Touax

Market Research Insights

  • The market is a dynamic and ever-evolving industry, characterized by continuous growth and innovation. Two notable statistics illustrate this trend. First, container utilization rates have seen a steady increase, with an estimated 90% of the global container fleet being in active use at any given time. Second, the industry anticipates a growth rate of approximately 3% annually over the next decade, driven by factors such as increasing global trade and the adoption of sustainable logistics practices. An example of market dynamics at play can be seen in the implementation of advanced technologies for container stacking optimization.
  • By optimizing container stacking, terminals can reduce operational costs and increase efficiency, resulting in a significant sales increase for technology providers. This trend is expected to continue as the industry seeks to minimize labor costs and improve cargo handling efficiency. Moreover, the industry is committed to reducing its carbon footprint, with a focus on fleet maintenance schedules, fuel consumption monitoring, and the integration of renewable energy sources. The adoption of data-driven decision making and predictive analytics models is also on the rise, enabling companies to optimize delivery times, manage risk, and enhance supply chain resilience.
  • These efforts are crucial in addressing the challenges of port congestion management, intermodal terminal design, and environmental impact assessment.

We can help! Our analysts can customize this container fleet market research report to meet your requirements.

Get in touch

1 Executive Summary

  • 1.1 Market overview
    • Executive Summary - Chart on Market Overview
    • Executive Summary - Data Table on Market Overview
    • Executive Summary - Chart on Global Market Characteristics
    • Executive Summary - Chart on Market by Geography
    • Executive Summary - Chart on Market Segmentation by End-user
    • Executive Summary - Chart on Market Segmentation by Type
    • Executive Summary - Chart on Incremental Growth
    • Executive Summary - Data Table on Incremental Growth
    • Executive Summary - Chart on Company Market Positioning

2 Market Landscape

  • 2.1 Market ecosystem
    • Parent Market
    • Data Table on - Parent Market
  • 2.2 Market characteristics
    • Market characteristics analysis
  • 2.3 Value chain analysis
    • Value Chain Analysis

3 Market Sizing

  • 3.1 Market definition
    • Offerings of companies included in the market definition
  • 3.2 Market segment analysis
    • Market segments
  • 3.3 Market size 2023
    • 3.4 Market outlook: Forecast for 2023-2028
      • Chart on Global - Market size and forecast 2023-2028 ($ million)
      • Data Table on Global - Market size and forecast 2023-2028 ($ million)
      • Chart on Global Market: Year-over-year growth 2023-2028 (%)
      • Data Table on Global Market: Year-over-year growth 2023-2028 (%)

    4 Historic Market Size

    • 4.1 Global Container Fleet Market 2018 - 2022
      • Historic Market Size - Data Table on Global Container Fleet Market 2018 - 2022 ($ million)
    • 4.2 End-user segment analysis 2018 - 2022
      • Historic Market Size - End-user Segment 2018 - 2022 ($ million)
    • 4.3 Type segment analysis 2018 - 2022
      • Historic Market Size - Type Segment 2018 - 2022 ($ million)
    • 4.4 Geography segment analysis 2018 - 2022
      • Historic Market Size - Geography Segment 2018 - 2022 ($ million)
    • 4.5 Country segment analysis 2018 - 2022
      • Historic Market Size - Country Segment 2018 - 2022 ($ million)

    5 Five Forces Analysis

    • 5.1 Five forces summary
      • Five forces analysis - Comparison between 2023 and 2028
    • 5.2 Bargaining power of buyers
      • Bargaining power of buyers - Impact of key factors 2023 and 2028
    • 5.3 Bargaining power of suppliers
      • Bargaining power of suppliers - Impact of key factors in 2023 and 2028
    • 5.4 Threat of new entrants
      • Threat of new entrants - Impact of key factors in 2023 and 2028
    • 5.5 Threat of substitutes
      • Threat of substitutes - Impact of key factors in 2023 and 2028
    • 5.6 Threat of rivalry
      • Threat of rivalry - Impact of key factors in 2023 and 2028
    • 5.7 Market condition
      • Chart on Market condition - Five forces 2023 and 2028

    6 Market Segmentation by End-user

    • 6.1 Market segments
      • Chart on End-user - Market share (2023-2028) (%)
      • Data Table on End-user - Market share (2023-2028) (%)
    • 6.2 Comparison by End-user
      • Chart on Comparison by End-user
      • Data Table on Comparison by End-user
    • 6.3 Automotive - Market size and forecast (2023-2028)
      • Chart on Automotive - Market size and forecast (2023-2028) ($ million)
      • Data Table on Automotive - Market size and forecast (2023-2028) ($ million)
      • Chart on Automotive - Year-over-year growth (2023-2028) (%)
      • Data Table on Automotive - Year-over-year growth (2023-2028) (%)
    • 6.4 Mining and minerals - Market size and forecast (2023-2028)
      • Chart on Mining and minerals - Market size and forecast (2023-2028) ($ million)
      • Data Table on Mining and minerals - Market size and forecast (2023-2028) ($ million)
      • Chart on Mining and minerals - Year-over-year growth (2023-2028) (%)
      • Data Table on Mining and minerals - Year-over-year growth (2023-2028) (%)
    • 6.5 Oil and gas - Market size and forecast (2023-2028)
      • Chart on Oil and gas - Market size and forecast (2023-2028) ($ million)
      • Data Table on Oil and gas - Market size and forecast (2023-2028) ($ million)
      • Chart on Oil and gas - Year-over-year growth (2023-2028) (%)
      • Data Table on Oil and gas - Year-over-year growth (2023-2028) (%)
    • 6.6 Others - Market size and forecast (2023-2028)
      • Chart on Others - Market size and forecast (2023-2028) ($ million)
      • Data Table on Others - Market size and forecast (2023-2028) ($ million)
      • Chart on Others - Year-over-year growth (2023-2028) (%)
      • Data Table on Others - Year-over-year growth (2023-2028) (%)
    • 6.7 Market opportunity by End-user
      • Market opportunity by End-user ($ million)
      • Data Table on Market opportunity by End-user ($ million)

    7 Market Segmentation by Type

    • 7.1 Market segments
      • Chart on Type - Market share (2023-2028) (%)
      • Data Table on Type - Market share (2023-2028) (%)
    • 7.2 Comparison by Type
      • Chart on Comparison by Type
      • Data Table on Comparison by Type
    • 7.3 Dry containers - Market size and forecast (2023-2028)
      • Chart on Dry containers - Market size and forecast (2023-2028) ($ million)
      • Data Table on Dry containers - Market size and forecast (2023-2028) ($ million)
      • Chart on Dry containers - Year-over-year growth (2023-2028) (%)
      • Data Table on Dry containers - Year-over-year growth (2023-2028) (%)
    • 7.4 Reefer containers - Market size and forecast (2023-2028)
      • Chart on Reefer containers - Market size and forecast (2023-2028) ($ million)
      • Data Table on Reefer containers - Market size and forecast (2023-2028) ($ million)
      • Chart on Reefer containers - Year-over-year growth (2023-2028) (%)
      • Data Table on Reefer containers - Year-over-year growth (2023-2028) (%)
    • 7.5 Tank containers - Market size and forecast (2023-2028)
      • Chart on Tank containers - Market size and forecast (2023-2028) ($ million)
      • Data Table on Tank containers - Market size and forecast (2023-2028) ($ million)
      • Chart on Tank containers - Year-over-year growth (2023-2028) (%)
      • Data Table on Tank containers - Year-over-year growth (2023-2028) (%)
    • 7.6 Market opportunity by Type
      • Market opportunity by Type ($ million)
      • Data Table on Market opportunity by Type ($ million)

    8 Market Segmentation by End-User

    • 8.1 Market segments
      • Chart on End-User - Market share (2023-2028) (%)
      • Data Table on End-User - Market share (2023-2028) (%)
    • 8.2 Comparison by End-User
      • Chart on Comparison by End-User
      • Data Table on Comparison by End-User
    • 8.3 Logistics Companies - Market size and forecast (2023-2028)
      • Chart on Logistics Companies - Market size and forecast (2023-2028) ($ million)
      • Data Table on Logistics Companies - Market size and forecast (2023-2028) ($ million)
      • Chart on Logistics Companies - Year-over-year growth (2023-2028) (%)
      • Data Table on Logistics Companies - Year-over-year growth (2023-2028) (%)
    • 8.4 Retail - Market size and forecast (2023-2028)
      • Chart on Retail - Market size and forecast (2023-2028) ($ million)
      • Data Table on Retail - Market size and forecast (2023-2028) ($ million)
      • Chart on Retail - Year-over-year growth (2023-2028) (%)
      • Data Table on Retail - Year-over-year growth (2023-2028) (%)
    • 8.5 Manufacturing - Market size and forecast (2023-2028)
      • Chart on Manufacturing - Market size and forecast (2023-2028) ($ million)
      • Data Table on Manufacturing - Market size and forecast (2023-2028) ($ million)
      • Chart on Manufacturing - Year-over-year growth (2023-2028) (%)
      • Data Table on Manufacturing - Year-over-year growth (2023-2028) (%)
    • 8.6 Market opportunity by End-User
      • Market opportunity by End-User ($ million)
      • Data Table on Market opportunity by End-User ($ million)

    9 Market Segmentation by Size

    • 9.1 Market segments
      • Chart on Size - Market share (2023-2028) (%)
      • Data Table on Size - Market share (2023-2028) (%)
    • 9.2 Comparison by Size
      • Chart on Comparison by Size
      • Data Table on Comparison by Size
    • 20-Foot - Market size and forecast (2023-2028)
      • Chart on 20-Foot - Market size and forecast (2023-2028) ($ million)
      • Data Table on 20-Foot - Market size and forecast (2023-2028) ($ million)
      • Chart on 20-Foot - Year-over-year growth (2023-2028) (%)
      • Data Table on 20-Foot - Year-over-year growth (2023-2028) (%)
    • 40-Foot - Market size and forecast (2023-2028)
      • Chart on 40-Foot - Market size and forecast (2023-2028) ($ million)
      • Data Table on 40-Foot - Market size and forecast (2023-2028) ($ million)
      • Chart on 40-Foot - Year-over-year growth (2023-2028) (%)
      • Data Table on 40-Foot - Year-over-year growth (2023-2028) (%)
    • 9.5 High-Cube - Market size and forecast (2023-2028)
      • Chart on High-Cube - Market size and forecast (2023-2028) ($ million)
      • Data Table on High-Cube - Market size and forecast (2023-2028) ($ million)
      • Chart on High-Cube - Year-over-year growth (2023-2028) (%)
      • Data Table on High-Cube - Year-over-year growth (2023-2028) (%)
    • 9.6 Market opportunity by Size
      • Market opportunity by Size ($ million)
      • Data Table on Market opportunity by Size ($ million)

    10 Customer Landscape

    • 10.1 Customer landscape overview
      • Analysis of price sensitivity, lifecycle, customer purchase basket, adoption rates, and purchase criteria

    11 Geographic Landscape

    • 11.1 Geographic segmentation
      • Chart on Market share by geography 2023-2028 (%)
      • Data Table on Market share by geography 2023-2028 (%)
    • 11.2 Geographic comparison
      • Chart on Geographic comparison
      • Data Table on Geographic comparison
    • 11.3 APAC - Market size and forecast 2023-2028
      • Chart on APAC - Market size and forecast 2023-2028 ($ million)
      • Data Table on APAC - Market size and forecast 2023-2028 ($ million)
      • Chart on APAC - Year-over-year growth 2023-2028 (%)
      • Data Table on APAC - Year-over-year growth 2023-2028 (%)
    • 11.4 Europe - Market size and forecast 2023-2028
      • Chart on Europe - Market size and forecast 2023-2028 ($ million)
      • Data Table on Europe - Market size and forecast 2023-2028 ($ million)
      • Chart on Europe - Year-over-year growth 2023-2028 (%)
      • Data Table on Europe - Year-over-year growth 2023-2028 (%)
    • 11.5 North America - Market size and forecast 2023-2028
      • Chart on North America - Market size and forecast 2023-2028 ($ million)
      • Data Table on North America - Market size and forecast 2023-2028 ($ million)
      • Chart on North America - Year-over-year growth 2023-2028 (%)
      • Data Table on North America - Year-over-year growth 2023-2028 (%)
    • 11.6 Middle East and Africa - Market size and forecast 2023-2028
      • Chart on Middle East and Africa - Market size and forecast 2023-2028 ($ million)
      • Data Table on Middle East and Africa - Market size and forecast 2023-2028 ($ million)
      • Chart on Middle East and Africa - Year-over-year growth 2023-2028 (%)
      • Data Table on Middle East and Africa - Year-over-year growth 2023-2028 (%)
    • 11.7 South America - Market size and forecast 2023-2028
      • Chart on South America - Market size and forecast 2023-2028 ($ million)
      • Data Table on South America - Market size and forecast 2023-2028 ($ million)
      • Chart on South America - Year-over-year growth 2023-2028 (%)
      • Data Table on South America - Year-over-year growth 2023-2028 (%)
    • 11.8 China - Market size and forecast 2023-2028
      • Chart on China - Market size and forecast 2023-2028 ($ million)
      • Data Table on China - Market size and forecast 2023-2028 ($ million)
      • Chart on China - Year-over-year growth 2023-2028 (%)
      • Data Table on China - Year-over-year growth 2023-2028 (%)
    • 11.9 Germany - Market size and forecast 2023-2028
      • Chart on Germany - Market size and forecast 2023-2028 ($ million)
      • Data Table on Germany - Market size and forecast 2023-2028 ($ million)
      • Chart on Germany - Year-over-year growth 2023-2028 (%)
      • Data Table on Germany - Year-over-year growth 2023-2028 (%)
    • 11.10 US - Market size and forecast 2023-2028
      • Chart on US - Market size and forecast 2023-2028 ($ million)
      • Data Table on US - Market size and forecast 2023-2028 ($ million)
      • Chart on US - Year-over-year growth 2023-2028 (%)
      • Data Table on US - Year-over-year growth 2023-2028 (%)
    • 11.11 UAE - Market size and forecast 2023-2028
      • Chart on UAE - Market size and forecast 2023-2028 ($ million)
      • Data Table on UAE - Market size and forecast 2023-2028 ($ million)
      • Chart on UAE - Year-over-year growth 2023-2028 (%)
      • Data Table on UAE - Year-over-year growth 2023-2028 (%)
    • 11.12 Brazil - Market size and forecast 2023-2028
      • Chart on Brazil - Market size and forecast 2023-2028 ($ million)
      • Data Table on Brazil - Market size and forecast 2023-2028 ($ million)
      • Chart on Brazil - Year-over-year growth 2023-2028 (%)
      • Data Table on Brazil - Year-over-year growth 2023-2028 (%)
    • 11.13 Market opportunity by geography
      • Market opportunity by geography ($ million)
      • Data Tables on Market opportunity by geography ($ million)
    • 11.14 Rest of World (ROW) - Market size and forecast (2023-2028)
      • Chart on Rest of World (ROW) - Market size and forecast (2023-2028) ($ million)
      • Data Table on Rest of World (ROW) - Market size and forecast (2023-2028) ($ million)
      • Chart on Rest of World (ROW) - Year-over-year growth (2023-2028) (%)
      • Data Table on Rest of World (ROW) - Year-over-year growth (2023-2028) (%)

    12 Drivers, Challenges, and Opportunity/Restraints

    • 12.1 Market drivers
      • 12.2 Market challenges
        • 12.3 Impact of drivers and challenges
          • Impact of drivers and challenges in 2023 and 2028
        • 12.4 Market opportunities/restraints

          13 Competitive Landscape

          • 13.1 Overview
            • 13.2 Competitive Landscape
              • Overview on criticality of inputs and factors of differentiation
            • 13.3 Landscape disruption
              • Overview on factors of disruption
            • 13.4 Industry risks
              • Impact of key risks on business

            14 Competitive Analysis

            • 14.1 Companies profiled
              • Companies covered
            • 14.2 Market positioning of companies
              • Matrix on companies position and classification
            • 14.3 Maersk
              • Maersk - Overview
              • Maersk - Product / Service
              • Maersk - Key offerings
            • 14.4 MSC
              • MSC - Overview
              • MSC - Product / Service
              • MSC - Key offerings
            • 14.5 Mediterranean Shipping
              • Mediterranean Shipping - Overview
              • Mediterranean Shipping - Product / Service
              • Mediterranean Shipping - Key offerings
            • 14.6 CMA CGM
              • CMA CGM - Overview
              • CMA CGM - Product / Service
              • CMA CGM - Key offerings
            • 14.7 COSCO Shipping
              • COSCO Shipping - Overview
              • COSCO Shipping - Product / Service
              • COSCO Shipping - Key offerings
            • 14.8 Hapag-Lloyd
              • Hapag-Lloyd - Overview
              • Hapag-Lloyd - Product / Service
              • Hapag-Lloyd - Key offerings
            • 14.9 Evergreen Marine
              • Evergreen Marine - Overview
              • Evergreen Marine - Product / Service
              • Evergreen Marine - Key offerings
            • 14.10 Yang Ming
              • Yang Ming - Overview
              • Yang Ming - Product / Service
              • Yang Ming - Key offerings
            • 14.11 ZIM Integrated Shipping
              • ZIM Integrated Shipping - Overview
              • ZIM Integrated Shipping - Product / Service
              • ZIM Integrated Shipping - Key offerings
            • 14.12 Hyundai Merchant Marine
              • Hyundai Merchant Marine - Overview
              • Hyundai Merchant Marine - Product / Service
              • Hyundai Merchant Marine - Key offerings
            • 14.13 Textainer
              • Textainer - Overview
              • Textainer - Product / Service
              • Textainer - Key offerings
            • 14.14 CAI International
              • CAI International - Overview
              • CAI International - Product / Service
              • CAI International - Key offerings
            • 14.15 Seaco Global
              • Seaco Global - Overview
              • Seaco Global - Product / Service
              • Seaco Global - Key offerings
            • 14.16 Triton International
              • Triton International - Overview
              • Triton International - Product / Service
              • Triton International - Key offerings
            • 14.17 Florens Container
              • Florens Container - Overview
              • Florens Container - Product / Service
              • Florens Container - Key offerings
            • 14.18 Beacon Intermodal
              • Beacon Intermodal - Overview
              • Beacon Intermodal - Product / Service
              • Beacon Intermodal - Key offerings
            • 14.19 Seacube Container
              • Seacube Container - Overview
              • Seacube Container - Product / Service
              • Seacube Container - Key offerings
            • 14.20 CARU Containers
              • CARU Containers - Overview
              • CARU Containers - Product / Service
              • CARU Containers - Key offerings
            • 14.21 Blue Sky Intermodal
              • Blue Sky Intermodal - Overview
              • Blue Sky Intermodal - Product / Service
              • Blue Sky Intermodal - Key offerings
            • 14.22 Touax
              • Touax - Overview
              • Touax - Product / Service
              • Touax - Key offerings
            • 14.23 AP Moller Maersk AS
              • AP Moller Maersk AS - Overview
              • AP Moller Maersk AS - Product / Service
              • AP Moller Maersk AS - Key offerings
            • 14.24 Arkas Container Transport SA
              • Arkas Container Transport SA - Overview
              • Arkas Container Transport SA - Product / Service
              • Arkas Container Transport SA - Key offerings
            • 14.25 CMA CGM Group
              • CMA CGM Group - Overview
              • CMA CGM Group - Product / Service
              • CMA CGM Group - Key offerings
            • 14.26 COSCO Shipping International Co. Ltd.
              • COSCO Shipping International Co. Ltd. - Overview
              • COSCO Shipping International Co. Ltd. - Product / Service
              • COSCO Shipping International Co. Ltd. - Key offerings
            • 14.27 CSI Group LLC
              • CSI Group LLC - Overview
              • CSI Group LLC - Product / Service
              • CSI Group LLC - Key offerings
            • 14.28 Evergreen Marine Corp. Taiwan Ltd.
              • Evergreen Marine Corp. Taiwan Ltd. - Overview
              • Evergreen Marine Corp. Taiwan Ltd. - Product / Service
              • Evergreen Marine Corp. Taiwan Ltd. - Key offerings
            • 14.29 Hapag Lloyd AG
              • Hapag Lloyd AG - Overview
              • Hapag Lloyd AG - Product / Service
              • Hapag Lloyd AG - Key offerings
            • 14.30 HMM Europe Ltd.
              • HMM Europe Ltd. - Overview
              • HMM Europe Ltd. - Product / Service
              • HMM Europe Ltd. - Key offerings
            • 14.31 Kawasaki Kisen Kaisha Ltd.
              • Kawasaki Kisen Kaisha Ltd. - Overview
              • Kawasaki Kisen Kaisha Ltd. - Product / Service
              • Kawasaki Kisen Kaisha Ltd. - Key offerings
            • 14.32 Mitsui O.S.K. Lines Ltd.
              • Mitsui O.S.K. Lines Ltd. - Overview
              • Mitsui O.S.K. Lines Ltd. - Product / Service
              • Mitsui O.S.K. Lines Ltd. - Key offerings
            • 14.33 MSC Mediterranean Shipping Co. SA
              • MSC Mediterranean Shipping Co. SA - Overview
              • MSC Mediterranean Shipping Co. SA - Product / Service
              • MSC Mediterranean Shipping Co. SA - Key offerings
            • 14.34 Nippon Yusen Kabushiki Kaisha
              • Nippon Yusen Kabushiki Kaisha - Overview
              • Nippon Yusen Kabushiki Kaisha - Product / Service
              • Nippon Yusen Kabushiki Kaisha - Key offerings
            • 14.35 Orient Overseas Container Line Ltd.
              • Orient Overseas Container Line Ltd. - Overview
              • Orient Overseas Container Line Ltd. - Product / Service
              • Orient Overseas Container Line Ltd. - Key offerings
            • 14.36 Pacific International Lines Pte. Ltd.
              • Pacific International Lines Pte. Ltd. - Overview
              • Pacific International Lines Pte. Ltd. - Product / Service
              • Pacific International Lines Pte. Ltd. - Key offerings
            • 14.37 Unifeeder AS
              • Unifeeder AS - Overview
              • Unifeeder AS - Product / Service
              • Unifeeder AS - Key offerings
            • 14.38 Wan Hai Lines Ltd.
              • Wan Hai Lines Ltd. - Overview
              • Wan Hai Lines Ltd. - Product / Service
              • Wan Hai Lines Ltd. - Key offerings
            • 14.39 Westfal-Larsen Shipping AS
              • Westfal-Larsen Shipping AS - Overview
              • Westfal-Larsen Shipping AS - Product / Service
              • Westfal-Larsen Shipping AS - Key offerings
            • 14.40 X-Press Feeders Ltd.
              • X-Press Feeders Ltd. - Overview
              • X-Press Feeders Ltd. - Product / Service
              • X-Press Feeders Ltd. - Key offerings
            • 14.41 Yang Ming Marine Transport Corp.
              • Yang Ming Marine Transport Corp. - Overview
              • Yang Ming Marine Transport Corp. - Product / Service
              • Yang Ming Marine Transport Corp. - Key offerings
            • 14.42 ZIM Integrated Shipping Services Ltd.
              • ZIM Integrated Shipping Services Ltd. - Overview
              • ZIM Integrated Shipping Services Ltd. - Product / Service
              • ZIM Integrated Shipping Services Ltd. - Key offerings

            15 Appendix

            • 15.1 Scope of the report
              • 15.2 Inclusions and exclusions checklist
                • Inclusions checklist
                • Exclusions checklist
              • 15.3 Currency conversion rates for US$
                • Currency conversion rates for US$
              • 15.4 Research methodology
                • Research methodology
              • 15.5 Data procurement
                • Information sources
              • 15.6 Data validation
                • Data validation
              • 15.7 Validation techniques employed for market sizing
                • Validation techniques employed for market sizing
              • 15.8 Data synthesis
                • Data synthesis
              • 15.9 360 degree market analysis
                • 360 degree market analysis
              • 15.10 List of abbreviations
                • List of abbreviations

              Research Methodology

              Technavio presents a detailed picture of the market by way of study, synthesis, and summation of data from multiple sources. The analysts have presented the various facets of the market with a particular focus on identifying the key industry influencers. The data thus presented is comprehensive, reliable, and the result of extensive research, both primary and secondary.

              INFORMATION SOURCES

              Primary sources

              • Manufacturers and suppliers
              • Channel partners
              • Industry experts
              • Strategic decision makers

              Secondary sources

              • Industry journals and periodicals
              • Government data
              • Financial reports of key industry players
              • Historical data
              • Press releases

              DATA ANALYSIS

              Data Synthesis

              • Collation of data
              • Estimation of key figures
              • Analysis of derived insights

              Data Validation

              • Triangulation with data models
              • Reference against proprietary databases
              • Corroboration with industry experts

              REPORT WRITING

              Qualitative

              • Market drivers
              • Market challenges
              • Market trends
              • Five forces analysis

              Quantitative

              • Market size and forecast
              • Market segmentation
              • Geographical insights
              • Competitive landscape

              Interested in this report?

              Get your sample now to see our research methodology and insights!

              Download Now

              Frequently Asked Questions

              Container Fleet market growth will increase by $ 7970.9 mn during 2024-2028.

              The Container Fleet market is expected to grow at a CAGR of 6.23% during 2024-2028.

              Container Fleet market is segmented by End-user( Automotive, Mining and minerals, Oil and gas, Others) Type( Dry containers, Reefer containers, Tank containers, Other, South America)

              Maersk, MSC, Mediterranean Shipping, CMA CGM, COSCO Shipping, Hapag-Lloyd, Evergreen Marine, Yang Ming, ZIM Integrated Shipping, Hyundai Merchant Marine, Textainer, CAI International, Seaco Global, Triton International, Florens Container, Beacon Intermodal, Seacube Container, CARU Containers, Blue Sky Intermodal, Touax are a few of the key vendors in the Container Fleet market.

              APAC will register the highest growth rate of 48% among the other regions. Therefore, the Container Fleet market in APAC is expected to garner significant business opportunities for the vendors during the forecast period.

              China, Germany, US, UAE, Brazil

              • Growing intermodal freight transportationIntermodal transportation uses different modes of transportation for transporting goods from one region to another. Some of the key advantages of using intermodal transportation over other modes of transportation are:High efficiencyEnvironment friendlyLow operating costIntermodal transportation is cost-efficient and easy to track is the driving factor this market.
              • and there are few idle periods. It offers door-to-door delivery is the driving factor this market.
              • a shorter delivery time is the driving factor this market.
              • the safety of the cargo is the driving factor this market.
              • and the ability to use different routes. The intermodal freight transportation industry is introducing some major advances in technology is the driving factor this market.
              • such as ICT is the driving factor this market.
              • computerized vehicle routing is the driving factor this market.
              • active traffic management is the driving factor this market.
              • and online freight exchange. Industries such as automotive is the driving factor this market.
              • consumer goods is the driving factor this market.
              • and heavy vehicles rely more on intermodal transportation for the shipment of their products.The market has been dominated by the railroad segment because of less connectivity between rail routes and shipping terminals. However is the driving factor this market.
              • road-water transportation is a rapidly growing segment of the global container fleet market. It uses roadways and waterways to move freight from one location to another. This mode is generally used for the transportation of heavy vehicles or when a big cargo has to be sent.There are three main configurations of transferring goods via the road-water mode:On-dockNear-dockOff-dockOn-dock is further classified into:On-dock liveOn-dock dropOn-dock double storageSimilarly is the driving factor this market.
              • near-dock is categorized into:Near-dock adjacentNear-dock non-adjacentSuch factors are expected to drive the growth of the global container fleet market during the forecast period. is the driving factor this market.

              The Container Fleet market vendors should focus on grabbing business opportunities from the Automotive segment as it accounted for the largest market share in the base year.