Copper Foil Market Size 2024-2028
The copper foil market size is forecast to increase by USD 5.01 billion at a CAGR of 8.6% between 2023 and 2028.
- The market is experiencing significant growth due to expanding manufacturing capacities and the increase In the electric vehicle (EV) sector. The increasing demand for advanced technologies, such as flexible printed circuits and high-frequency applications, is driving the market's expansion. Copper foils are essential components In the manufacturing of printed circuit boards (PCBs) for consumer electronics, such as smartphones and computers, as well as in lithium-ion batteries for mobile devices and electric vehicles. Copper foils also find extensive use in insulating metals, electromagnetic capabilities, and solar panel manufacturing, contributing to the renewable energy sector's growth. However, the high production costs of copper foils remain a challenge for market growth. Copper foil manufacturers are addressing this issue by implementing cost-effective production methods and exploring alternative materials. The market is expected to witness steady growth In the coming years, with the increasing adoption of copper foils in various industries, including telecommunications, electronics, and automotive. The expansion of these sectors, particularly in North America, is expected to provide significant opportunities for market growth.
What will be the Size of the Market During the Forecast Period?
- The market encompasses the production and supply of copper foils used in various electrical and electronic applications. The market's growth is driven by the increasing demand for high-performance electronics and sustainable energy solutions. Copper foils offer superior electrical properties, including high conductivity, low dielectric loss, and thermal conductivity, making them indispensable in advanced electronic products. Two primary types of copper foils are electrodeposited copper foil and rolled copper foil.
- The former is used in high-purity applications, while the latter is suitable for mass production. As the global shift towards eco-friendly energy sources continues, the market is expected to expand significantly, with potential for reaching gigawatts (GW) of solar panel manufacturing capacity. The market's future direction remains positive, fueled by the increasing demand for high-conductivity materials in various electrical applications.
How is this Industry segmented and which is the largest segment?
The industry research report provides comprehensive data (region-wise segment analysis), with forecasts and estimates in "USD billion" for the period 2024-2028, as well as historical data from 2018-2022 for the following segments.
- Type
- Electrodeposited copper foil
- Rolled copper foil
- Application
- Printed circuit boards
- Batteries
- Solar energy
- Others
- Geography
- APAC
- China
- India
- Japan
- South Korea
- North America
- Canada
- US
- Europe
- Germany
- Italy
- Middle East and Africa
- South America
- Brazil
- APAC
By Type Insights
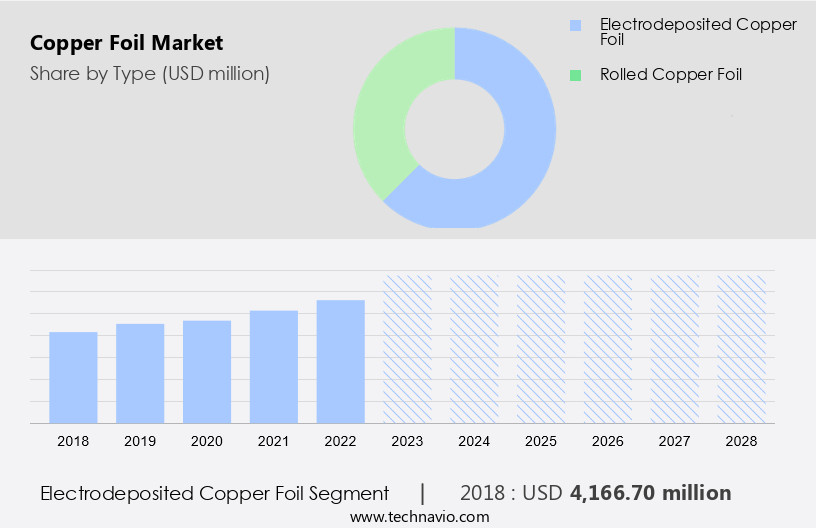
- The electrodeposited copper foil segment is estimated to witness significant growth during the forecast period.
Electrodeposited copper foil plays a pivotal role In the electronics sector, recognized for its high conductivity and versatility. Manufactured through an electroplating process, copper ions are deposited onto a conductive substrate to form a thin, uniform, and smooth layer. This copper foil is extensively used In the production of printed circuit boards (PCBs) and lithium-ion batteries (LIBs) due to its superior electrical properties. Its high purity and low dielectric loss make it an optimal choice for high-performance electronics, including consumer electronics, mobile devices, electric vehicles, and renewable energy applications such as solar panels and wind turbines. The advanced materials and electromagnetic capabilities of electrodeposited copper foil contribute to the development of smartphones, computers, electric vehicles, and various electrical applications.
Get a glance at the market report of share of various segments Request Free Sample
The electrodeposited copper foil segment was valued at USD 4.17 billion in 2018 and showed a gradual increase during the forecast period.
Regional Analysis
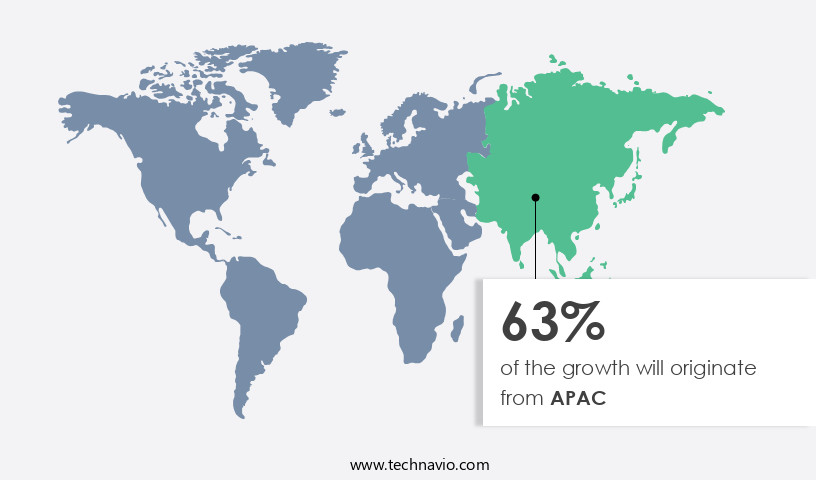
- APAC is estimated to contribute 63% to the growth of the global market during the forecast period.
Technavio's analysts have elaborately explained the regional trends and drivers that shape the market during the forecast period.
For more insights on the market size of various regions, Request Free Sample
The market witnessed substantial growth in 2023, particularly In the Asia Pacific region, which accounted for a significant market share. This expansion was primarily driven by the automotive and renewable energy sectors. In India, for instance, passenger vehicle sales grew by 3.2% year-over-year in December 2023, reaching approximately 242,920 units. Between October and December 2023, vehicle sales rose by 7.4% year-over-year, totaling around 1,247,614 units. Excluding luxury brands, sales of passenger vehicles, utility vehicles, and vans increased by 8.4% to about 1,013,082 units. The increasing demand for automotive components, including copper foils, is a testament to the industry's efforts to enhance performance, efficiency, and safety.
Market Dynamics
Our researchers analyzed the data with 2023 as the base year, along with the key drivers, trends, and challenges. A holistic analysis of drivers will help companies refine their marketing strategies to gain a competitive advantage.
What are the key market drivers leading to the rise In the adoption of Copper Foil Industry?
Expansion of copper foil manufacturing plants is the key driver of the market.
- The market is experiencing significant growth due to increasing demand from various sectors, particularly electronics. Copper foils are crucial components in Printed Circuit Boards used in Consumer Electronics, including Mobile Devices, and High-Performance Electronics such as those used In the internet of things (IoT) and advanced materials. In the renewable energy sector, copper foils are utilized in Solar Panels and Wind Turbines, contributing to the expansion of solar photovoltaic capacity. The automotive industry also relies heavily on copper foils In the production of batteries, specifically Lithium-Ion, nickel-Metal Hydride, and Automotive batteries. Copper's high thermal conductivity, low dielectric loss, and high conductivity make it an ideal material for these applications.
- The increasing popularity of Electric Vehicles (EVs) is further fueling copper foil demand due to their role as current collectors in batteries. Copper foils' electrical properties and electromagnetic capabilities make them essential components in various electronic products, including smartphones, computers, and other consumer electronics. The copper market is expected to grow in tandem with the expansion of these industries, driven by the increasing demand for sustainable and eco-friendly energy sources. The market is poised for continued growth, with significant potential In the renewable energy and electric vehicle sectors.
What are the market trends shaping the Copper Foil Industry?
Expansion of EV sector is the upcoming market trend.
- The market is experiencing notable growth due to the increasing demand for advanced materials in various sectors, particularly in Electronics and Renewable Energy. Copper foils play a significant role in Printed Circuit Boards (PCBs) and Lithium-Ion Batteries (LIBs), which are integral to Consumer Electronics, Mobile Devices, and Electric Vehicles (EVs). Their high thermal conductivity and low dielectric loss make them ideal for high-performance electronics and IoT applications. In the Electronics industry, copper foils contribute to the production of high-purity copper foils for use in high-tech electronic products, such as smartphones and computers. In the Energy sector, copper foils are essential for solar panels and wind turbines, as they support the efficient transfer of electrical energy from these renewable sources.
- Copper foils are also crucial components in batteries, including automotive batteries and LIBs for electric vehicles. In LIBs, copper foils serve as current collectors, ensuring efficient electricity flow and enhancing the longevity and performance of the batteries. The rising demand for sustainable energy and eco-friendly energy sources, such as solar and wind power, is driving the growth of the market. The market dynamics are further influenced by the increasing production of electric vehicles and the expanding photovoltaic solar capacity. Copper foils are also used in various electrical applications, including electrodeposited copper foils for use in batteries and rolled copper foils for use in circuit boards and insulating metals.
What challenges does the Copper Foil Industry face during its growth?
High production costs of copper foils is a key challenge affecting the industry growth.
- The market is a critical segment in various industries, including Electronics, Printed Circuit Boards, Lithium-Ion Batteries, and Consumer Electronics. Copper foil is essential for high-conductivity applications in mobile devices, electric vehicles, and high-performance electronics. Its advanced electrical properties, including thermal conductivity, low dielectric loss, and electromagnetic capabilities, make it indispensable In the production of solar panels, wind turbines, and electric cars. Copper foil's production involves intricate methods such as electrodeposition or rolling, which require substantial resources and skilled labor. Consequently, production costs for copper foils can range from USD 0.50 to USD 5.00 per square meter. High-purity copper foils used in high-tech industries are more expensive due to the stringent quality control measures and specialized processes.
- However, copper foil's importance in sustainable energy and eco-friendly energy sources, such as renewable energy from solar panels and wind turbines, is driving market growth. The market's future potential is significant, with photovoltaic solar capacity reaching gigawatts (GW) and electric vehicle production increasing. Copper foils' versatility in electrical applications, batteries, and insulating metals, makes it a valuable commodity in the global market.
Exclusive Customer Landscape
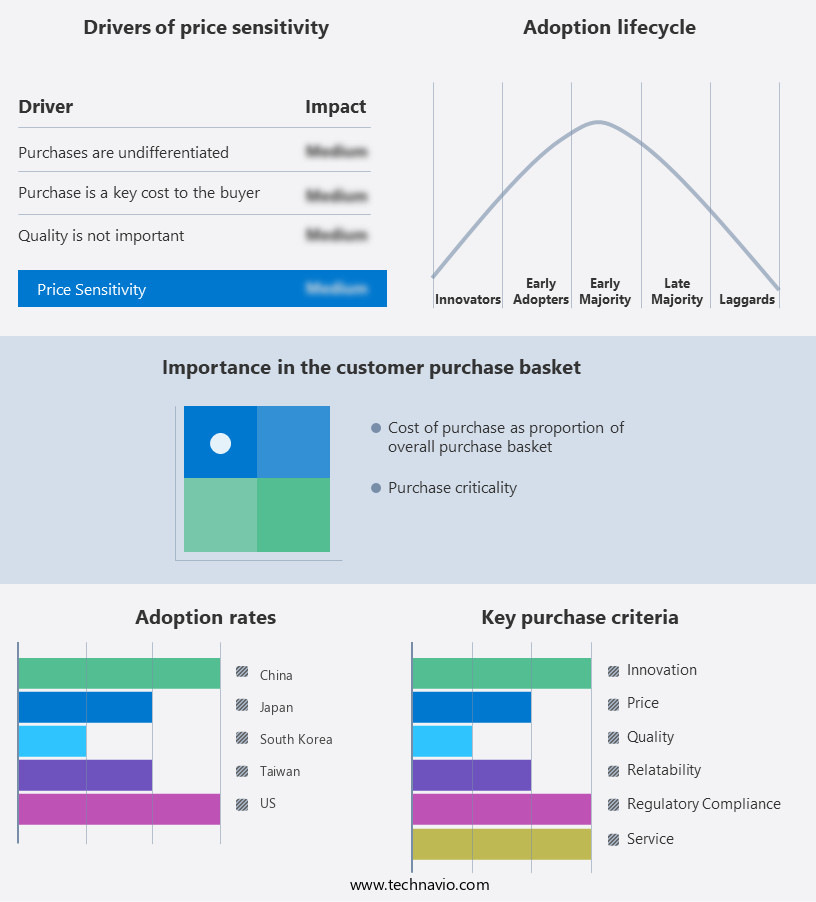
The market forecasting report includes the adoption lifecycle of the market, covering from the innovator's stage to the laggard's stage. It focuses on adoption rates in different regions based on penetration. Furthermore, the market report also includes key purchase criteria and drivers of price sensitivity to help companies evaluate and develop their market growth analysis strategies.
Customer Landscape
Key Companies & Market Insights
Companies are implementing various strategies, such as strategic alliances, market forecast, partnerships, mergers and acquisitions, geographical expansion, and product/service launches, to enhance their presence in the industry.
The industry research and growth report includes detailed analyses of the competitive landscape of the market and information about key companies, including:
- Avocet Precision Metals
- CCI Eurolam S.A.
- Chang Chun Group
- Circuit Foil Luxembourg
- Doosan Electronics Co. Ltd
- Evoqua Water Technologies LLC
- Fukuda Metal Foil and Powder Co. Ltd.
- Furukawa Electric Co. Ltd.
- Iljin Co. Ltd.
- Jiangxi Copper Corporation
- Jima Copper
- JX Advanced Metals Corp
- Londian Wason Holdings Group Co Ltd
- LS MTRON Ltd.
- Pearl Overseas
- Shanghai Metal Corp.
- SK nexilis
- Sumitomo Metal Mining Co. Ltd.
- UACJ Foil Corporation
Qualitative and quantitative analysis of companies has been conducted to help clients understand the wider business environment as well as the strengths and weaknesses of key industry players. Data is qualitatively analyzed to categorize companies as pure play, category-focused, industry-focused, and diversified; it is quantitatively analyzed to categorize companies as dominant, leading, strong, tentative, and weak.
Research Analyst Overview
The market plays a significant role in various industries, particularly In the electronics sector. Copper foil is an essential component In the production of printed circuit boards (PCBs), which are the backbone of modern electronic devices. In addition, it is utilized In the manufacturing of lithium-ion batteries, a key technology powering consumer electronics, electric vehicles (EVs), and renewable energy storage systems. The demand for copper foil is driven by the increasing production of high-performance electronic products, such as smartphones, computers, and IoT devices. The electronics industry requires copper foil for its excellent electrical properties, including high conductivity and low dielectric loss.
In addition, these properties enable efficient power transmission and signal propagation in electronic circuits. Copper foil is also used extensively In the production of batteries, particularly lithium-ion batteries. In batteries, copper foil serves as a current collector, ensuring efficient charge and discharge of the battery. Copper foil's high thermal conductivity and electromagnetic capabilities make it an ideal material for battery applications. The growing adoption of renewable energy sources, such as solar panels and wind turbines, further boosts the market. Copper foil is a critical component In the manufacturing of solar panels, where it is used to create the interconnects that transmit electricity from the solar cells to the inverter.
Furthermore, the increasing deployment of renewable energy capacity, measured in gigawatts (GW), is expected to drive demand for copper foil In the solar industry. Moreover, the copper market as a whole is influenced by various factors, including the price of crude oil and the demand for high-purity copper foils. High-purity copper foils are essential for high-performance electronics and advanced materials applications. The production of these foils requires stringent quality control measures, which can increase production costs. Recycled materials are gaining popularity In the market due to their environmental benefits and cost savings. Recycled copper foil can be produced using various methods, such as hammering and electrolysis.
In addition, the use of recycled materials in copper foil production is expected to increase as sustainability becomes a more significant consideration in various industries. Copper foil's unique electrical properties make it an indispensable component In these applications, ensuring efficient power transmission and signal propagation. The market is influenced by various factors, including the production costs of high-purity copper foils, the adoption of renewable energy sources, and the recycling of copper foil.
|
Market Scope |
|
|
Report Coverage |
Details |
|
Page number |
203 |
|
Base year |
2023 |
|
Historic period |
2018-2022 |
|
Forecast period |
2024-2028 |
|
Growth momentum & CAGR |
Accelerate at a CAGR of 8.6% |
|
Market growth 2024-2028 |
USD 5.01 billion |
|
Market structure |
Fragmented |
|
YoY growth 2023-2024(%) |
8.5 |
|
Key countries |
China, US, Japan, South Korea, Taiwan, Germany, India, Canada, Italy, and Brazil |
|
Competitive landscape |
Leading Companies, market growth and forecasting, Market Positioning of Companies, Competitive Strategies, and Industry Risks |
What are the Key Data Covered in this Market Research and Growth Report?
- CAGR of the Copper Foil industry during the forecast period
- Detailed information on factors that will drive the growth and forecasting between 2024 and 2028
- Precise estimation of the size of the market and its contribution of the industry in focus to the parent market
- Accurate predictions about upcoming growth and trends and changes in consumer behaviour
- Growth of the market across APAC, North America, Europe, Middle East and Africa, and South America
- Thorough analysis of the market's competitive landscape and detailed information about companies
- Comprehensive analysis of factors that will challenge the market growth of industry companies
We can help! Our analysts can customize this market research report to meet your requirements.


