Copra Meal Market Analysis APAC, North America, Europe, South America, Middle East and Africa - US, The Philippines, India, Indonesia, Germany - Size and Forecast 2024-2028

Copra Meal Market Analysis APAC, North America, Europe, South America, Middle East and Africa - US, The Philippines, India, Indonesia, Germany - Size and Forecast 2024-2028

Published: Dec 2023 164 Pages SKU: IRTNTR74048

Market Overview at a Glance

$6.47 K
Market Opportunity
3.96%
CAGR
3.48
YoY growth 2023-2024(%)

Copra Meal Market Size 2024-2028

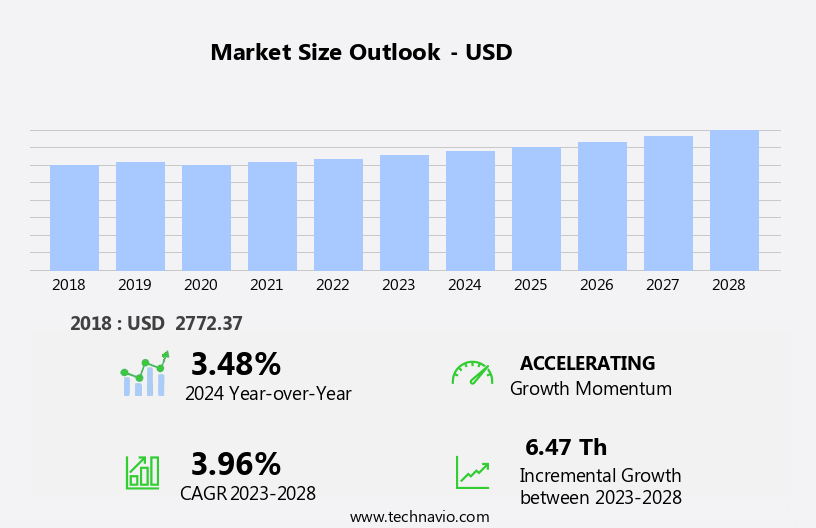
The copra meal market size is forecast to increase by USD 6.47 th at a CAGR of 3.96% between 2023 and 2028.

  • The market is experiencing significant growth, driven primarily by the rising trend in meat production and increasing consumption. This expansion is fueled by the global population's growing demand for animal protein, leading to an increased need for efficient and cost-effective animal feed solutions. One key trend shaping the market is the emergence of private-label brands, as consumers seek more affordable and trusted alternatives to branded products. Furthermore, the growing demand for feed enzymes, which improve nutrient absorption and enhance animal performance, is providing new opportunities for market participants. However, regulatory hurdles and supply chain inconsistencies temper growth potential.
  • Regulatory bodies impose strict guidelines on copra meal production and usage, requiring adherence to stringent quality standards. Additionally, the volatile supply of copra due to weather conditions and harvesting seasons can lead to price fluctuations and supply chain disruptions. To capitalize on market opportunities and navigate these challenges effectively, companies must focus on innovation, regulatory compliance, and supply chain resilience. By addressing these factors, they can differentiate themselves and secure a competitive edge in the market.

What will be the Size of the Copra Meal Market during the forecast period?

Copra Meal Market Size

 Request Free Sample

  • The market is experiencing significant activity and trends in various areas of feed production. Feed certification plays a crucial role in ensuring the circular economy of the industry, as renewable energy sources are integrated into feed manufacturing processes. Feed labeling and byproduct utilization are key aspects of sustainable feed production, enhancing feed digestibility and reducing carbon footprint. Aquaculture production and livestock industries are focusing on feed innovation, with an emphasis on value-added products and alternative protein sources such as plant-based protein. Feed safety and animal health remain top priorities, with advancements in feed technology and feed analysis ensuring high-quality products.
  • Feed formulation software and feed regulation are essential tools for optimizing feed efficiency and reducing costs. The use of bio-based materials in feed production and feed ingredient sourcing contributes to environmental impact reduction and animal welfare improvements. Feed traceability is increasingly important in the industry, ensuring transparency and accountability throughout the supply chain. Feed innovation continues to drive the market, with a focus on feed efficiency improvement and feed ingredient research. Circular economy principles, such as the utilization of agricultural waste, are gaining traction in the market, contributing to a more sustainable and eco-friendly industry. The integration of feed technology and feed regulation fosters a competitive landscape, with companies focusing on feed cost reduction and feed quality testing to maintain market position.

How is this Copra Meal Industry segmented?

The copra meal industry research report provides comprehensive data (region-wise segment analysis), with forecasts and estimates in "USD thousand" for the period 2024-2028, as well as historical data from 2018-2022 for the following segments.

  • Distribution Channel
    • Offline
    • Online
  • End-user
    • Poultry
    • Swine
    • Ruminant
    • Others
  • Geography
    • North America
      • US
    • Europe
      • Germany
    • APAC
      • India
      • Indonesia
      • The Philippines
    • Rest of World (ROW)

By Distribution Channel Insights

The offline segment is estimated to witness significant growth during the forecast period.

Copra meal, a valuable byproduct of coconut oil production, is gaining popularity in the animal feed industry due to its high nutritional value. The coconut industry's sustainability efforts and the increasing demand for non-GMO feed have further boosted its market potential. Coconut products, such as copra cake, oil, fiber, and water, are essential inputs in feed formulation. Feed mills process these raw materials into various feed types, including aquaculture feed, poultry feed, and organic feed. The coconut market's growth is driven by the rising demand for animal feed and sustainable agriculture. Feed efficiency is a crucial factor in the industry, making copra meal an attractive protein source with a favorable amino acid profile.

Coconut certification schemes ensure the traceability and quality of copra meal, further enhancing its appeal. Convenience and grocery stores have emerged as significant distribution channels for copra meal. The increasing number of convenience stores in major countries, such as the UK, China, India, and Japan, is contributing to the growth of this sector. Urbanization and changing lifestyles have led to the prevalence of convenience and grocery stores worldwide, catering to the time-pressed urban population. The growth of organized retail in both developed and developing economies has made supermarkets and hypermarkets the most popular distribution channels for copra meal and related products.

Attractive shelf displays and discounts offer unique shopping experiences for consumers, encouraging them to purchase copra meal in higher quantities. The coconut supply chain, from farming to processing and distribution, is undergoing continuous improvements to ensure energy efficiency and reduce waste. The coconut industry's focus on sustainable agriculture and quality control is essential to maintaining consumer trust and ensuring the long-term success of the market. In summary, the market is experiencing significant growth due to its nutritional value, sustainability, and the increasing demand for non-GMO feed. Convenience and grocery stores are becoming essential distribution channels, while the coconut industry's focus on sustainable agriculture and quality control is ensuring long-term success.

Copra Meal Market Size

Request Free Sample

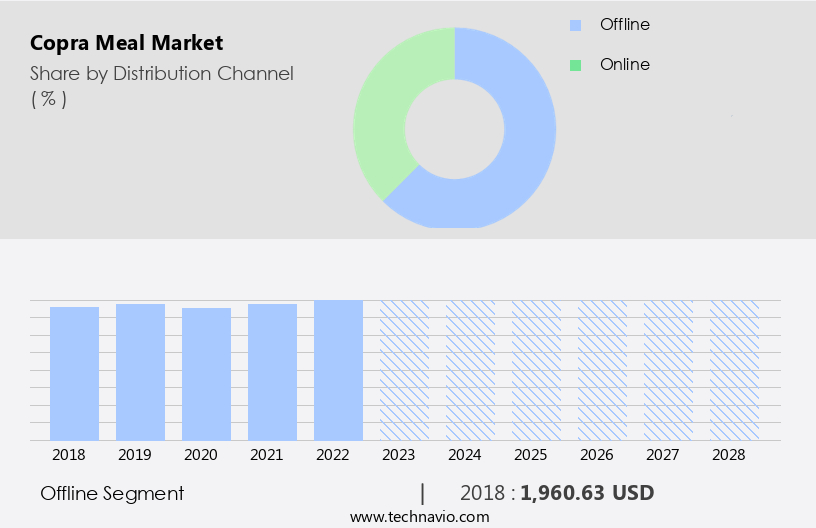
The Offline segment was valued at USD 1,960.63 th in 2018 and showed a gradual increase during the forecast period.

Regional Analysis

APAC is estimated to contribute 50% to the growth of the global market during the forecast period. Technavio's analysts have elaborately explained the regional trends and drivers that shape the market during the forecast period.

Copra Meal Market Share by Geography

Download Free Sample Report

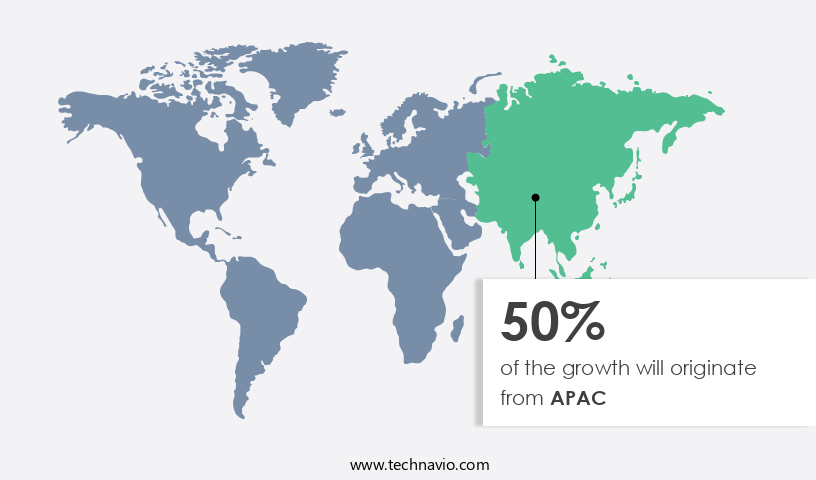
The market in Asia Pacific (APAC) experienced significant growth in 2023, with the region accounting for the largest share of global consumption. The Philippines, as a key supplier, dominates the APAC market, exporting a substantial amount of copra meal, also known as coconut meal, to major consumers like South Korea, Japan, and Vietnam. India, China, and Japan were significant revenue contributors to the market due to increasing livestock populations and meat production. The demand for protein-rich animal feed, including copra meal, is on the rise in the region, fueling the growth of the meat industry.

Copra meal, derived from coconut byproducts such as copra cake and coconut fiber through coconut extraction, is a valuable source of crude protein and energy content. Its use in aquaculture feed and poultry feed, along with feed formulation and processing, contributes to improved feed efficiency. The coconut industry's sustainability efforts, including organic farming and certification, further enhance the market's appeal. Coconut byproducts, such as copra meal, coconut flour, and coconut fiber, are essential components of the feed manufacturing process. The nutritional value of copra meal, which includes essential amino acids and fiber, makes it an attractive protein source for the animal feed industry.

The coconut supply chain, from cultivation to processing, is crucial to maintaining the quality and traceability of copra meal.

Market Dynamics

Our researchers analyzed the data with 2023 as the base year, along with the key drivers, trends, and challenges. A holistic analysis of drivers will help companies refine their marketing strategies to gain a competitive advantage.

What are the Copra Meal market drivers leading to the rise in the adoption of Industry?

  • The significant increase in meat production and consumption serves as the primary market driver. 
  • The market is experiencing significant growth due to the increasing demand for animal feed in response to rising meat consumption worldwide. In 2021, global per capita meat consumption surpassed 93.47 pounds, and chicken meat production reached over 135 million tons. The global population's rapid expansion has led to a surge in meat consumption, driving the need for sustainable agriculture practices and efficient protein sources. Copra meal, derived from coconut processing, is a valuable addition to the animal feed industry.
  • Its high crude protein content and energy value make it an essential component of livestock nutrition, enhancing production efficiency and animal health. The coconut supply chain's expansion and advancements in coconut processing techniques have increased copra meal production capacity, further fueling market growth. Additionally, the emphasis on coconut traceability and adherence to coconut and copra meal standards ensures the sustainability and quality of this protein source.

What are the Copra Meal market trends shaping the Industry?

  • Private-label brands are gaining increasing popularity in the market, representing an emerging trend.
  • The market is experiencing a shift towards private label brands, reflecting evolving consumer preferences and market trends. In contrast to traditional branded offerings, private label brands, which are produced and marketed by retailers, have gained popularity due to their affordability and consistent quality. Retailers, by controlling the supply chain, can ensure product standards and provide cost savings to consumers. Additionally, private label brands cater to the increasing demand for aquaculture feed and feed formulation, which utilize copra cake, coconut oil, coconut fiber, and coconut husk as key ingredients in the coconut products industry.
  • This trend is expected to persist as consumers continue to seek cost-effective, high-quality alternatives in the market.

How does Copra Meal market faces challenges face during its growth?

  • The expanding need for feed enzymes poses a significant challenge to the industry's growth trajectory. 
  • Feed enzymes, derived from bacteria and fungi, enhance animal feed efficiency by aiding in the digestion of complex ingredients, such as phytates, proteins, and glucans. These enzymes are widely used in farm animal diets due to their ability to optimize feed conversion and minimize drawbacks. The focus of current research is on improving existing in-feed enzymes and expanding the range of digestible feed ingredients. The Scientific Committee for Animal Nutrition has established guidelines for acceptable usage, ensuring the needs of farmers, consumers, and animals are met.
  • Coconut byproducts, including coconut water and copra meal, are gaining attention in the animal feed industry due to their nutritional value and sustainability. Coconut water is rich in electrolytes and amino acids, while copra meal offers a favorable amino acid profile. The coconut industry's commitment to sustainability through certification programs further increases its appeal as a non-GMO feed source.

Exclusive Customer Landscape

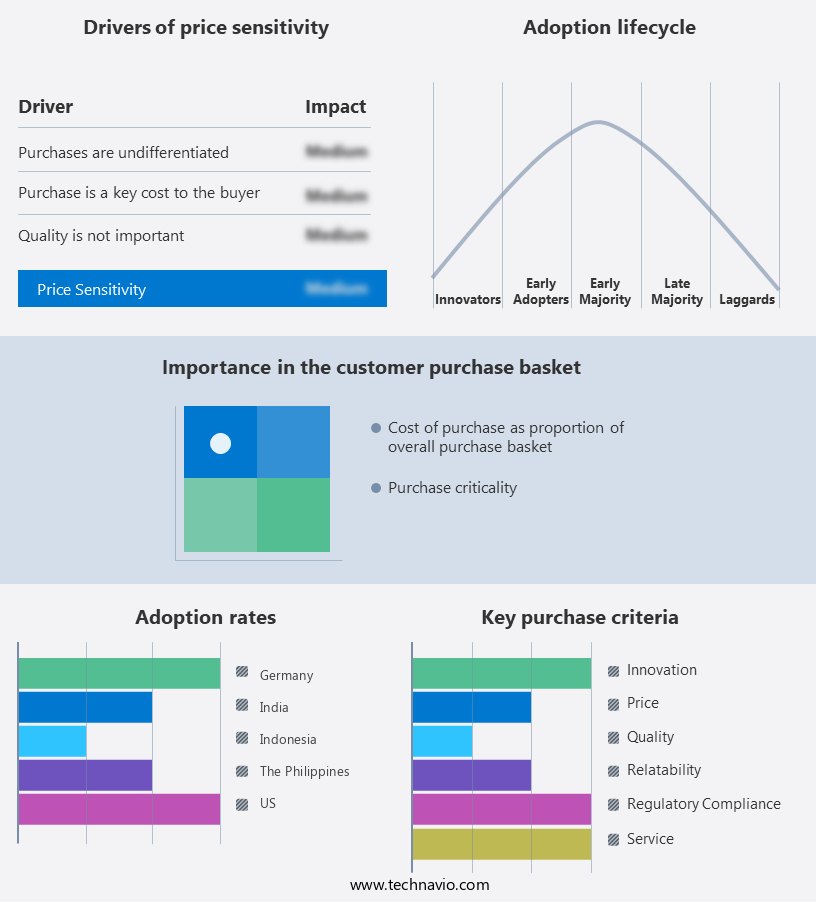
The copra meal market forecasting report includes the adoption lifecycle of the market, covering from the innovator's stage to the laggard's stage. It focuses on adoption rates in different regions based on penetration. Furthermore, the copra meal market report also includes key purchase criteria and drivers of price sensitivity to help companies evaluate and develop their market growth analysis strategies.

Copra Meal Market Share by Geography

 Customer Landscape

Key Companies & Market Insights

Companies are implementing various strategies, such as strategic alliances, copra meal market forecast, partnerships, mergers and acquisitions, geographical expansion, and product/service launches, to enhance their presence in the industry.

Agro Raya Co. - The company specializes in providing a range of copra meal products, including Crude Coconut Oil, Organic Certified Refined Coconut Oil, and Refined Bleached Coconut Oil.

The industry research and growth report includes detailed analyses of the competitive landscape of the market and information about key companies, including:

  • Agro Raya Co.
  • BIOTECH UPLB
  • CIIF OMG
  • Cocoguru Coconut Industries Pvt. Ltd.
  • Davao Bay Coconut Oil Mills Inc. and Third Millennium Oil Mills Inc.
  • Dr Greenthumbs
  • KERAFED
  • NaMazco Trades and Exports PVT LTD
  • PRIMA INDUSTRIES LTD.
  • PT Agriutama Mandiri Indonesia Jaya
  • PT Anugerah Wajah Pria
  • PT. Golden Union Oil
  • PT. INTINUSA NIAGA ABADI
  • RICH MOON CO. LTD.
  • Riverina
  • Royal Flour Mills Pvt. Ltd
  • Samar Coco Products Manufacturing Corp.
  • Tantuco Enterprises Inc.
  • Vaighai Agro
  • Kripadhara
  • Southern Corp.
  • Sri Sellandiamman Oil Mill

Qualitative and quantitative analysis of companies has been conducted to help clients understand the wider business environment as well as the strengths and weaknesses of key industry players. Data is qualitatively analyzed to categorize companies as pure play, category-focused, industry-focused, and diversified; it is quantitatively analyzed to categorize companies as dominant, leading, strong, tentative, and weak.

Recent Development and News in Copra Meal Market

  • In January 2024, Archer Daniels Midland Company (ADM), a leading global food ingredient manufacturer, announced the launch of its new copra meal product line, NutriFuse Copra Meal, designed for sustainable aquaculture feed applications (ADM press release, 2024). This innovative product line is expected to contribute significantly to the market's growth, as the demand for sustainable and eco-friendly aquaculture feeds continues to rise.
  • In March 2025, Cargill, a global leader in nutrition and agriculture, entered into a strategic partnership with Maruha Nichiro Corporation, a major Japanese seafood company, to expand its copra meal production capacity and strengthen its presence in the Asian market (Cargill press release, 2025). This collaboration is expected to boost both companies' market shares and enhance their offerings to customers in the region.
  • In May 2024, the European Commission approved the use of copra meal as a feed ingredient for all farm animals, including pigs, poultry, and ruminants, marking a significant regulatory milestone for the market (European Commission press release, 2024). This approval is expected to increase the demand for copra meal in the European market and provide a competitive edge to manufacturers operating in the region.
  • In October 2025, Bunge Limited, a leading agribusiness and food company, announced a major investment of USD 100 million in a copra crushing facility in the Pacific Islands, aiming to increase its copra meal production capacity and secure a stable supply of raw materials (Bunge press release, 2025). This investment is expected to significantly boost the company's market share and contribute to the overall growth of the market.

Research Analyst Overview

The market continues to evolve, with dynamic interactions between various sectors shaping its growth. Coconut products, such as copra cake and coconut oil, play a pivotal role in the market, with their applications extending to livestock feed and feed mill industries. The coconut market and trade are influenced by numerous factors, including the availability of raw materials, global demand, and production costs. Coconut fiber, an essential byproduct of copra cake production, is utilized in feed formulation, contributing to feed efficiency and nutritional value. Aquaculture feed is another significant application for copra meal, as it provides a sustainable protein source for fish and shrimp farming.

Coconut extraction processes, such as coconut oil and copra oil production, generate valuable copra meal as a byproduct. The feed industry's ongoing quest for sustainable agriculture and non-GMO feed sources further bolsters the demand for coconut meal. Feed manufacturing processes incorporate copra meal into animal feed formulations, enhancing their energy content, crude protein, and amino acid profile. Coconut water and coconut milk are also gaining popularity as alternative feed ingredients, providing additional nutritional benefits. The coconut industry's focus on sustainability, certification, and quality control ensures the continuous improvement of copra meal production and its applications. Coconut husk, a byproduct of coconut processing, is being explored for its potential use as feed additives and fuel sources, further expanding the market's scope.

The market's continuous evolution is driven by the diverse applications of coconut products and the ever-changing needs of the livestock feed, feed mill, and aquaculture industries. The integration of coconut byproducts into feed formulation, the pursuit of sustainable agriculture practices, and the ongoing research and development in the coconut industry all contribute to the market's dynamic nature.

Dive into Technavio's robust research methodology, blending expert interviews, extensive data synthesis, and validated models for unparalleled Copra Meal Market insights. See full methodology.

Market Scope

Report Coverage

Details

Page number

164

Base year

2023

Historic period

2018-2022

Forecast period

2024-2028

Growth momentum & CAGR

Accelerate at a CAGR of 3.96%

Market growth 2024-2028

USD 6.47 thousand

Market structure

Fragmented

YoY growth 2023-2024(%)

3.48

Key countries

US, The Philippines, India, Indonesia, and Germany

Competitive landscape

Leading Companies, Market Positioning of Companies, Competitive Strategies, and Industry Risks

Request Free Sample

What are the Key Data Covered in this Copra Meal Market Research and Growth Report?

  • CAGR of the Copra Meal industry during the forecast period
  • Detailed information on factors that will drive the growth and forecasting between 2024 and 2028
  • Precise estimation of the size of the market and its contribution of the industry in focus to the parent market
  • Accurate predictions about upcoming growth and trends and changes in consumer behaviour
  • Growth of the market across APAC, North America, Europe, South America, and Middle East and Africa
  • Thorough analysis of the market's competitive landscape and detailed information about companies
  • Comprehensive analysis of factors that will challenge the copra meal market growth of industry companies

We can help! Our analysts can customize this copra meal market research report to meet your requirements.

Get in touch

1 Executive Summary

  • 1.1 Market overview
    • Exhibit 01: Executive Summary – Chart on Market Overview
    • Exhibit 02: Executive Summary – Data Table on Market Overview
    • Exhibit 03: Executive Summary – Chart on Global Market Characteristics
    • Exhibit 04: Executive Summary – Chart on Market by Geography
    • Exhibit 05: Executive Summary – Chart on Market Segmentation by Distribution Channel
    • Exhibit 06: Executive Summary – Chart on Market Segmentation by End-user
    • Exhibit 07: Executive Summary – Chart on Incremental Growth
    • Exhibit 08: Executive Summary – Data Table on Incremental Growth
    • Exhibit 09: Executive Summary – Chart on Vendor Market Positioning

2 Market Landscape

  • 2.1 Market ecosystem
    • Exhibit 10: Parent market
    • Exhibit 11: Market Characteristics

3 Market Sizing

  • 3.1 Market definition
    • Exhibit 12: Offerings of vendors included in the market definition
  • 3.2 Market segment analysis
    • Exhibit 13: Market segments
  • 3.3 Market size 2023
    • 3.4 Market outlook: Forecast for 2023-2028
      • Exhibit 14: Chart on Global - Market size and forecast 2023-2028 ($ thousand)
      • Exhibit 15: Data Table on Global - Market size and forecast 2023-2028 ($ thousand)
      • Exhibit 16: Chart on Global Market: Year-over-year growth 2023-2028 (%)
      • Exhibit 17: Data Table on Global Market: Year-over-year growth 2023-2028 (%)

    4 Historic Market Size

    • 4.1 Global copra meal market 2018 - 2022
      • Exhibit 18: Historic Market Size – Data Table on global copra meal market 2018 - 2022 ($ thousand)
    • 4.2 Distribution channel Segment Analysis 2018 - 2022
      • Exhibit 19: Historic Market Size – Distribution channel Segment 2018 - 2022 ($ thousand)
    • 4.3 End-user Segment Analysis 2018 - 2022
      • Exhibit 20: Historic Market Size – End-user Segment 2018 - 2022 ($ thousand)
    • 4.4 Geography Segment Analysis 2018 - 2022
      • Exhibit 21: Historic Market Size – Geography Segment 2018 - 2022 ($ thousand)
    • 4.5 Country Segment Analysis 2018 - 2022
      • Exhibit 22: Historic Market Size – Country Segment 2018 - 2022 ($ thousand)

    5 Five Forces Analysis

    • 5.1 Five forces summary
      • Exhibit 23: Five forces analysis - Comparison between 2023 and 2028
    • 5.2 Bargaining power of buyers
      • Exhibit 24: Chart on Bargaining power of buyers – Impact of key factors 2023 and 2028
    • 5.3 Bargaining power of suppliers
      • Exhibit 25: Bargaining power of suppliers – Impact of key factors in 2023 and 2028
    • 5.4 Threat of new entrants
      • Exhibit 26: Threat of new entrants – Impact of key factors in 2023 and 2028
    • 5.5 Threat of substitutes
      • Exhibit 27: Threat of substitutes – Impact of key factors in 2023 and 2028
    • 5.6 Threat of rivalry
      • Exhibit 28: Threat of rivalry – Impact of key factors in 2023 and 2028
    • 5.7 Market condition
      • Exhibit 29: Chart on Market condition - Five forces 2023 and 2028

    6 Market Segmentation by Distribution Channel

    • 6.1 Market segments
      • Exhibit 30: Chart on Distribution Channel - Market share 2023-2028 (%)
      • Exhibit 31: Data Table on Distribution Channel - Market share 2023-2028 (%)
    • 6.2 Comparison by Distribution Channel
      • Exhibit 32: Chart on Comparison by Distribution Channel
      • Exhibit 33: Data Table on Comparison by Distribution Channel
    • 6.3 Offline - Market size and forecast 2023-2028
      • Exhibit 34: Chart on Offline - Market size and forecast 2023-2028 ($ thousand)
      • Exhibit 35: Data Table on Offline - Market size and forecast 2023-2028 ($ thousand)
      • Exhibit 36: Chart on Offline - Year-over-year growth 2023-2028 (%)
      • Exhibit 37: Data Table on Offline - Year-over-year growth 2023-2028 (%)
    • 6.4 Online - Market size and forecast 2023-2028
      • Exhibit 38: Chart on Online - Market size and forecast 2023-2028 ($ thousand)
      • Exhibit 39: Data Table on Online - Market size and forecast 2023-2028 ($ thousand)
      • Exhibit 40: Chart on Online - Year-over-year growth 2023-2028 (%)
      • Exhibit 41: Data Table on Online - Year-over-year growth 2023-2028 (%)
    • 6.5 Market opportunity by Distribution Channel
      • Exhibit 42: Market opportunity by Distribution Channel ($ thousand)
      • Exhibit 43: Data Table on Market opportunity by Distribution Channel ($ thousand)

    7 Market Segmentation by End-user

    • 7.1 Market segments
      • Exhibit 44: Chart on End-user - Market share 2023-2028 (%)
      • Exhibit 45: Data Table on End-user - Market share 2023-2028 (%)
    • 7.2 Comparison by End-user
      • Exhibit 46: Chart on Comparison by End-user
      • Exhibit 47: Data Table on Comparison by End-user
    • 7.3 Poultry - Market size and forecast 2023-2028
      • Exhibit 48: Chart on Poultry - Market size and forecast 2023-2028 ($ thousand)
      • Exhibit 49: Data Table on Poultry - Market size and forecast 2023-2028 ($ thousand)
      • Exhibit 50: Chart on Poultry - Year-over-year growth 2023-2028 (%)
      • Exhibit 51: Data Table on Poultry - Year-over-year growth 2023-2028 (%)
    • 7.4 Swine - Market size and forecast 2023-2028
      • Exhibit 52: Chart on Swine - Market size and forecast 2023-2028 ($ thousand)
      • Exhibit 53: Data Table on Swine - Market size and forecast 2023-2028 ($ thousand)
      • Exhibit 54: Chart on Swine - Year-over-year growth 2023-2028 (%)
      • Exhibit 55: Data Table on Swine - Year-over-year growth 2023-2028 (%)
    • 7.5 Ruminant - Market size and forecast 2023-2028
      • Exhibit 56: Chart on Ruminant - Market size and forecast 2023-2028 ($ thousand)
      • Exhibit 57: Data Table on Ruminant - Market size and forecast 2023-2028 ($ thousand)
      • Exhibit 58: Chart on Ruminant - Year-over-year growth 2023-2028 (%)
      • Exhibit 59: Data Table on Ruminant - Year-over-year growth 2023-2028 (%)
    • 7.6 Others - Market size and forecast 2023-2028
      • Exhibit 60: Chart on Others - Market size and forecast 2023-2028 ($ thousand)
      • Exhibit 61: Data Table on Others - Market size and forecast 2023-2028 ($ thousand)
      • Exhibit 62: Chart on Others - Year-over-year growth 2023-2028 (%)
      • Exhibit 63: Data Table on Others - Year-over-year growth 2023-2028 (%)
    • 7.7 Market opportunity by End-user
      • Exhibit 64: Market opportunity by End-user ($ thousand)
      • Exhibit 65: Data Table on Market opportunity by End-user ($ thousand)

    8 Customer Landscape

    • 8.1 Customer landscape overview
      • Exhibit 66: Analysis of price sensitivity, lifecycle, customer purchase basket, adoption rates, and purchase criteria

    9 Geographic Landscape

    • 9.1 Geographic segmentation
      • Exhibit 67: Chart on Market share by geography 2023-2028 (%)
      • Exhibit 68: Data Table on Market share by geography 2023-2028 (%)
    • 9.2 Geographic comparison
      • Exhibit 69: Chart on Geographic comparison
      • Exhibit 70: Data Table on Geographic comparison
    • 9.3 APAC - Market size and forecast 2023-2028
      • Exhibit 71: Chart on APAC - Market size and forecast 2023-2028 ($ thousand)
      • Exhibit 72: Data Table on APAC - Market size and forecast 2023-2028 ($ thousand)
      • Exhibit 73: Chart on APAC - Year-over-year growth 2023-2028 (%)
      • Exhibit 74: Data Table on APAC - Year-over-year growth 2023-2028 (%)
    • 9.4 North America - Market size and forecast 2023-2028
      • Exhibit 75: Chart on North America - Market size and forecast 2023-2028 ($ thousand)
      • Exhibit 76: Data Table on North America - Market size and forecast 2023-2028 ($ thousand)
      • Exhibit 77: Chart on North America - Year-over-year growth 2023-2028 (%)
      • Exhibit 78: Data Table on North America - Year-over-year growth 2023-2028 (%)
    • 9.5 Europe - Market size and forecast 2023-2028
      • Exhibit 79: Chart on Europe - Market size and forecast 2023-2028 ($ thousand)
      • Exhibit 80: Data Table on Europe - Market size and forecast 2023-2028 ($ thousand)
      • Exhibit 81: Chart on Europe - Year-over-year growth 2023-2028 (%)
      • Exhibit 82: Data Table on Europe - Year-over-year growth 2023-2028 (%)
    • 9.6 South America - Market size and forecast 2023-2028
      • Exhibit 83: Chart on South America - Market size and forecast 2023-2028 ($ thousand)
      • Exhibit 84: Data Table on South America - Market size and forecast 2023-2028 ($ thousand)
      • Exhibit 85: Chart on South America - Year-over-year growth 2023-2028 (%)
      • Exhibit 86: Data Table on South America - Year-over-year growth 2023-2028 (%)
    • 9.7 Middle East and Africa - Market size and forecast 2023-2028
      • Exhibit 87: Chart on Middle East and Africa - Market size and forecast 2023-2028 ($ thousand)
      • Exhibit 88: Data Table on Middle East and Africa - Market size and forecast 2023-2028 ($ thousand)
      • Exhibit 89: Chart on Middle East and Africa - Year-over-year growth 2023-2028 (%)
      • Exhibit 90: Data Table on Middle East and Africa - Year-over-year growth 2023-2028 (%)
    • 9.8 The Philippines - Market size and forecast 2023-2028
      • Exhibit 91: Chart on The Philippines - Market size and forecast 2023-2028 ($ thousand)
      • Exhibit 92: Data Table on The Philippines - Market size and forecast 2023-2028 ($ thousand)
      • Exhibit 93: Chart on The Philippines - Year-over-year growth 2023-2028 (%)
      • Exhibit 94: Data Table on The Philippines - Year-over-year growth 2023-2028 (%)
    • 9.9 US - Market size and forecast 2023-2028
      • Exhibit 95: Chart on US - Market size and forecast 2023-2028 ($ thousand)
      • Exhibit 96: Data Table on US - Market size and forecast 2023-2028 ($ thousand)
      • Exhibit 97: Chart on US - Year-over-year growth 2023-2028 (%)
      • Exhibit 98: Data Table on US - Year-over-year growth 2023-2028 (%)
    • 9.10 India - Market size and forecast 2023-2028
      • Exhibit 99: Chart on India - Market size and forecast 2023-2028 ($ thousand)
      • Exhibit 100: Data Table on India - Market size and forecast 2023-2028 ($ thousand)
      • Exhibit 101: Chart on India - Year-over-year growth 2023-2028 (%)
      • Exhibit 102: Data Table on India - Year-over-year growth 2023-2028 (%)
    • 9.11 Indonesia - Market size and forecast 2023-2028
      • Exhibit 103: Chart on Indonesia - Market size and forecast 2023-2028 ($ thousand)
      • Exhibit 104: Data Table on Indonesia - Market size and forecast 2023-2028 ($ thousand)
      • Exhibit 105: Chart on Indonesia - Year-over-year growth 2023-2028 (%)
      • Exhibit 106: Data Table on Indonesia - Year-over-year growth 2023-2028 (%)
    • 9.12 Germany - Market size and forecast 2023-2028
      • Exhibit 107: Chart on Germany - Market size and forecast 2023-2028 ($ thousand)
      • Exhibit 108: Data Table on Germany - Market size and forecast 2023-2028 ($ thousand)
      • Exhibit 109: Chart on Germany - Year-over-year growth 2023-2028 (%)
      • Exhibit 110: Data Table on Germany - Year-over-year growth 2023-2028 (%)
    • 9.13 Market opportunity by geography
      • Exhibit 111: Market opportunity by geography ($ thousand)
      • Exhibit 112: Data Tables on Market opportunity by geography ($ thousand)

    10 Drivers, Challenges, and Trends

    • 10.1 Market drivers
      • 10.2 Market challenges
        • 10.3 Impact of drivers and challenges
          • Exhibit 113: Impact of drivers and challenges in 2023 and 2028
        • 10.4 Market trends

          11 Vendor Landscape

          • 11.1 Overview
            • 11.2 Vendor landscape
              • Exhibit 114: Overview on Criticality of inputs and Factors of differentiation
            • 11.3 Landscape disruption
              • Exhibit 115: Overview on factors of disruption
            • 11.4 Industry risks
              • Exhibit 116: Impact of key risks on business

            12 Vendor Analysis

            • 12.1 Vendors covered
              • Exhibit 117: Vendors covered
            • 12.2 Market positioning of vendors
              • Exhibit 118: Matrix on vendor position and classification
            • 12.3 CIIF OMG
              • Exhibit 119: CIIF OMG - Overview
              • Exhibit 120: CIIF OMG - Product / Service
              • Exhibit 121: CIIF OMG - Key offerings
            • 12.4 Cocoguru Coconut Industries Pvt. Ltd.
              • Exhibit 122: Cocoguru Coconut Industries Pvt. Ltd. - Overview
              • Exhibit 123: Cocoguru Coconut Industries Pvt. Ltd. - Product / Service
              • Exhibit 124: Cocoguru Coconut Industries Pvt. Ltd. - Key offerings
            • 12.5 Davao Bay Coconut Oil Mills Inc. and Third Millennium Oil Mills Inc.
              • Exhibit 125: Davao Bay Coconut Oil Mills Inc. and Third Millennium Oil Mills Inc. - Overview
              • Exhibit 126: Davao Bay Coconut Oil Mills Inc. and Third Millennium Oil Mills Inc. - Product / Service
              • Exhibit 127: Davao Bay Coconut Oil Mills Inc. and Third Millennium Oil Mills Inc. - Key offerings
            • 12.6 Kripadhara
              • Exhibit 128: Kripadhara - Overview
              • Exhibit 129: Kripadhara - Product / Service
              • Exhibit 130: Kripadhara - Key offerings
            • 12.7 NaMazco Trades and Exports PVT LTD
              • Exhibit 131: NaMazco Trades and Exports PVT LTD - Overview
              • Exhibit 132: NaMazco Trades and Exports PVT LTD - Product / Service
              • Exhibit 133: NaMazco Trades and Exports PVT LTD - Key offerings
            • 12.8 PRIMA INDUSTRIES LTD.
              • Exhibit 134: PRIMA INDUSTRIES LTD. - Overview
              • Exhibit 135: PRIMA INDUSTRIES LTD. - Product / Service
              • Exhibit 136: PRIMA INDUSTRIES LTD. - Key offerings
            • 12.9 PT Anugerah Wajah Pria
              • Exhibit 137: PT Anugerah Wajah Pria - Overview
              • Exhibit 138: PT Anugerah Wajah Pria - Product / Service
              • Exhibit 139: PT Anugerah Wajah Pria - Key offerings
            • 12.10 PT. Golden Union Oil
              • Exhibit 140: PT. Golden Union Oil - Overview
              • Exhibit 141: PT. Golden Union Oil - Product / Service
              • Exhibit 142: PT. Golden Union Oil - Key offerings
            • 12.11 PT. INTINUSA NIAGA ABADI
              • Exhibit 143: PT. INTINUSA NIAGA ABADI - Overview
              • Exhibit 144: PT. INTINUSA NIAGA ABADI - Product / Service
              • Exhibit 145: PT. INTINUSA NIAGA ABADI - Key offerings
            • 12.12 RICH MOON CO. LTD.
              • Exhibit 146: RICH MOON CO. LTD. - Overview
              • Exhibit 147: RICH MOON CO. LTD. - Product / Service
              • Exhibit 148: RICH MOON CO. LTD. - Key offerings
            • 12.13 Royal Flour Mills Pvt. Ltd
              • Exhibit 149: Royal Flour Mills Pvt. Ltd - Overview
              • Exhibit 150: Royal Flour Mills Pvt. Ltd - Product / Service
              • Exhibit 151: Royal Flour Mills Pvt. Ltd - Key offerings
            • 12.14 Samar Coco Products Manufacturing Corp.
              • Exhibit 152: Samar Coco Products Manufacturing Corp. - Overview
              • Exhibit 153: Samar Coco Products Manufacturing Corp. - Product / Service
              • Exhibit 154: Samar Coco Products Manufacturing Corp. - Key offerings
            • 12.15 Southern Corp.
              • Exhibit 155: Southern Corp. - Overview
              • Exhibit 156: Southern Corp. - Product / Service
              • Exhibit 157: Southern Corp. - Key offerings
            • 12.16 Sri Sellandiamman Oil Mill
              • Exhibit 158: Sri Sellandiamman Oil Mill - Overview
              • Exhibit 159: Sri Sellandiamman Oil Mill - Product / Service
              • Exhibit 160: Sri Sellandiamman Oil Mill - Key offerings
            • 12.17 Vaighai Agro
              • Exhibit 161: Vaighai Agro - Overview
              • Exhibit 162: Vaighai Agro - Product / Service
              • Exhibit 163: Vaighai Agro - Key offerings

            13 Appendix

            • 13.1 Scope of the report
              • 13.2 Inclusions and exclusions checklist
                • Exhibit 164: Inclusions checklist
                • Exhibit 165: Exclusions checklist
              • 13.3 Currency conversion rates for US$
                • Exhibit 166: Currency conversion rates for US$
              • 13.4 Research methodology
                • Exhibit 167: Research methodology
                • Exhibit 168: Validation techniques employed for market sizing
                • Exhibit 169: Information sources
              • 13.5 List of abbreviations
                • Exhibit 170: List of abbreviations

              Research Methodology

              Technavio presents a detailed picture of the market by way of study, synthesis, and summation of data from multiple sources. The analysts have presented the various facets of the market with a particular focus on identifying the key industry influencers. The data thus presented is comprehensive, reliable, and the result of extensive research, both primary and secondary.

              INFORMATION SOURCES

              Primary sources

              • Manufacturers and suppliers
              • Channel partners
              • Industry experts
              • Strategic decision makers

              Secondary sources

              • Industry journals and periodicals
              • Government data
              • Financial reports of key industry players
              • Historical data
              • Press releases

              DATA ANALYSIS

              Data Synthesis

              • Collation of data
              • Estimation of key figures
              • Analysis of derived insights

              Data Validation

              • Triangulation with data models
              • Reference against proprietary databases
              • Corroboration with industry experts

              REPORT WRITING

              Qualitative

              • Market drivers
              • Market challenges
              • Market trends
              • Five forces analysis

              Quantitative

              • Market size and forecast
              • Market segmentation
              • Geographical insights
              • Competitive landscape

              Interested in this report?

              Get your sample now to see our research methodology and insights!

              Download Now

              Frequently Asked Questions

              Copra Meal market growth will increase by $ 6.47 th during 2024-2028.

              The Copra Meal market is expected to grow at a CAGR of 3.96% during 2024-2028.

              Copra Meal market is segmented by Distribution Channel( Offline, Online) End-user( Poultry, Swine, Ruminant, Others, Middle East and Africa)

              Agro Raya Co., BIOTECH UPLB, CIIF OMG, Cocoguru Coconut Industries Pvt. Ltd., Davao Bay Coconut Oil Mills Inc. and Third Millennium Oil Mills Inc., Dr Greenthumbs, KERAFED, NaMazco Trades and Exports PVT LTD, PRIMA INDUSTRIES LTD., PT Agriutama Mandiri Indonesia Jaya, PT Anugerah Wajah Pria, PT. Golden Union Oil, PT. INTINUSA NIAGA ABADI, RICH MOON CO. LTD., Riverina, Royal Flour Mills Pvt. Ltd, Samar Coco Products Manufacturing Corp., Tantuco Enterprises Inc., Vaighai Agro, Kripadhara, Southern Corp., Sri Sellandiamman Oil Mill are a few of the key vendors in the Copra Meal market.

              APAC will register the highest growth rate of 50% among the other regions. Therefore, the Copra Meal market in APAC is expected to garner significant business opportunities for the vendors during the forecast period.

              US, The Philippines, India, Indonesia, Germany

              • Raising meat production and consumptionThe increase in the production of animal feed is the driving factor this market.
              • such as copra meal is the driving factor this market.
              • is driven by the rise in meat consumption worldwide. For instance is the driving factor this market.
              • the global per capita meat consumption was over 93.47 pounds in 2021. Similarly is the driving factor this market.
              • global chicken meat production was over 135 million tons in 2021. Moreover is the driving factor this market.
              • there has been an exponential increase in the global per capita global consumption of meat due to the rapid population growth worldwide. All these factors is the driving factor this market.
              • combined with the expansion of production capacity and supply of copra meal is the driving factor this market.
              • are driving the global animal feed industry is the driving factor this market.
              • as well as the copra meal market. Copra meal contributes significantly to the nutrition intake in livestock is the driving factor this market.
              • thus improving livestock production is the driving factor this market.
              • efficiency is the driving factor this market.
              • and health. Additionally is the driving factor this market.
              • livestock rearing is the driving factor this market.
              • and consumption of animal products are crucial to the economic and nutritional well-being of people. An exponential increase in meat production and consumption is mainly being witnessed in North America is the driving factor this market.
              • South America is the driving factor this market.
              • Europe is the driving factor this market.
              • and MEA. The growing economy has boosted the production and consumption of meat is the driving factor this market.
              • which has also improved the sales of copra meal. Developments in breeding is the driving factor this market.
              • nutrition is the driving factor this market.
              • and animal health are key drivers that will continue to contribute to the increasing potential production and further efficiency. Also is the driving factor this market.
              • the forecast period will witness a transformation in livestock production practices is the driving factor this market.
              • taking them from local multipurpose activity to more intensive is the driving factor this market.
              • market-oriented is the driving factor this market.
              • and increasingly integrated practices. In most regions is the driving factor this market.
              • a lack of arable land limits livestock growth in extensive production systems. Therefore is the driving factor this market.
              • most of the increase in production will come from increased productivity is the driving factor this market.
              • intensification is the driving factor this market.
              • and wider adoption of better marketing technologies. A major trend in livestock production has been the growth of vertically integrated and intensive establishments close to large urban centers is the driving factor this market.
              • particularly in pork and poultry meat production in East Asia and South America and broiler meat production in South Asia. China is the world largest producer and consumer of pork. A similar trend is seen in beef production is the driving factor this market.
              • though to a lesser degree. For example is the driving factor this market.
              • in Argentina and Brazil is the driving factor this market.
              • the demand for beef is expected to grow rapidly during the forecast period. Therefore is the driving factor this market.
              • key competitors are producing a large amount of copra meal to meet the livestock nutritional requirements is the driving factor this market.
              • which will result in significant growth in the global copra meal market during the forecast period. is the driving factor this market.

              The Copra Meal market vendors should focus on grabbing business opportunities from the Offline segment as it accounted for the largest market share in the base year.
              RIA - Research AI Assistant
              Ask RIA