Cranial Orthoses Market Size 2025-2029
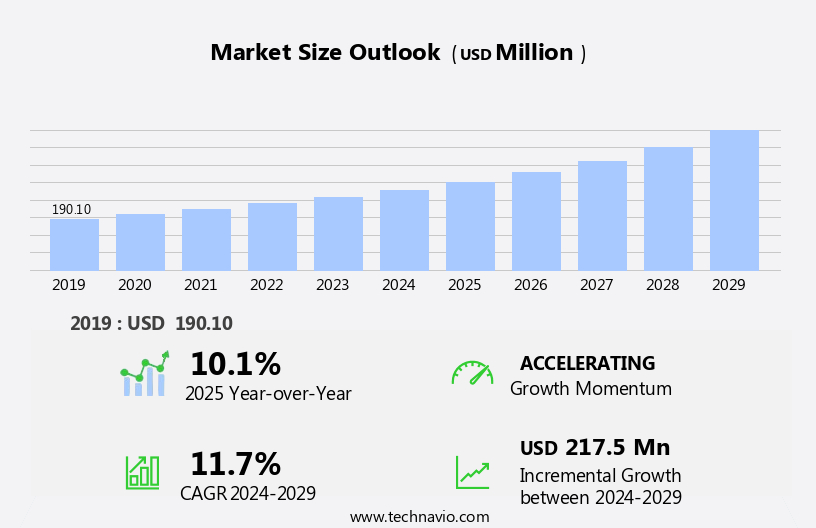
The cranial orthoses market size is forecast to increase by USD 217.5 million at a CAGR of 11.7% between 2024 and 2029.
- The market is experiencing significant growth due to the increasing incidence of cranial deformities among infants and children. These deformities can result from various conditions such as positional plagiocephaly, brachycephaly, and scoliosis, among others. The market is furthered by advancements in technology and medical devices, with the adoption of 3D scanning techniques for creating customized cranial orthoses. This not only ensures a precise fit but also reduces the need for multiple fittings, thereby improving patient satisfaction and reducing healthcare costs. However, the market is not without challenges. The availability of alternative methods, such as helmet alternatives, tele-medicine, and non-surgical treatments, poses a threat to the market growth.
- These alternatives offer lower costs and less invasive procedures, making them attractive options for patients and parents. Therefore, market players must focus on developing innovative and cost-effective solutions to remain competitive. The market is experiencing significant growth, driven by the increasing prevalence of diseases and the emergence of innovative medical technologies. Additionally, regulatory requirements and reimbursement policies vary significantly across regions, adding complexity to market entry and expansion strategies. Companies seeking to capitalize on market opportunities must navigate these challenges effectively by staying informed of regulatory changes and developing partnerships with healthcare providers and insurers to ensure reimbursement coverage.
What will be the Size of the Cranial Orthoses Market during the forecast period?
- The market, specifically focusing on head shape analysis, is experiencing significant growth due to advancements in helmet design innovation and the use of biocompatible materials. Patient satisfaction is prioritized through adjustable straps and helmet comfort, leading to increased helmet acceptance. Physical therapy and clinical guidelines play crucial roles in treatment duration and helmet wearability. Insurance coverage and supply chain management are key market dynamics, ensuring cost-effectiveness analysis and efficient distribution. Helmet compliance with medical device regulations and quality control are essential for market entry and maintaining industry standards. Infant head shape concerns, including positional plagiocephaly, drive demand for innovative helmet solutions.
- Helmet disposal and durability are addressed through recycling programs and improved helmet design. Data analytics, machine learning, and remote monitoring contribute to personalized medicine and treatment outcomes research. Aesthetic considerations, helmet styling, and helmet hygiene are also important factors in market trends. Intellectual property and product liability are critical aspects of the market, with ongoing research in treatment protocols and patient education. The future of the craniofacial abnormalities market lies in the integration of artificial intelligence and cephalic index analysis. Parent support groups and helmet customization cater to individual patient needs, further enhancing market growth.
- Overall, the craniofacial abnormalities market is a dynamic and evolving landscape, driven by technological advancements like ML and a focus on patient-centered care.
How is this Cranial Orthoses Industry segmented?
The cranial orthoses industry research report provides comprehensive data (region-wise segment analysis), with forecasts and estimates in "USD million" for the period 2025-2029, as well as historical data from 2019-2023 for the following segments.
- Application
- Plagiocephaly
- Scaphocephaly
- Brachycephaly
- Type
- Active helmets
- Passive helmets
- End-user
- Hospitals
- Clinics
- Home care
- Geography
- North America
- US
- Canada
- Europe
- France
- Germany
- Italy
- UK
- APAC
- China
- India
- Japan
- South Korea
- Rest of World (ROW)
- North America
By Application Insights
The plagiocephaly segment is estimated to witness significant growth during the forecast period. Plagiocephaly, a condition characterized by an asymmetric head shape, affects approximately one in every 2,000-3,000 births worldwide. This condition results from the premature fusion of the coronal suture, which hinders the normal growth of the forehead and brow on the affected side. Custom-fitted helmets, designed to address this issue, have gained significant attention in the healthcare industry. These helmets are tailored to individual head circumferences and feature advanced ventilation systems to ensure comfort and proper fit. Healthcare professionals adhere to stringent helmet safety standards during the manufacturing process to ensure the highest level of patient satisfaction and safety. Clinical studies have shown that custom-fitted helmets can effectively address positional plagiocephaly, with positive long-term outcomes.
The cost of treatment and helmet lifespan are essential considerations for patients and insurers, making supply chain management and insurance coverage crucial elements of the market. Infant development plays a significant role in the adoption of these helmets, as early intervention is essential for optimal results. Adjustable straps and comfortable designs enhance the appeal of these helmets, making them a popular choice for parents and medical professionals. The market for custom-fitted helmets continues to evolve, with ongoing research focusing on improving helmet efficacy, helmet maintenance, and alternative treatments such as cranial molding helmets and adjustable helmets. Pediatric neurology and orthotic devices are also integral components of the market, as they offer conservative management options for patients with positional plagiocephaly.
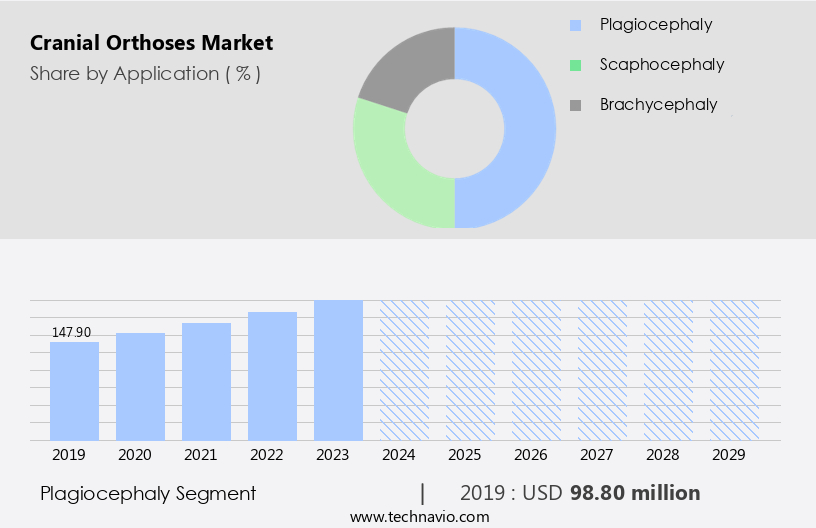
The Plagiocephaly segment was valued at USD 98.80 million in 2019 and showed a gradual increase during the forecast period.
Regional Analysis
North America is estimated to contribute 41% to the growth of the global market during the forecast period. Technavio's analysts have elaborately explained the regional trends and drivers that shape the market during the forecast period.
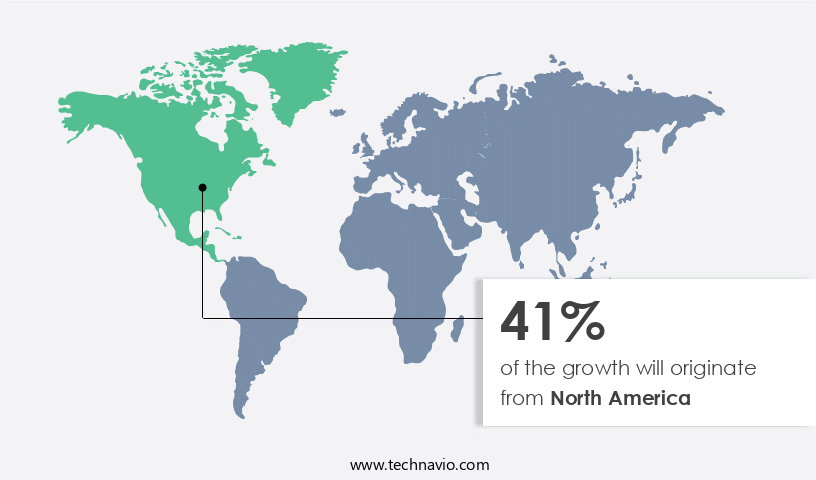
Cranial orthoses, including custom-fitted helmets, play a crucial role in addressing conditions resulting from irregular head shapes in infants. These conditions, such as positional plagiocephaly, can be caused by various factors, including head circumference discrepancies and intrauterine constraints. In the US, the Centers for Disease Control and Prevention (CDC) reported a birth rate of 11 per 1,000 population in 2023, resulting in 3,667,758 births. With high birth rates, particularly those involving multiple births and premature infants, the demand for cranial orthoses is increasing. Healthcare professionals rely on these devices to ensure proper head development and maintain safety standards.
Manufacturing processes for custom-fitted helmets incorporate computer-aided design, 3D scanning, and adjustable straps to provide optimal comfort and fit. Clinical studies have demonstrated the effectiveness of helmet therapy in improving patient satisfaction and long-term outcomes. The cost of treatment and helmet lifespan are essential factors influencing market dynamics. Insurance coverage and supply chain management also play a significant role in the affordability and accessibility of these devices. Adherence to medical device regulations and quality control measures ensures the safety and efficacy of cranial orthoses. Aside from cranial molding helmets, adjustable helmets and orthotic devices are alternative treatments for positional plagiocephaly.
Pediatric neurology professionals may recommend conservative management, such as physical therapy, in conjunction with helmet usage. The evolving market trends include the development of lightweight materials, ventilation systems, and positional monitoring technologies to enhance patient comfort and compliance.
Market Dynamics
Our researchers analyzed the data with 2024 as the base year, along with the key drivers, trends, and challenges. A holistic analysis of drivers will help companies refine their marketing strategies to gain a competitive advantage.
What are the Cranial Orthoses market drivers leading to the rise in the adoption of Industry?
- The significant rise in the prevalence of cranial deformities serves as the primary market driver. Cranial orthoses, custom-fitted helmets designed to correct head shape anomalies such as plagiocephaly and brachycephaly in infants, have gained significance in healthcare. These conditions result from constant pressure on an infant's head during growth, leading to the development of abnormal head shapes. Plagiocephaly, the most common condition, causes the head to become flattened on one side, while brachycephaly results in a widened head due to the flattening of the back. According to the National Health Service (NHS), approximately one in every five infants experiences these conditions at some point in their infancy. Healthcare professionals recommend cranial orthoses to ensure proper head development.
- Helmet safety standards ensure the devices provide adequate comfort and fit. Customization, including head circumference measurements and individualized manufacturing processes, ensures optimal comfort and fit. Clinical studies demonstrate the effectiveness of these helmets in correcting head shape anomalies. The cost of treatment and helmet lifespan are essential factors for parents considering cranial orthoses. Comfort and fit are crucial for ensuring consistent use, which is essential for effective treatment. Properly fitted helmets contribute to infant development and alleviate potential developmental issues associated with abnormal head shapes.
What are the Cranial Orthoses market trends shaping the Industry?
- The use of 3D scanning technology is currently gaining significant traction in the production of cranial orthoses, representing a notable market trend in this field. This advanced technique enables more precise and customized fabrication of these medical devices, resulting in improved patient comfort and outcomes. The market is experiencing significant growth due to technological advancements, particularly in the use of 3D scanning technology. This innovative approach offers increased accuracy and productivity in creating customized orthotic devices for patients, compared to traditional plaster molds. For instance, Vorum Research Corp.'s Spectra is a 3D optical handheld scanner that captures accurate 3D data of an infant's head shape using blue light technology. This affordable and efficient solution contributes to the market's expansion. Patient satisfaction is a crucial factor driving the market's growth, as cranial orthoses effectively address conditions such as positional plagiocephaly. Physical therapy and adjustable straps are essential features that enhance the effectiveness of these medical devices.
- Insurance coverage and supply chain management are also essential aspects of the market, ensuring timely and cost-effective delivery of cranial orthoses to patients. Quality control and medical device regulations are essential considerations to ensure the safety and efficacy of cranial orthoses. Treatment duration and helmet compliance are also essential factors influencing the market's growth, as prolonged usage and high patient compliance lead to better outcomes. Overall, the market is poised for continued growth, driven by technological advancements, patient needs, and regulatory requirements.
How does Cranial Orthoses market faces challenges face during its growth?
- The growth of the cranial orthoses industry is significantly influenced by the limited availability of alternative methods, serving as a key challenge in this sector. Cranial orthoses, including cranial molding helmets and adjustable helmets, are orthotic devices used to correct or prevent abnormal head shapes in infants. These conditions, such as plagiocephaly and brachycephaly, can result from various factors, including in-utero positioning, premature birth, and muscle imbalances. While physical therapy, tummy time, and repositioning techniques are alternative treatments for these conditions, cranial orthoses offer long-term outcomes. Post-treatment monitoring is crucial to ensure the effectiveness of cranial orthoses. Parents are instructed on proper helmet maintenance to ensure the device remains effective. The use of computer-aided design in the manufacturing process ensures a precise fit for each infant.
- Surgical intervention is typically considered a last resort for severe cases of craniosynostosis, a condition where the skull bones fuse prematurely. Cranial molding helmets and adjustable helmets are often the preferred conservative management options. In pediatric neurology, cranial orthoses play a significant role in addressing abnormal head shapes. These devices provide a supportive and corrective environment for the infant's developing head, allowing for optimal growth and development. Parents should work closely with their healthcare providers to determine the best treatment approach for their child. Cranial orthoses offer a safe and effective solution for correcting and preventing abnormal head shapes, providing long-term benefits for the child's overall health and development.
Exclusive Customer Landscape
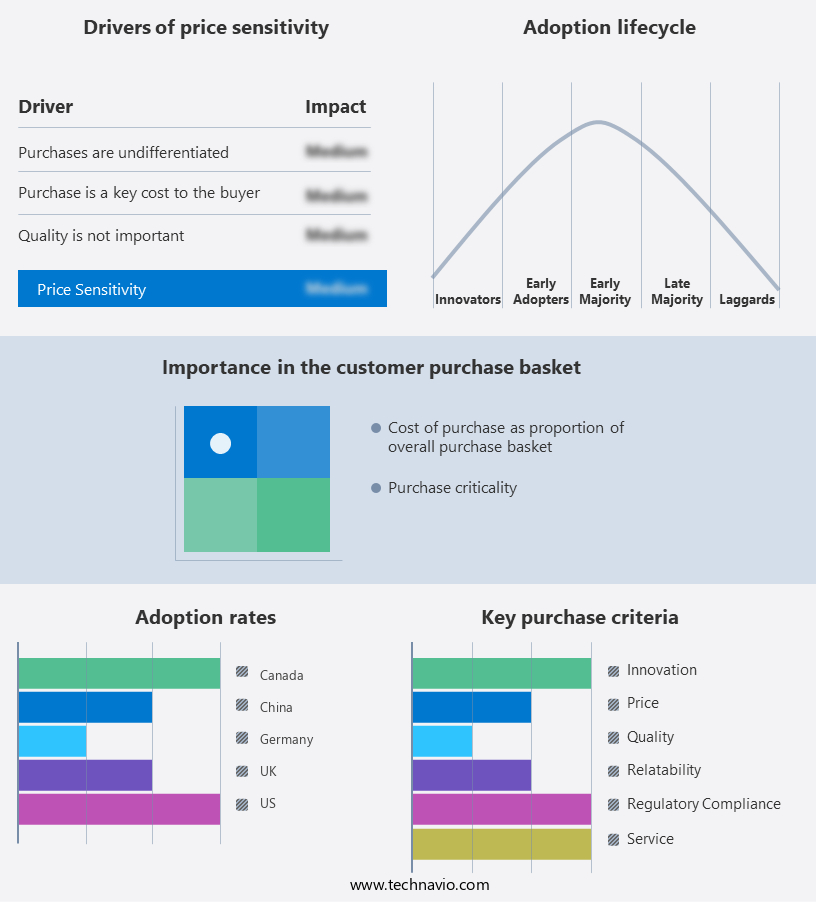
The cranial orthoses market forecasting report includes the adoption lifecycle of the market, covering from the innovator's stage to the laggard's stage. It focuses on adoption rates in different regions based on penetration. Furthermore, the cranial orthoses market report also includes key purchase criteria and drivers of price sensitivity to help companies evaluate and develop their market growth analysis strategies.
Customer Landscape
Key Companies & Market Insights
Companies are implementing various strategies, such as strategic alliances, cranial orthoses market forecast, partnerships, mergers and acquisitions, geographical expansion, and product/service launches, to enhance their presence in the industry.
Align Clinic - The company offers cranial orthoses to treat Plagiocephaly, Brachycephaly, and Scaphycephaly in babies.
The industry research and growth report includes detailed analyses of the competitive landscape of the market and information about key companies, including:
- Align Clinic
- ARMAC
- Becker Orthopedic
- Bio Medic Appliances Inc.
- BioSculptor
- Boston Orthotics and Prosthetics
- Cranial Technologies Inc.
- Danmar Products Inc
- Deccan OrthoPro
- Hanger Inc.
- Human Designs Prosthetics and Orthotics
- Invent Medical Group s.r.o
- Lawall Prosthetic and Orthotic Services Inc
- Leimkuehler Inc.
- Medicad Implants
- Orthomerica Products Inc.
- Orthotic and Prosthetic Lab Inc
- Union Orthotics and Prosthetics Co
- Westcoast Brace and Limb
Qualitative and quantitative analysis of companies has been conducted to help clients understand the wider business environment as well as the strengths and weaknesses of key industry players. Data is qualitatively analyzed to categorize companies as pure play, category-focused, industry-focused, and diversified; it is quantitatively analyzed to categorize companies as dominant, leading, strong, tentative, and weak.
Recent Development and News in Cranial Orthoses Market
- In Q1 2024, Smith & Nephew, a leading global medical technology business, announced the launch of its new cranial orthosis, the SOLRAS Cranial System. This innovative product offers advanced features such as a lightweight design, improved patient comfort, and enhanced clinical functionality, making it a preferred choice for healthcare professionals and patients alike (Smith & Nephew Press Release, 2024).
- In H2 2024, Medtronic plc, a renowned medical technology company, entered into a strategic collaboration with 3D Systems, a leading provider of 3D printing technologies, to develop and commercialize 3D-printed cranial orthoses. This partnership is expected to revolutionize the production process of cranial orthoses, enabling faster turnaround times and more customized solutions for patients (Medtronic Press Release, 2024).
- In Q3 2025, Stryker Corporation, a leading medical technology company, completed the acquisition of K2M Group Holdings, Inc., a global leader in complex spine and cranial technologies. This acquisition significantly expanded Stryker's cranial orthoses portfolio, enabling the company to offer a more comprehensive range of products and services to its customers (Stryker Corporation Press Release, 2025).
- In Q4 2025, DJO Global, a global provider of medical devices, announced the expansion of its cranial orthoses business into the European market. The company opened a new facility in Germany, which will serve as a manufacturing and distribution hub for its cranial orthoses products, enabling it to cater to the growing demand for these devices in Europe (DJO Global Press Release, 2025).
Research Analyst Overview
The market is characterized by a continuous evolution in response to the growing demand for effective solutions to address various craniofacial conditions. One of the key areas of focus in this market is the development of advanced technologies to improve helmet efficacy and patient comfort. Head asymmetry, a common condition in infants, has been a significant driver for the growth of the market. The use of cranial orthoses, such as helmets, has become an essential part of early intervention strategies to correct skull deformation and prevent potential developmental issues. Manufacturers are investing heavily in research and development to enhance helmet therapy through the use of lightweight materials, advanced ventilation systems, and custom-fitted designs.
Helmet removal and replacement processes are also being streamlined through the adoption of 3D scanning technology and CAD/CAM processes, ensuring a more precise and efficient manufacturing process. Healthcare professionals are increasingly relying on clinical studies to assess helmet safety standards and long-term outcomes. These studies are providing valuable insights into the effectiveness of helmet therapy, health insurance, and contributing to the development of new treatment protocols and guidelines. The use of adjustable straps and helmet compliance are crucial factors in ensuring the success of helmet therapy. Manufacturers are addressing these concerns by incorporating adjustable straps into their designs and implementing rigorous quality control measures to ensure the helmets fit properly and are comfortable for patients.
The cost of treatment and insurance coverage are also important considerations in the market. As the use of cranial orthoses becomes more widespread, there is a growing need for effective supply chain management and treatment duration strategies to ensure affordable and accessible care for patients. The market for cranial orthoses is also witnessing the emergence of alternative treatments and conservative management options. Prosthetics and orthotics and physical therapy are becoming increasingly popular as complementary treatments for craniofacial conditions. Medical device regulations continue to play a significant role in shaping the market. Manufacturers must adhere to strict safety and efficacy standards to ensure the quality and safety of their products.
The market is a dynamic and evolving landscape, driven by the ongoing need to address the complexities of craniofacial conditions. The use of advanced technologies, clinical studies, and a focus on patient comfort and satisfaction are key factors shaping the future of this market.
Dive into Technavio's robust research methodology, blending expert interviews, extensive data synthesis, and validated models for unparalleled Cranial Orthoses Market insights. See full methodology.
|
Market Scope |
|
|
Report Coverage |
Details |
|
Page number |
215 |
|
Base year |
2024 |
|
Historic period |
2019-2023 |
|
Forecast period |
2025-2029 |
|
Growth momentum & CAGR |
Accelerate at a CAGR of 11.7% |
|
Market growth 2025-2029 |
USD 217.5 million |
|
Market structure |
Fragmented |
|
YoY growth 2024-2025(%) |
10.1 |
|
Key countries |
US, Germany, Canada, China, Japan, UK, France, India, Italy, and South Korea |
|
Competitive landscape |
Leading Companies, Market Positioning of Companies, Competitive Strategies, and Industry Risks |
What are the Key Data Covered in this Cranial Orthoses Market Research and Growth Report?
- CAGR of the Cranial Orthoses industry during the forecast period
- Detailed information on factors that will drive the growth and forecasting between 2025 and 2029
- Precise estimation of the size of the market and its contribution of the industry in focus to the parent market
- Accurate predictions about upcoming growth and trends and changes in consumer behaviour
- Growth of the market across North America, Europe, Asia, and Rest of World (ROW)
- Thorough analysis of the market's competitive landscape and detailed information about companies
- Comprehensive analysis of factors that will challenge the cranial orthoses market growth of industry companies
We can help! Our analysts can customize this cranial orthoses market research report to meet your requirements.
 RIA -
RIA - 
