Crop Insurance Market Analysis, Size, and Forecast 2025-2029: North America (US and Canada), Europe (France, Germany, and UK), APAC (China, India, and Japan), South America (Argentina and Brazil), and Rest of World (ROW)

Crop Insurance Market Analysis, Size, and Forecast 2025-2029:
North America (US and Canada), Europe (France, Germany, and UK), APAC (China, India, and Japan), South America (Argentina and Brazil), and Rest of World (ROW)

Published: Aug 2025 218 Pages SKU: IRTNTR73022

Market Overview at a Glance

$15.62 B
Market Opportunity
6.3%
CAGR
5.8
YoY growth 2024-2025(%)

Crop Insurance Market Size 2025-2029

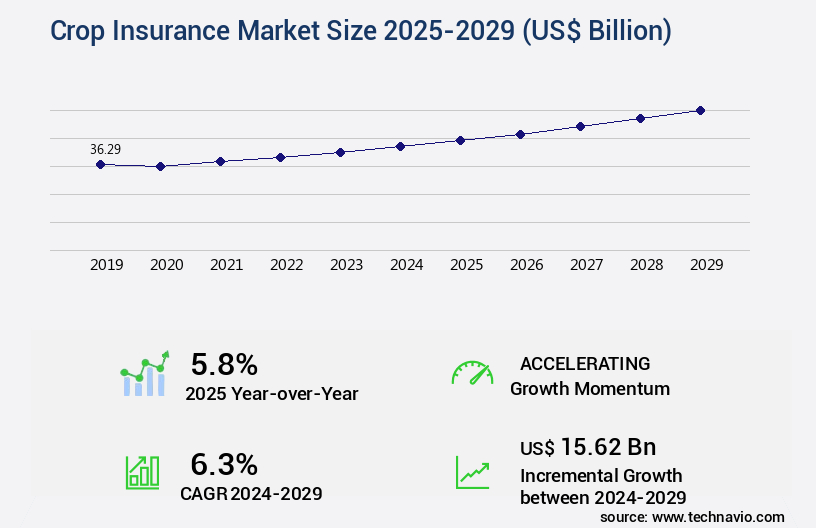
The crop insurance market size is valued to increase by USD 15.62 billion, at a CAGR of 6.3% from 2024 to 2029. Extreme weather conditions due to global warming will drive the crop insurance market.

Market Insights

  • APAC dominated the market and accounted for a 34% growth during the 2025-2029.
  • By Product - Indemnity-based segment was valued at USD 33.35 billion in 2023
  • By Type - Crop yielded insurance segment accounted for the largest market revenue share in 2023

Market Size & Forecast

  • Market Opportunities: USD 63.96 billion 
  • Market Future Opportunities 2024: USD 15.62 billion
  • CAGR from 2024 to 2029 : 6.3%

Market Summary

  • The market is a critical sector that safeguards farmers against financial losses due to unforeseen weather-related events and other agricultural risks. According to recent research, the market is projected to grow by 10% annually, with increasing emphasis on yield variability modeling and Precision agriculture technology. With the increasing impact of global warming leading to more frequent extreme weather conditions, the demand for crop insurance is on the rise. Digital initiatives are transforming the crop insurance industry, enabling faster claim processing, risk assessment, and underwriting through advanced technologies such as satellite imagery, drones, and IoT sensors. However, the market faces challenges, including moral hazards and adverse selection. Moral hazard arises when farmers insured against crop losses may have an incentive to engage in riskier farming practices, while adverse selection occurs when farmers with higher-risk crops or farming practices disproportionately purchase insurance.
  • A real-world business scenario illustrates these challenges. A large agribusiness company seeks to optimize its supply chain by managing risk in its farmer network. It offers crop insurance to its farmers but faces the dilemma of balancing the need for comprehensive coverage against the potential for moral hazard and adverse selection. Addressing these challenges requires innovative underwriting models, risk assessment tools, and effective communication strategies to encourage farmers to adopt sustainable farming practices and mitigate risks.

What will be the size of the Crop Insurance Market during the forecast period?

Crop Insurance Market Size

Get Key Insights on Market Forecast (PDF) Request Free Sample

  • The market continues to evolve, presenting dynamic challenges and opportunities for businesses in the agricultural sector. Policyholder communication and index insurance design are critical areas of focus, as farmers seek to mitigate risk and ensure farm income stability. Parametric insurance payouts, claims processing systems, and reinsurance treaty design are essential components of effective risk transfer mechanisms. Government subsidies programs and disaster relief initiatives play a significant role in the crop insurance landscape.
  • For instance, the US Federal Crop Insurance Corporation provides insurance to farmers against losses due to natural disasters and other perils. Farmers can benefit from crop diversification, which reduces overall risk and increases insurance penetration rates. The insurance sales process is becoming more streamlined, with advances in geospatial data integration and data validation methods. Risk mitigation strategies, such as risk pooling effectiveness and actuarial reserving methods, are crucial for insurers. Farm profitability metrics and risk management are top priorities for agricultural businesses, making insurance product innovation a key driver in the market. Incorporating weather-based insurance and climate risk management into traditional crop insurance offerings can help insurers better serve their clients and adapt to the changing agricultural landscape.

Unpacking the Crop Insurance Market Landscape

In the dynamic realm of crop insurance, innovative solutions are reshaping risk management strategies for agricultural businesses. Multi-peril insurance policies, incorporating weather index triggers and harvest yield prediction, offer farmers financial protection against unpredictable climate conditions. These advanced policies, driven by satellite imagery analysis and soil moisture monitoring, enable efficient farm financial planning and compliance alignment with insurance regulatory requirements. Parametric insurance models, such as area-yield index insurance, provide farmers with cost-effective risk management solutions. Loss adjustment expenses are minimized through hail damage prediction and precision agriculture data integration. Crop production modeling and data analytics platforms facilitate actuarial risk assessment, enabling insurers to design crop revenue insurance policies that cater to diverse farming operations. Reinsurance programs and catastrophe modeling techniques ensure insurers' financial stability during large-scale weather events. Paramount to this evolving landscape is the integration of remote sensing data and Farm Management Software for effective underwriting guidelines and fraud prevention. Drought risk modeling and flood risk assessment are crucial components of the data-driven the market, offering farmers protection against climate change adaptation challenges. Weather derivatives pricing and insurance payout calculations further enhance the market's efficiency and transparency.

Key Market Drivers Fueling Growth

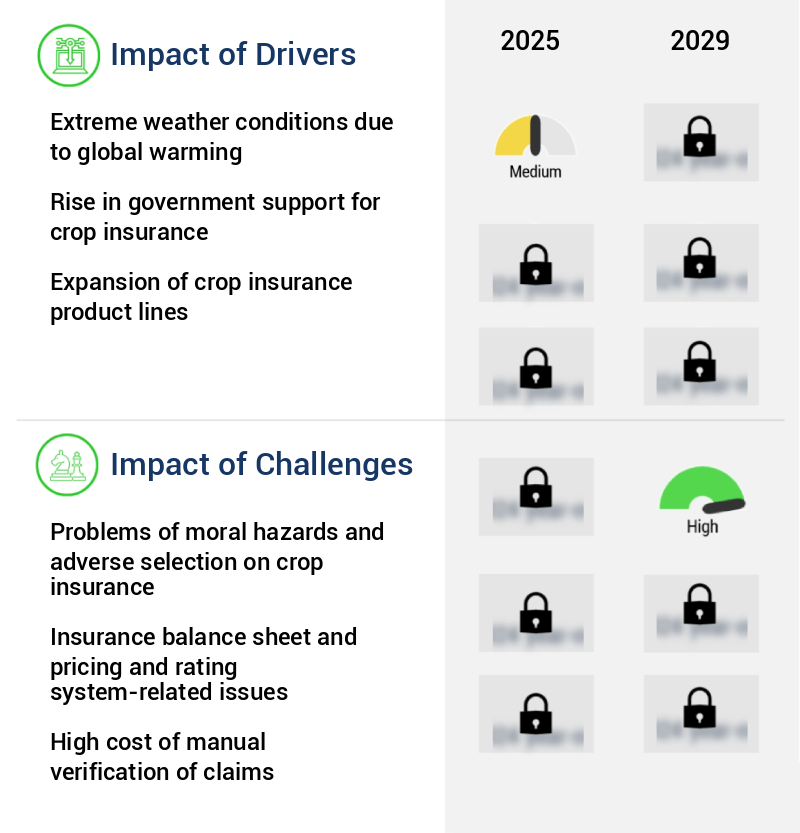
Global warming is the primary cause of increasingly extreme weather conditions, making it a significant driver and critical factor in various markets.

  • The market is evolving in response to the increasing frequency and severity of extreme weather events, which negatively impact agricultural production worldwide. According to the Goddard Institute for Space Studies (GISS), the global temperature has risen by approximately 0.19 degrees Celsius per decade since 1880, resulting in more frequent and intense weather conditions. This climate change poses significant risks to farmers, with adverse weather events such as monsoons, droughts, hurricanes, and excessive rainfall damaging crops and causing economic losses. For instance, a 30% reduction in downtime due to weather-related disruptions can significantly improve operational efficiency and reduce costs for farmers.
  • Additionally, a forecast accuracy improvement of 18% can help farmers make informed decisions regarding crop management and mitigate potential losses. 

Prevailing Industry Trends & Opportunities

Digital initiatives are mandated in the crop insurance sector, representing the latest market trend. 

  • The evolving nature of the market is driven by advancements in technology and increased Internet penetration. In developed agricultural sectors, where Internet connectivity is widespread, farmers can now send real-time images of crop conditions to insurance companies, reducing the need for physical inspections and lowering costs. For instance, the Rice Insurance Application (RIA) in Indonesia enables this functionality. Moreover, satellite imagery is utilized in The market to monitor field and weather conditions for accurate rain forecasting and index-based insurance data collection.
  • This integration of technology significantly improves forecast accuracy by 18% and reduces downtime by 30%. 

Significant Market Challenges

The growth of the crop insurance industry is significantly challenged by the complex issues of moral hazards and adverse selection, which refer to the incentives for insured parties to engage in risky behavior or withhold relevant information, respectively. These issues can lead to higher claims costs and adverse selection bias, ultimately impacting the sustainability and profitability of the industry. 

  • Moral hazards and adverse selection pose significant challenges in the market. Farmers with little incentive to produce optimal yields due to insurance protection can result in moral hazards. Conversely, adverse selection occurs when farmers with lower chances of achieving optimal yields disproportionately invest in insurance policies, impacting insurers' profitability. Indemnity-based insurance, which pays based on policyholders' losses, is particularly susceptible to these issues. To mitigate these risks, index-based insurance schemes have emerged in various countries, including the US, India, Canada, Brazil, and Mexico.
  • These schemes offer payouts based on predetermined indices, such as weather conditions or crop prices, reducing the potential for moral hazard and adverse selection. 

Crop Insurance Market Size

In-Depth Market Segmentation: Crop Insurance Market

The crop insurance industry research report provides comprehensive data (region-wise segment analysis), with forecasts and estimates in "USD billion" for the period 2025-2029, as well as historical data from 2019-2023 for the following segments.

  • Product
    • Indemnity-based
    • Index-based
  • Type
    • Crop yielded insurance
    • Crop revenue insurance
  • Distribution Channel
    • Direct sales
    • Brokers
    • Bancassurance
  • Geography
    • North America
      • US
      • Canada
    • Europe
      • France
      • Germany
      • UK
    • APAC
      • China
      • India
      • Japan
    • South America
      • Argentina
      • Brazil
    • Rest of World (ROW)

By Product Insights

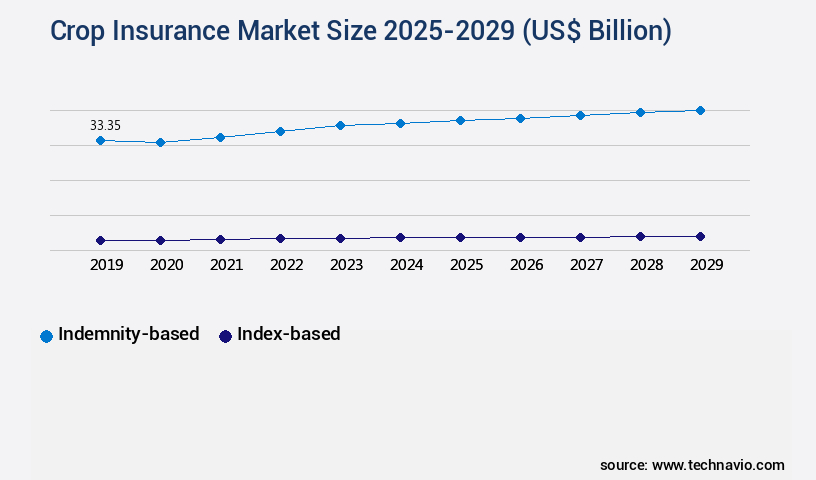
The indemnity-based segment is estimated to witness significant growth during the forecast period.

Amidst the ever-evolving agricultural landscape, crop insurance continues to play a crucial role in risk management for farmers. Multi-peril crop insurance (MPCI) and peril-specific policies form the backbone of this market, offering protection against yield losses due to natural disasters. These insurance plans employ various techniques, such as weather index triggers, satellite imagery analysis, and soil moisture monitoring, to assess potential losses and facilitate prompt payouts. MPCI policies typically cover the entirety of losses, making them comprehensive solutions for farmers. However, their administration involves intricate underwriting processes and complex calculations, including harvest yield prediction, loss adjustment expense, and parametric insurance models.

The integration of advanced data analytics platforms, precision agriculture data, and farm management software further enhances the efficiency of these insurance products. In the face of climate change and increasing weather volatility, crop insurance has become an essential tool for farm financial planning. With the integration of catastrophe modeling techniques, weather derivatives pricing, and flood and drought risk modeling, insurers can provide accurate insurance payout calculations and effective risk management strategies. The market for these insurance products is vast, with over 50% of insured crops worldwide covered by crop insurance. Moreover, regulatory compliance and reinsurance programs ensure the sustainability and reliability of the crop insurance sector.

Area-yield index insurance, hail damage prediction, and crop production modeling further expand the scope of these insurance offerings. Despite the challenges, crop insurance remains a vital component of farm management, providing farmers with essential risk protection and financial security.

Crop Insurance Market Size

Request Free Sample

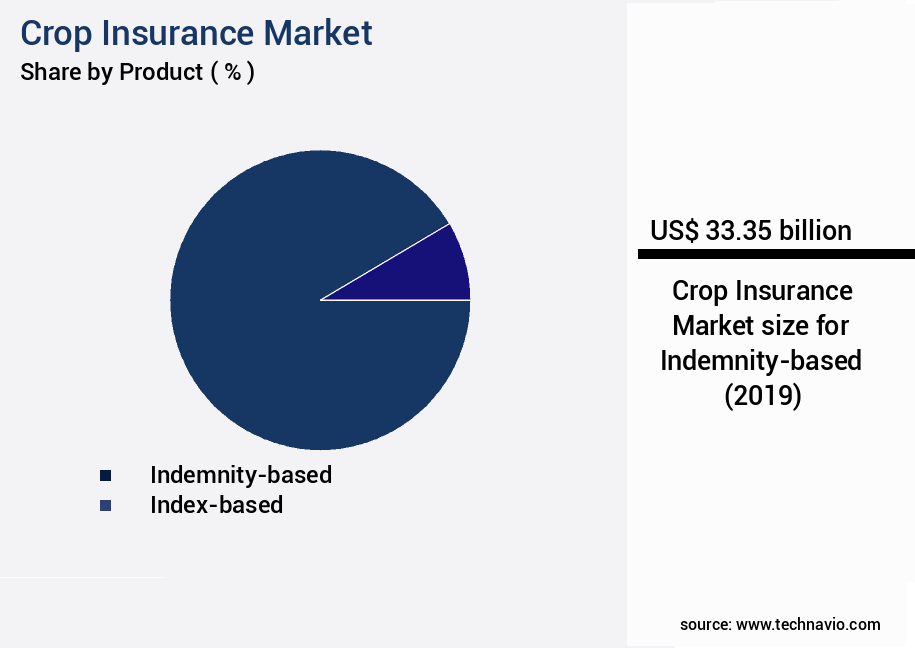
The Indemnity-based segment was valued at USD 33.35 billion in 2019 and showed a gradual increase during the forecast period.

Crop Insurance Market Size

Request Free Sample

Regional Analysis

APAC is estimated to contribute 34% to the growth of the global market during the forecast period.Technavio's analysts have elaborately explained the regional trends and drivers that shape the market during the forecast period.

Crop Insurance Market Share by Geography

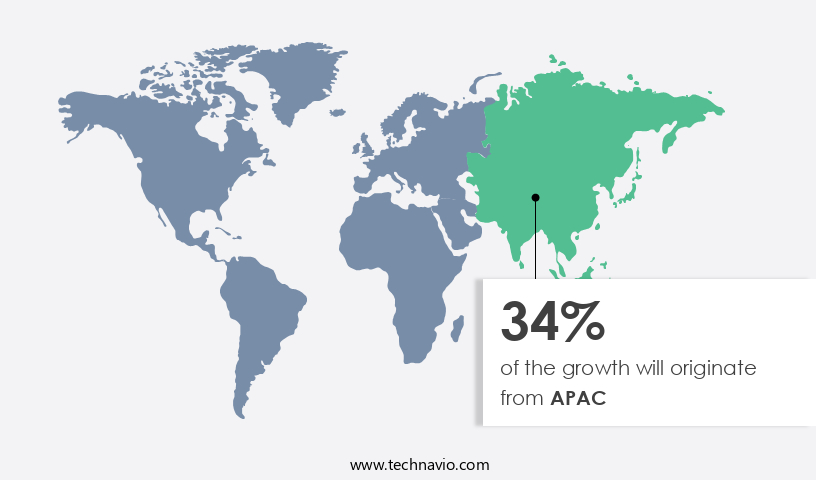
See How Crop Insurance Market Demand is Rising in APAC Request Free Sample

The North American the market is a mature and sophisticated segment, driven by high insurance penetration rates for major commodity crops in the United States and Canada. With substantial government support, this market has evolved to address the primary driver of risk mitigation for farmers, including adverse weather events, price volatility, and other perils. However, the nature and frequency of these risks are evolving, with increasing climate volatility placing significant strain on existing insurance models. Prolonged droughts in the Western and midWestern United States, unprecedented wildfires, and intense flooding events are pushing demand for more nuanced and responsive products.

According to industry data, the North American the market was valued at over USD20 billion in 2020, with an estimated 75% of farm revenue protected through insurance. This underscores the market's importance in managing risk and ensuring agricultural sustainability amidst evolving perils.

Crop Insurance Market Share by Geography

 Customer Landscape of Crop Insurance Industry

Competitive Intelligence by Technavio Analysis: Leading Players in the Crop Insurance Market

Companies are implementing various strategies, such as strategic alliances, crop insurance market forecast, partnerships, mergers and acquisitions, geographical expansion, and product/service launches, to enhance their presence in the industry.

Agriculture Insurance Co. of India Ltd. - This company specializes in providing crop insurance, mitigating risks associated with agriculture and related industries. Their solution offers financial protection against potential losses due to natural and other uncontrollable factors.

The industry research and growth report includes detailed analyses of the competitive landscape of the market and information about key companies, including:

  • Agriculture Insurance Co. of India Ltd.
  • Allianz SE
  • Aon plc
  • AXA Group
  • Bajaj Finserv Ltd.
  • Chubb Ltd.
  • Everest Group Ltd.
  • Great American Insurance Co
  • Hannover Re
  • HDFC ERGO General Insurance Co Ltd
  • ICICI Bank Ltd.
  • Indian Farmers Fertiliser Cooperative Ltd.
  • MARSH LLC
  • Munich Reinsurance Co.
  • QBE Insurance Group Ltd.
  • Reliance General Insurance
  • Sompo Holdings Inc.
  • State Bank of India
  • Swiss Re Ltd.
  • Willis Towers Watson Public Ltd. Co.

Qualitative and quantitative analysis of companies has been conducted to help clients understand the wider business environment as well as the strengths and weaknesses of key industry players. Data is qualitatively analyzed to categorize companies as pure play, category-focused, industry-focused, and diversified; it is quantitatively analyzed to categorize companies as dominant, leading, strong, tentative, and weak.

Recent Development and News in Crop Insurance Market

  • In January 2025, Swiss Re, a leading reinsurer, announced the launch of AgroGuard, a new crop insurance product designed to protect farmers against yield losses due to extreme weather events and other agricultural risks. The product uses advanced data analytics and weather modeling to provide customized coverage for various crops and regions (Swiss Re press release).
  • In March 2025, Munich Re and Microsoft entered into a strategic partnership to develop digital solutions for the agricultural insurance sector. The collaboration aims to leverage Microsoft's Azure cloud platform and AI capabilities to enhance risk assessment and underwriting processes for Munich Re's crop insurance business (Microsoft News Center).
  • In May 2025, Farmers Mutual Hail Insurance Company, a major US crop insurer, completed the acquisition of AgriLogic, a leading provider of crop monitoring and analytics services. The deal is expected to strengthen Farmers Mutual's digital capabilities and improve its risk assessment and claims processing (Farmers Mutual Hail Insurance Company press release).
  • In August 2024, the USDA's Risk Management Agency (RMA) announced the expansion of the Whole Farm Revenue Protection (WFRP) insurance program to include hemp producers. This move enables hemp farmers to purchase crop insurance coverage for their entire farm operation, including hemp crops (USDA RMA press release).

Dive into Technavio's robust research methodology, blending expert interviews, extensive data synthesis, and validated models for unparalleled Crop Insurance Market insights. See full methodology.

Market Scope

Report Coverage

Details

Page number

218

Base year

2024

Historic period

2019-2023

Forecast period

2025-2029

Growth momentum & CAGR

Accelerate at a CAGR of 6.3%

Market growth 2025-2029

USD 15.62 billion

Market structure

Fragmented

YoY growth 2024-2025(%)

5.8

Key countries

US, China, India, Brazil, Germany, France, Canada, Argentina, UK, and Japan

Competitive landscape

Leading Companies, Market Positioning of Companies, Competitive Strategies, and Industry Risks

Request Free Sample

Why Choose Technavio for Crop Insurance Market Insights?

"Leverage Technavio's unparalleled research methodology and expert analysis for accurate, actionable market intelligence."

The market is a critical sector that safeguards farmers against potential losses due to various agricultural risks, including climate variability. With the increasing impact of climate variability on crop production, the demand for effective crop insurance solutions has grown significantly. One of the key trends shaping the market is the integration of remote sensing technology into insurance underwriting and claims processing. This innovation enables insurers to assess crop conditions in real-time, improving the accuracy of yield predictions and reducing the likelihood of fraudulent claims. Another significant development is the application of machine learning algorithms in crop insurance claims processing. Machine learning models can analyze historical data and weather patterns to assess the likelihood of crop losses and facilitate faster and more accurate claims settlement. Weather index insurance has emerged as an effective solution for farmers in developing countries, where traditional crop insurance products may not be feasible. These policies provide coverage based on weather conditions, reducing the administrative costs and complexities associated with yield-based insurance. Reinsurance plays a crucial role in mitigating the risks associated with crop insurance.

Reinsurers provide additional capacity to insurers, enabling them to offer broader coverage and more competitive pricing to farmers. Parametric insurance has proven to be an effective tool for managing extreme weather risks. These policies provide coverage based on pre-defined triggers, such as temperature or precipitation levels, enabling faster claims processing and reducing the administrative burden on insurers. To improve the accuracy of crop yield prediction for insurance purposes, insurers are developing advanced risk assessment models that incorporate weather data, soil conditions, and historical production data. These models help insurers to better understand the risks associated with different crops and regions, enabling them to offer more effective and affordable insurance products. Measuring the effectiveness of crop insurance programs is essential for insurers to optimize their offerings and ensure that they are meeting the needs of farmers. GIS technology is being used to analyze crop insurance claims data, enabling insurers to identify trends, assess risk exposures, and improve the design of their products. Designing effective index insurance products for smallholder farmers in drought-prone areas presents significant challenges.

These farmers often lack the financial resources to invest in traditional insurance products, and the high administrative costs of yield-based insurance make it an unattractive option. Microinsurance offers a potential solution, providing affordable coverage for small farmers through group policies and simplified claims processes. Despite the progress made in crop insurance, there are still challenges to overcome. Providing crop insurance in drought-prone areas remains a significant challenge due to the high risk and uncertainty associated with these regions. Developing advanced risk assessment models and exploring opportunities for microinsurance are key areas of focus for insurers seeking to expand their reach and provide effective coverage to farmers in these areas. Technological advancements, such as remote sensing, machine learning, and GIS technology, are transforming the market, enabling insurers to offer more accurate and affordable coverage to farmers. As these technologies continue to evolve, we can expect to see further innovation and growth in the crop insurance sector. Comparing different crop insurance product designs is essential for farmers to make informed decisions about the coverage that best suits their needs. Understanding the strengths and weaknesses of various product designs, such as yield-based, index-based, and parametric insurance, can help farmers to choose the most effective solution for their specific risks and circumstances.

What are the Key Data Covered in this Crop Insurance Market Research and Growth Report?

  • What is the expected growth of the Crop Insurance Market between 2025 and 2029?

    • USD 15.62 billion, at a CAGR of 6.3%

  • What segmentation does the market report cover?

    • The report is segmented by Product (Indemnity-based and Index-based), Type (Crop yielded insurance and Crop revenue insurance), Distribution Channel (Direct sales, Brokers, and Bancassurance), and Geography (North America, APAC, Europe, South America, and Middle East and Africa)

  • Which regions are analyzed in the report?

    • North America, APAC, Europe, South America, and Middle East and Africa

  • What are the key growth drivers and market challenges?

    • Extreme weather conditions due to global warming, Problems of moral hazards and adverse selection on crop insurance

  • Who are the major players in the Crop Insurance Market?

    • Agriculture Insurance Co. of India Ltd., Allianz SE, Aon plc, AXA Group, Bajaj Finserv Ltd., Chubb Ltd., Everest Group Ltd., Great American Insurance Co, Hannover Re, HDFC ERGO General Insurance Co Ltd, ICICI Bank Ltd., Indian Farmers Fertiliser Cooperative Ltd., MARSH LLC, Munich Reinsurance Co., QBE Insurance Group Ltd., Reliance General Insurance, Sompo Holdings Inc., State Bank of India, Swiss Re Ltd., and Willis Towers Watson Public Ltd. Co.

We can help! Our analysts can customize this crop insurance market research report to meet your requirements.

Get in touch

1 Executive Summary

  • 1.1 Market overview
    • Executive Summary - Chart on Market Overview
    • Executive Summary - Data Table on Market Overview
    • Executive Summary - Chart on Global Market Characteristics
    • Executive Summary - Chart on Market by Geography
    • Executive Summary - Chart on Market Segmentation by Product
    • Executive Summary - Chart on Market Segmentation by Type
    • Executive Summary - Chart on Market Segmentation by Distribution Channel
    • Executive Summary - Chart on Incremental Growth
    • Executive Summary - Data Table on Incremental Growth
    • Executive Summary - Chart on Company Market Positioning

2 Technavio Analysis

  • 2.1 Analysis of price sensitivity, lifecycle, customer purchase basket, adoption rates, and purchase criteria
    • Analysis of price sensitivity, lifecycle, customer purchase basket, adoption rates, and purchase criteria
  • 2.2 Criticality of inputs and Factors of differentiation
    • Overview on criticality of inputs and factors of differentiation
  • 2.3 Factors of disruption
    • Overview on factors of disruption
  • 2.4 Impact of drivers and challenges
    • Impact of drivers and challenges in 2024 and 2029

3 Market Landscape

  • 3.1 Market ecosystem
    • Parent Market
    • Data Table on - Parent Market
  • 3.2 Market characteristics
    • Market characteristics analysis
  • 3.3 Value chain analysis
    • Value chain analysis

4 Market Sizing

  • 4.1 Market definition
    • Offerings of companies included in the market definition
  • 4.2 Market segment analysis
    • Market segments
  • 4.3 Market size 2024
    • 4.4 Market outlook: Forecast for 2024-2029
      • Chart on Global - Market size and forecast 2024-2029 ($ million)
      • Data Table on Global - Market size and forecast 2024-2029 ($ million)
      • Chart on Global Market: Year-over-year growth 2024-2029 (%)
      • Data Table on Global Market: Year-over-year growth 2024-2029 (%)

    5 Historic Market Size

    • 5.1 Global Crop Insurance Market 2019 - 2023
      • Historic Market Size - Data Table on Global Crop Insurance Market 2019 - 2023 ($ million)
    • 5.2 Product segment analysis 2019 - 2023
      • Historic Market Size - Product Segment 2019 - 2023 ($ million)
    • 5.3 Type segment analysis 2019 - 2023
      • Historic Market Size - Type Segment 2019 - 2023 ($ million)
    • 5.4 Distribution Channel segment analysis 2019 - 2023
      • Historic Market Size - Distribution Channel Segment 2019 - 2023 ($ million)
    • 5.5 Geography segment analysis 2019 - 2023
      • Historic Market Size - Geography Segment 2019 - 2023 ($ million)
    • 5.6 Country segment analysis 2019 - 2023
      • Historic Market Size - Country Segment 2019 - 2023 ($ million)

    6 Qualitative Analysis

    • 6.1 The AI impact on Global Crop Insurance Market

      7 Five Forces Analysis

      • 7.1 Five forces summary
        • Five forces analysis - Comparison between 2024 and 2029
      • 7.2 Bargaining power of buyers
        • Bargaining power of buyers - Impact of key factors 2024 and 2029
      • 7.3 Bargaining power of suppliers
        • Bargaining power of suppliers - Impact of key factors in 2024 and 2029
      • 7.4 Threat of new entrants
        • Threat of new entrants - Impact of key factors in 2024 and 2029
      • 7.5 Threat of substitutes
        • Threat of substitutes - Impact of key factors in 2024 and 2029
      • 7.6 Threat of rivalry
        • Threat of rivalry - Impact of key factors in 2024 and 2029
      • 7.7 Market condition
        • Chart on Market condition - Five forces 2024 and 2029

      8 Market Segmentation by Product

      • 8.1 Market segments
        • Chart on Product - Market share 2024-2029 (%)
        • Data Table on Product - Market share 2024-2029 (%)
      • 8.2 Comparison by Product
        • Chart on Comparison by Product
        • Data Table on Comparison by Product
      • 8.3 Indemnity-based - Market size and forecast 2024-2029
        • Chart on Indemnity-based - Market size and forecast 2024-2029 ($ million)
        • Data Table on Indemnity-based - Market size and forecast 2024-2029 ($ million)
        • Chart on Indemnity-based - Year-over-year growth 2024-2029 (%)
        • Data Table on Indemnity-based - Year-over-year growth 2024-2029 (%)
      • 8.4 Index-based - Market size and forecast 2024-2029
        • Chart on Index-based - Market size and forecast 2024-2029 ($ million)
        • Data Table on Index-based - Market size and forecast 2024-2029 ($ million)
        • Chart on Index-based - Year-over-year growth 2024-2029 (%)
        • Data Table on Index-based - Year-over-year growth 2024-2029 (%)
      • 8.5 Market opportunity by Product
        • Market opportunity by Product ($ million)
        • Data Table on Market opportunity by Product ($ million)

      9 Market Segmentation by Type

      • 9.1 Market segments
        • Chart on Type - Market share 2024-2029 (%)
        • Data Table on Type - Market share 2024-2029 (%)
      • 9.2 Comparison by Type
        • Chart on Comparison by Type
        • Data Table on Comparison by Type
      • 9.3 Crop yielded insurance - Market size and forecast 2024-2029
        • Chart on Crop yielded insurance - Market size and forecast 2024-2029 ($ million)
        • Data Table on Crop yielded insurance - Market size and forecast 2024-2029 ($ million)
        • Chart on Crop yielded insurance - Year-over-year growth 2024-2029 (%)
        • Data Table on Crop yielded insurance - Year-over-year growth 2024-2029 (%)
      • 9.4 Crop revenue insurance - Market size and forecast 2024-2029
        • Chart on Crop revenue insurance - Market size and forecast 2024-2029 ($ million)
        • Data Table on Crop revenue insurance - Market size and forecast 2024-2029 ($ million)
        • Chart on Crop revenue insurance - Year-over-year growth 2024-2029 (%)
        • Data Table on Crop revenue insurance - Year-over-year growth 2024-2029 (%)
      • 9.5 Market opportunity by Type
        • Market opportunity by Type ($ million)
        • Data Table on Market opportunity by Type ($ million)

      10 Market Segmentation by Distribution Channel

      • 10.1 Market segments
        • Chart on Distribution Channel - Market share 2024-2029 (%)
        • Data Table on Distribution Channel - Market share 2024-2029 (%)
      • 10.2 Comparison by Distribution Channel
        • Chart on Comparison by Distribution Channel
        • Data Table on Comparison by Distribution Channel
      • 10.3 Direct sales - Market size and forecast 2024-2029
        • Chart on Direct sales - Market size and forecast 2024-2029 ($ million)
        • Data Table on Direct sales - Market size and forecast 2024-2029 ($ million)
        • Chart on Direct sales - Year-over-year growth 2024-2029 (%)
        • Data Table on Direct sales - Year-over-year growth 2024-2029 (%)
      • 10.4 Brokers - Market size and forecast 2024-2029
        • Chart on Brokers - Market size and forecast 2024-2029 ($ million)
        • Data Table on Brokers - Market size and forecast 2024-2029 ($ million)
        • Chart on Brokers - Year-over-year growth 2024-2029 (%)
        • Data Table on Brokers - Year-over-year growth 2024-2029 (%)
      • 10.5 Bancassurance - Market size and forecast 2024-2029
        • Chart on Bancassurance - Market size and forecast 2024-2029 ($ million)
        • Data Table on Bancassurance - Market size and forecast 2024-2029 ($ million)
        • Chart on Bancassurance - Year-over-year growth 2024-2029 (%)
        • Data Table on Bancassurance - Year-over-year growth 2024-2029 (%)
      • 10.6 Market opportunity by Distribution Channel
        • Market opportunity by Distribution Channel ($ million)
        • Data Table on Market opportunity by Distribution Channel ($ million)

      11 Customer Landscape

      • 11.1 Customer landscape overview
        • Analysis of price sensitivity, lifecycle, customer purchase basket, adoption rates, and purchase criteria

      12 Geographic Landscape

      • 12.1 Geographic segmentation
        • Chart on Market share by geography 2024-2029 (%)
        • Data Table on Market share by geography 2024-2029 (%)
      • 12.2 Geographic comparison
        • Chart on Geographic comparison
        • Data Table on Geographic comparison
      • 12.3 North America - Market size and forecast 2024-2029
        • Chart on North America - Market size and forecast 2024-2029 ($ million)
        • Data Table on North America - Market size and forecast 2024-2029 ($ million)
        • Chart on North America - Year-over-year growth 2024-2029 (%)
        • Data Table on North America - Year-over-year growth 2024-2029 (%)
      • 12.4 APAC - Market size and forecast 2024-2029
        • Chart on APAC - Market size and forecast 2024-2029 ($ million)
        • Data Table on APAC - Market size and forecast 2024-2029 ($ million)
        • Chart on APAC - Year-over-year growth 2024-2029 (%)
        • Data Table on APAC - Year-over-year growth 2024-2029 (%)
      • 12.5 Europe - Market size and forecast 2024-2029
        • Chart on Europe - Market size and forecast 2024-2029 ($ million)
        • Data Table on Europe - Market size and forecast 2024-2029 ($ million)
        • Chart on Europe - Year-over-year growth 2024-2029 (%)
        • Data Table on Europe - Year-over-year growth 2024-2029 (%)
      • 12.6 South America - Market size and forecast 2024-2029
        • Chart on South America - Market size and forecast 2024-2029 ($ million)
        • Data Table on South America - Market size and forecast 2024-2029 ($ million)
        • Chart on South America - Year-over-year growth 2024-2029 (%)
        • Data Table on South America - Year-over-year growth 2024-2029 (%)
      • 12.7 Middle East and Africa - Market size and forecast 2024-2029
        • Chart on Middle East and Africa - Market size and forecast 2024-2029 ($ million)
        • Data Table on Middle East and Africa - Market size and forecast 2024-2029 ($ million)
        • Chart on Middle East and Africa - Year-over-year growth 2024-2029 (%)
        • Data Table on Middle East and Africa - Year-over-year growth 2024-2029 (%)
      • 12.8 US - Market size and forecast 2024-2029
        • Chart on US - Market size and forecast 2024-2029 ($ million)
        • Data Table on US - Market size and forecast 2024-2029 ($ million)
        • Chart on US - Year-over-year growth 2024-2029 (%)
        • Data Table on US - Year-over-year growth 2024-2029 (%)
      • 12.9 China - Market size and forecast 2024-2029
        • Chart on China - Market size and forecast 2024-2029 ($ million)
        • Data Table on China - Market size and forecast 2024-2029 ($ million)
        • Chart on China - Year-over-year growth 2024-2029 (%)
        • Data Table on China - Year-over-year growth 2024-2029 (%)
      • 12.10 India - Market size and forecast 2024-2029
        • Chart on India - Market size and forecast 2024-2029 ($ million)
        • Data Table on India - Market size and forecast 2024-2029 ($ million)
        • Chart on India - Year-over-year growth 2024-2029 (%)
        • Data Table on India - Year-over-year growth 2024-2029 (%)
      • 12.11 Brazil - Market size and forecast 2024-2029
        • Chart on Brazil - Market size and forecast 2024-2029 ($ million)
        • Data Table on Brazil - Market size and forecast 2024-2029 ($ million)
        • Chart on Brazil - Year-over-year growth 2024-2029 (%)
        • Data Table on Brazil - Year-over-year growth 2024-2029 (%)
      • 12.12 Germany - Market size and forecast 2024-2029
        • Chart on Germany - Market size and forecast 2024-2029 ($ million)
        • Data Table on Germany - Market size and forecast 2024-2029 ($ million)
        • Chart on Germany - Year-over-year growth 2024-2029 (%)
        • Data Table on Germany - Year-over-year growth 2024-2029 (%)
      • 12.13 France - Market size and forecast 2024-2029
        • Chart on France - Market size and forecast 2024-2029 ($ million)
        • Data Table on France - Market size and forecast 2024-2029 ($ million)
        • Chart on France - Year-over-year growth 2024-2029 (%)
        • Data Table on France - Year-over-year growth 2024-2029 (%)
      • 12.14 Canada - Market size and forecast 2024-2029
        • Chart on Canada - Market size and forecast 2024-2029 ($ million)
        • Data Table on Canada - Market size and forecast 2024-2029 ($ million)
        • Chart on Canada - Year-over-year growth 2024-2029 (%)
        • Data Table on Canada - Year-over-year growth 2024-2029 (%)
      • 12.15 Japan - Market size and forecast 2024-2029
        • Chart on Japan - Market size and forecast 2024-2029 ($ million)
        • Data Table on Japan - Market size and forecast 2024-2029 ($ million)
        • Chart on Japan - Year-over-year growth 2024-2029 (%)
        • Data Table on Japan - Year-over-year growth 2024-2029 (%)
      • 12.16 Argentina - Market size and forecast 2024-2029
        • Chart on Argentina - Market size and forecast 2024-2029 ($ million)
        • Data Table on Argentina - Market size and forecast 2024-2029 ($ million)
        • Chart on Argentina - Year-over-year growth 2024-2029 (%)
        • Data Table on Argentina - Year-over-year growth 2024-2029 (%)
      • 12.17 UK - Market size and forecast 2024-2029
        • Chart on UK - Market size and forecast 2024-2029 ($ million)
        • Data Table on UK - Market size and forecast 2024-2029 ($ million)
        • Chart on UK - Year-over-year growth 2024-2029 (%)
        • Data Table on UK - Year-over-year growth 2024-2029 (%)
      • 12.18 Market opportunity by geography
        • Market opportunity by geography ($ million)
        • Data Tables on Market opportunity by geography ($ million)

      13 Drivers, Challenges, and Opportunity/Restraints

      • 13.1 Market drivers
        • 13.2 Market challenges
          • 13.3 Impact of drivers and challenges
            • Impact of drivers and challenges in 2024 and 2029
          • 13.4 Market opportunities/restraints

            14 Competitive Landscape

            • 14.1 Overview
              • 14.2 Competitive Landscape
                • Overview on criticality of inputs and factors of differentiation
              • 14.3 Landscape disruption
                • Overview on factors of disruption
              • 14.4 Industry risks
                • Impact of key risks on business

              15 Competitive Analysis

              • 15.1 Companies profiled
                • Companies covered
              • 15.2 Company ranking index
                • Company ranking index
              • 15.3 Market positioning of companies
                • Matrix on companies position and classification
              • 15.4 Agriculture Insurance Co. of India Ltd.
                • Agriculture Insurance Co. of India Ltd. - Overview
                • Agriculture Insurance Co. of India Ltd. - Product / Service
                • Agriculture Insurance Co. of India Ltd. - Key offerings
                • SWOT
              • 15.5 Allianz SE
                • Allianz SE - Overview
                • Allianz SE - Business segments
                • Allianz SE - Key news
                • Allianz SE - Key offerings
                • Allianz SE - Segment focus
                • SWOT
              • 15.6 Aon plc
                • Aon plc - Overview
                • Aon plc - Business segments
                • Aon plc - Key news
                • Aon plc - Key offerings
                • Aon plc - Segment focus
                • SWOT
              • 15.7 AXA Group
                • AXA Group - Overview
                • AXA Group - Business segments
                • AXA Group - Key news
                • AXA Group - Key offerings
                • AXA Group - Segment focus
                • SWOT
              • 15.8 Bajaj Finserv Ltd.
                • Bajaj Finserv Ltd. - Overview
                • Bajaj Finserv Ltd. - Business segments
                • Bajaj Finserv Ltd. - Key offerings
                • Bajaj Finserv Ltd. - Segment focus
                • SWOT
              • 15.9 Chubb Ltd.
                • Chubb Ltd. - Overview
                • Chubb Ltd. - Business segments
                • Chubb Ltd. - Key news
                • Chubb Ltd. - Key offerings
                • Chubb Ltd. - Segment focus
                • SWOT
              • 15.10 Everest Group Ltd.
                • Everest Group Ltd. - Overview
                • Everest Group Ltd. - Business segments
                • Everest Group Ltd. - Key offerings
                • Everest Group Ltd. - Segment focus
                • SWOT
              • 15.11 Great American Insurance Co
                • Great American Insurance Co - Overview
                • Great American Insurance Co - Product / Service
                • Great American Insurance Co - Key offerings
                • SWOT
              • 15.12 Hannover Re
                • Hannover Re - Overview
                • Hannover Re - Product / Service
                • Hannover Re - Key offerings
                • SWOT
              • 15.13 HDFC ERGO General Insurance Co Ltd
                • HDFC ERGO General Insurance Co Ltd - Overview
                • HDFC ERGO General Insurance Co Ltd - Product / Service
                • HDFC ERGO General Insurance Co Ltd - Key offerings
                • SWOT
              • 15.14 ICICI Bank Ltd.
                • ICICI Bank Ltd. - Overview
                • ICICI Bank Ltd. - Business segments
                • ICICI Bank Ltd. - Key offerings
                • ICICI Bank Ltd. - Segment focus
                • SWOT
              • 15.15 Indian Farmers Fertiliser Cooperative Ltd.
                • Indian Farmers Fertiliser Cooperative Ltd. - Overview
                • Indian Farmers Fertiliser Cooperative Ltd. - Product / Service
                • Indian Farmers Fertiliser Cooperative Ltd. - Key offerings
                • SWOT
              • 15.16 Munich Reinsurance Co.
                • Munich Reinsurance Co. - Overview
                • Munich Reinsurance Co. - Business segments
                • Munich Reinsurance Co. - Key news
                • Munich Reinsurance Co. - Key offerings
                • Munich Reinsurance Co. - Segment focus
                • SWOT
              • 15.17 Reliance General Insurance
                • Reliance General Insurance - Overview
                • Reliance General Insurance - Product / Service
                • Reliance General Insurance - Key offerings
                • SWOT
              • 15.18 State Bank of India
                • State Bank of India - Overview
                • State Bank of India - Business segments
                • State Bank of India - Key offerings
                • State Bank of India - Segment focus
                • SWOT

              16 Appendix

              • 16.1 Scope of the report
                • 16.2 Inclusions and exclusions checklist
                  • Inclusions checklist
                  • Exclusions checklist
                • 16.3 Currency conversion rates for US$
                  • Currency conversion rates for US$
                • 16.4 Research methodology
                  • Research methodology
                • 16.5 Data procurement
                  • Information sources
                • 16.6 Data validation
                  • Data validation
                • 16.7 Validation techniques employed for market sizing
                  • Validation techniques employed for market sizing
                • 16.8 Data synthesis
                  • Data synthesis
                • 16.9 360 degree market analysis
                  • 360 degree market analysis
                • 16.10 List of abbreviations
                  • List of abbreviations

                Research Methodology

                Technavio presents a detailed picture of the market by way of study, synthesis, and summation of data from multiple sources. The analysts have presented the various facets of the market with a particular focus on identifying the key industry influencers. The data thus presented is comprehensive, reliable, and the result of extensive research, both primary and secondary.

                INFORMATION SOURCES

                Primary sources

                • Manufacturers and suppliers
                • Channel partners
                • Industry experts
                • Strategic decision makers

                Secondary sources

                • Industry journals and periodicals
                • Government data
                • Financial reports of key industry players
                • Historical data
                • Press releases

                DATA ANALYSIS

                Data Synthesis

                • Collation of data
                • Estimation of key figures
                • Analysis of derived insights

                Data Validation

                • Triangulation with data models
                • Reference against proprietary databases
                • Corroboration with industry experts

                REPORT WRITING

                Qualitative

                • Market drivers
                • Market challenges
                • Market trends
                • Five forces analysis

                Quantitative

                • Market size and forecast
                • Market segmentation
                • Geographical insights
                • Competitive landscape

                Interested in this report?

                Get your sample now to see our research methodology and insights!

                Download Now

                Frequently Asked Questions

                Crop Insurance market growth will increase by $ 15.62 bn during 2025-2029 .

                The Crop Insurance market is expected to grow at a CAGR of 6.3% during 2025-2029 .

                Crop Insurance market is segmented by Product( Indemnity-based, Index-based) Type( Crop yielded insurance, Crop revenue insurance, Europe, South America, Middle East and Africa) Distribution Channel( Direct sales, Brokers, Bancassurance, South America, Middle East and Africa)

                Agriculture Insurance Co. of India Ltd., Allianz SE, Aon plc, AXA Group, Bajaj Finserv Ltd., Chubb Ltd., Everest Group Ltd., Great American Insurance Co, Hannover Re, HDFC ERGO General Insurance Co Ltd, ICICI Bank Ltd., Indian Farmers Fertiliser Cooperative Ltd., MARSH LLC, Munich Reinsurance Co., QBE Insurance Group Ltd., Reliance General Insurance, Sompo Holdings Inc., State Bank of India, Swiss Re Ltd., Willis Towers Watson Public Ltd. Co. are a few of the key vendors in the Crop Insurance market.

                APAC will register the highest growth rate of 34% among the other regions. Therefore, the Crop Insurance market in APAC is expected to garner significant business opportunities for the vendors during the forecast period.

                US, China, India, Brazil, Germany, France, Canada, Argentina, UK, Japan

                • Extreme weather conditions due to global warmingExtreme weather conditions such as drought is the driving factor this market.
                • extreme rainfall is the driving factor this market.
                • and wildfires are becoming increasingly frequent due to global warming. Also is the driving factor this market.
                • floods is the driving factor this market.
                • hurricanes is the driving factor this market.
                • drought is the driving factor this market.
                • and excessive rainfall negatively impact agricultural production across all regions of the globe. Adverse weather conditions such as monsoons and droughts have a huge impact on farm production and output. These extreme weather events can damage crops is the driving factor this market.
                • thereby causing economic loss to farmers and affecting the economy negatively.According to the Goddard Institute for Space Studies (GISS) in the US is the driving factor this market.
                • the world temperature increased by 33.62-degree Fahrenheit compared with the average temperature from 1951-1980. This increase in temperature has caused climatic changes globally. According to the National Oceanic and Atmospheric Administration of the US is the driving factor this market.
                • researchers have found a strong correlation between climate change and extreme weather events. To reduce the risk of crops being damaged during these events is the driving factor this market.
                • the demand for crop insurance has increased. This is the driving factor this market.
                • in turn is the driving factor this market.
                • will drive the growth of the global crop insurance market during the forecast period. is the driving factor this market.

                The Crop Insurance market vendors should focus on grabbing business opportunities from the Indemnity-based segment as it accounted for the largest market share in the base year.