Cross-border Trade Compliance Automation Market Analysis, Size, and Forecast 2026-2030: North America (US, Canada, and Mexico), Europe (Germany, UK, and France), APAC (China, Japan, and India), Middle East and Africa (UAE, Saudi Arabia, and South Africa), South America (Brazil, Argentina, and Colombia), and Rest of World (ROW)

Cross-border Trade Compliance Automation Market Analysis, Size, and Forecast 2026-2030:
North America (US, Canada, and Mexico), Europe (Germany, UK, and France), APAC (China, Japan, and India), Middle East and Africa (UAE, Saudi Arabia, and South Africa), South America (Brazil, Argentina, and Colombia), and Rest of World (ROW)

Published: Mar 2026 297 Pages SKU: IRTNTR81265

Market Overview at a Glance

$1.75 B
Market Opportunity
12.8%
CAGR 2025 - 2030
37.1%
North America Growth
$1.17 B
Software segment 2024

Cross-border Trade Compliance Automation Market Size 2026-2030

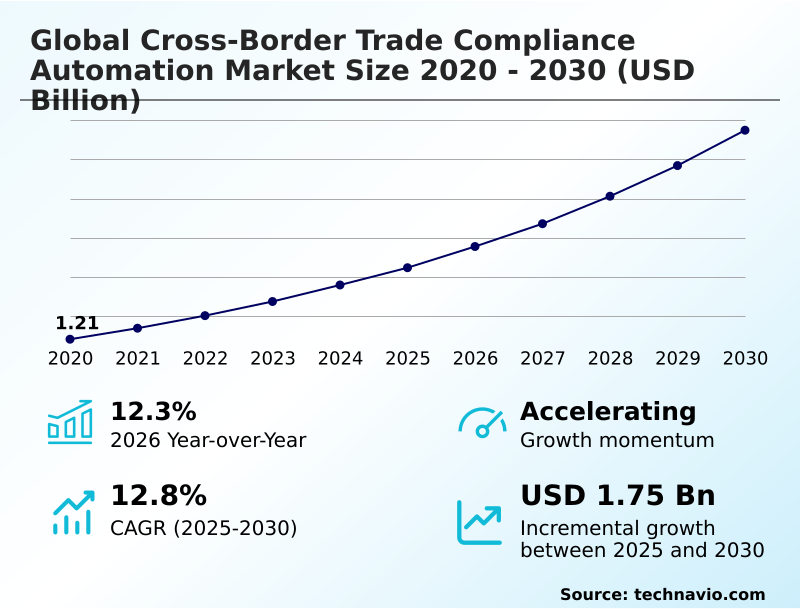
The cross-border trade compliance automation market size is valued to increase by USD 1.75 billion, at a CAGR of 12.8% from 2025 to 2030. Heightened regulatory complexity and evolution of global trade mandates will drive the cross-border trade compliance automation market.

Major Market Trends & Insights

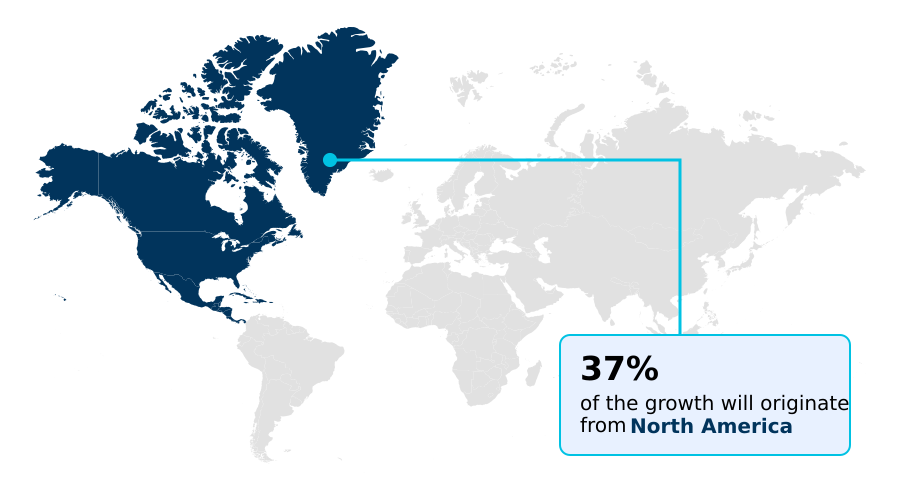
  • North America dominated the market and accounted for a 37.1% growth during the forecast period.
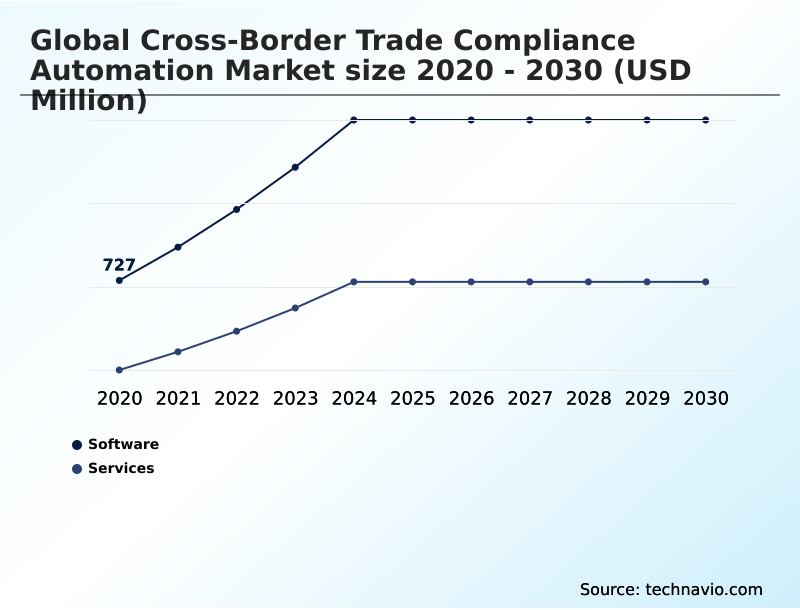
  • By Component - Software segment was valued at USD 1.17 billion in 2024
  • By Deployment - Cloud based segment accounted for the largest market revenue share in 2024

Market Size & Forecast

  • Market Opportunities: USD 2.67 billion
  • Market Future Opportunities: USD 1.75 billion
  • CAGR from 2025 to 2030 : 12.8%

Market Summary

  • The cross-border trade compliance automation market is experiencing robust expansion as organizations prioritize digital transformation to navigate complex international regulatory landscapes. Escalating trade policy shifts and the rise of environmental, social, and governance (ESG) mandates necessitate sophisticated solutions that can ensure adherence and mitigate financial penalties.
  • Modern platforms leverage artificial intelligence and cloud computing to automate critical functions, including product classification, duty calculation, and restricted party screening. For instance, a multinational electronics manufacturer can utilize an automated system to manage export licenses for dual-use components across dozens of jurisdictions, ensuring real-time compliance with evolving national security controls and reducing shipment delays.
  • This technological shift enables businesses to enhance operational efficiency, improve supply chain transparency with automated customs brokerage, and maintain a competitive edge in a volatile global market. The primary challenge remains the high initial investment and the difficulty of integrating these advanced tools with legacy enterprise systems, which can create a digital divide between large corporations and smaller enterprises.

What will be the Size of the Cross-border Trade Compliance Automation Market during the forecast period?

Get Key Insights on Market Forecast (PDF) Request Free Sample

How is the Cross-border Trade Compliance Automation Market Segmented?

The cross-border trade compliance automation industry research report provides comprehensive data (region-wise segment analysis), with forecasts and estimates in "USD million" for the period 2026-2030, as well as historical data from 2020-2024 for the following segments.

  • Component
    • Software
    • Services
  • Deployment
    • Cloud based
    • On premises
  • Application
    • Import and export management
    • Customs management
    • Trade compliance
    • Others
  • Geography
    • North America
      • US
      • Canada
      • Mexico
    • Europe
      • Germany
      • UK
      • France
    • APAC
      • China
      • Japan
      • India
    • Middle East and Africa
      • UAE
      • Saudi Arabia
      • South Africa
    • South America
      • Brazil
      • Argentina
      • Colombia
    • Rest of World (ROW)

By Component Insights

The software segment is estimated to witness significant growth during the forecast period.

The software segment is the cornerstone of the cross-border trade compliance automation market, encompassing the applications that manage the complexities of international trade.

These platforms, often integrated as an esg compliance module, provide core functionalities such as automated tariff classification and rules of origin verification.

Deployed as either cloud-based or on-premises solutions, this customs management software is designed for seamless single window system integration.

The primary role of these systems is to automate critical processes, from duty and tax calculation to restricted party screening, reducing manual filing errors by over 25%.

As regulatory demands intensify, the software segment continues to evolve, incorporating advanced analytics and machine learning to deliver greater precision and strategic insight for global businesses.

Request Free Sample

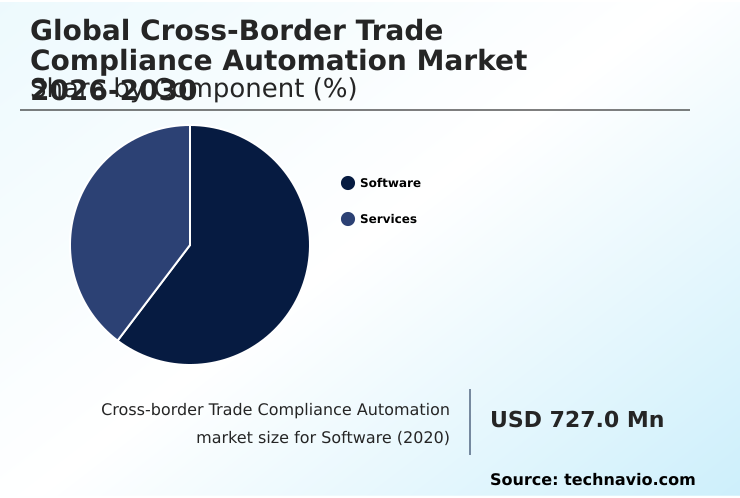
The Software segment was valued at USD 1.17 billion in 2024 and showed a gradual increase during the forecast period.

Request Free Sample

Regional Analysis

North America is estimated to contribute 37.1% to the growth of the global market during the forecast period.Technavio’s analysts have elaborately explained the regional trends and drivers that shape the market during the forecast period.

See How Cross-border Trade Compliance Automation Market Demand is Rising in North America Request Free Sample

The geographic landscape of the cross-border trade compliance automation market is led by North America, which is projected to contribute 37.1% of the market's incremental growth.

This is driven by a sophisticated digital trade corridor access and stringent enforcement of export control automation. The region's mature adoption of supply chain visibility platform technologies and cloud-based compliance engine solutions solidifies its leading position.

Europe and APAC follow closely, with both regions emphasizing supply chain due diligence and investing heavily in modernizing their customs infrastructure.

Firms in these regions are increasingly adopting automated systems for denied party screening, improving compliance audit pass rates by an average of 15% and ensuring seamless cross-border operations.

Market Dynamics

Our researchers analyzed the data with 2025 as the base year, along with the key drivers, trends, and challenges. A holistic analysis of drivers will help companies refine their marketing strategies to gain a competitive advantage.

  • Strategic implementation of cross-border trade automation is becoming a critical differentiator for global enterprises. The ability in automating cross-border e-commerce compliance is no longer a niche capability but a core requirement for accessing international consumer markets, where speed and accuracy are paramount.
  • Leading firms are leveraging ai for trade regulation analysis, moving from reactive compliance to proactive strategy by anticipating policy shifts. Simultaneously, the adoption of blockchain for supply chain transparency provides an immutable audit trail, which is essential for esg reporting in global trade and for automating trade finance document verification.
  • A key operational focus is on managing carbon border adjustment mechanism requirements through specialized software modules. These systems excel at software for harmonized system classification and include tools for calculating landed cost for imports, offering a clear view of total supply chain costs.
  • For high-risk sectors, automating compliance for dual-use goods and deploying real-time sanction screening software are non-negotiable security measures. The operational benefits are clear, with businesses reducing duties with trade automation by effectively navigating international trade agreements and their complex rules of origin.
  • Furthermore, integrating trade compliance with erp systems creates a unified data environment, which is fundamental for managing digital reporting for customs and for automating certificate of origin management.
  • Cloud solutions for trade compliance provide the scalability needed to manage extensive software for restricted party lists while ensuring access to the latest compliance data, enabling firms to optimize their global operations and achieve efficiency gains that are twice that of their non-automated counterparts.
  • A complete system provides a holistic approach to optimizing supply chain with automation and automating export control and licensing.

What are the key market drivers leading to the rise in the adoption of Cross-border Trade Compliance Automation Industry?

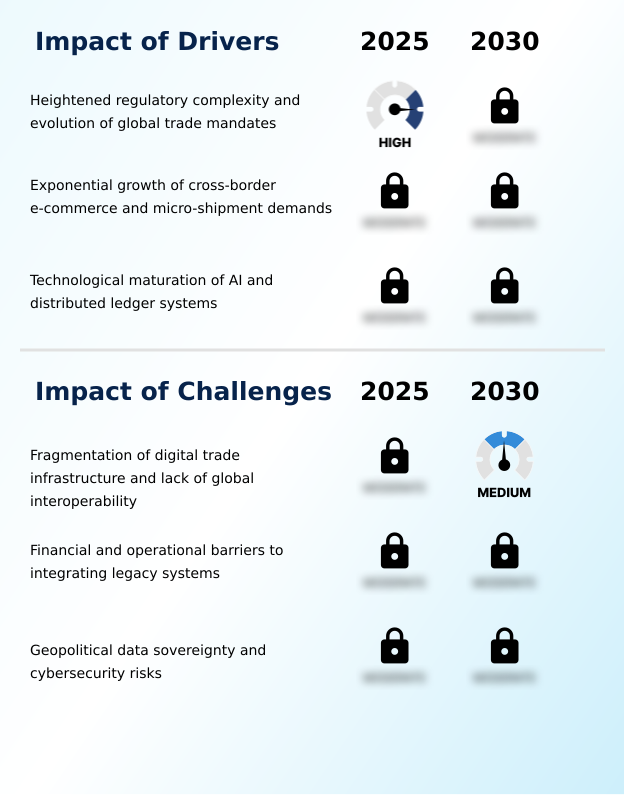
  • Heightened regulatory complexity and the evolution of global trade mandates are key drivers for the growth of the cross-border trade compliance automation market.

  • Exponential growth in cross-border e-commerce is a primary driver, compelling retailers to adopt e-commerce compliance solutions for high-volume, low-value shipments. This shift necessitates an efficient automated export system and robust import-export management software.
  • The increasing complexity of global regulations, including new environmental standards, mandates the use of trade compliance software to manage carbon border reporting and ensure adherence.
  • The need for speed and accuracy has made automated shipping documentation essential, with companies that automate seeing a 20% faster release of goods from customs.
  • The maturation of AI and distributed ledger technologies provides the foundation for more sophisticated supply chain risk assessment and compliance management.

What are the market trends shaping the Cross-border Trade Compliance Automation Industry?

  • The integration of generative AI for advanced regulatory intelligence is an emerging market trend, enabling cognitive systems to interpret complex legal texts and provide real-time guidance.

  • The evolution of trade compliance is marked by the adoption of cognitive technologies. The use of a generative ai for trade allows firms to analyze complex regulations, reducing research time by up to 40%. A key trend is the move toward a decentralized compliance framework, where blockchain-based trade finance platforms automate verification, improving transaction security by over 30%.
  • This shift enhances trade visibility tools, providing a single source of truth. Advanced trade analytics software now incorporates predictive risk analytics to forecast potential supply chain disruptions. Furthermore, automated product classification is becoming standard, ensuring accuracy in customs filings and minimizing penalties associated with misinterpretation of trade rules.

What challenges does the Cross-border Trade Compliance Automation Industry face during its growth?

  • The fragmentation of digital trade infrastructure and a lack of global interoperability present a key challenge affecting industry growth and the seamless flow of data.

  • Persistent fragmentation of digital trade infrastructure and a lack of global interoperability create significant challenges. Many firms struggle with integrating modern logistics compliance platform solutions with legacy ERP systems, with integration projects often exceeding budgets by 15%. This creates a barrier for automated customs filing.
  • Furthermore, differing national data sovereignty laws complicate the use of centralized trade data management systems, impeding real-time regulatory updates. The high cost of implementing a full global trade management suite is prohibitive for many SMEs. These technological and financial hurdles slow the adoption of crucial capabilities like harmonized system classification and sanctioned party screening, leaving firms exposed to compliance risks.

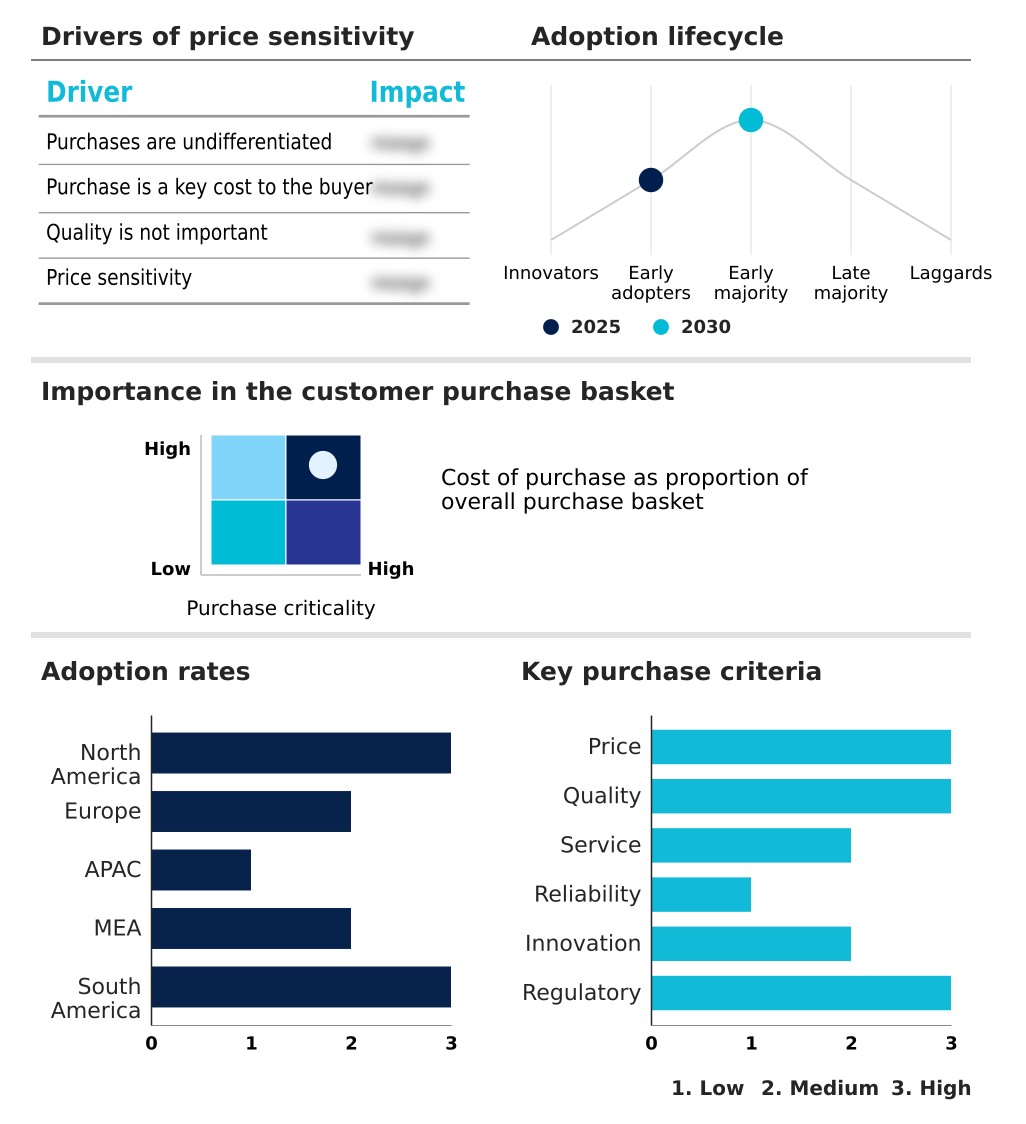
Exclusive Technavio Analysis on Customer Landscape

The cross-border trade compliance automation market forecasting report includes the adoption lifecycle of the market, covering from the innovator’s stage to the laggard’s stage. It focuses on adoption rates in different regions based on penetration. Furthermore, the cross-border trade compliance automation market report also includes key purchase criteria and drivers of price sensitivity to help companies evaluate and develop their market growth analysis strategies.

Customer Landscape of Cross-border Trade Compliance Automation Industry

Competitive Landscape

Companies are implementing various strategies, such as strategic alliances, cross-border trade compliance automation market forecast, partnerships, mergers and acquisitions, geographical expansion, and product/service launches, to enhance their presence in the industry.

AEB SE - Solutions for automated sanctioned party screening, export licensing, and customs declaration processing streamline global trade compliance for businesses operating across international borders.

The industry research and growth report includes detailed analyses of the competitive landscape of the market and information about key companies, including:

  • AEB SE
  • AP Moller Maersk AS
  • Avalara Inc.
  • British Standards Institution
  • CustomsCity Global Solutions Inc
  • Descartes Systems Group Inc.
  • E2open Parent Holdings Inc.
  • Expeditors International Inc.
  • Flexport Inc.
  • IBM Corp.
  • iGlobal Exports LLC
  • Livingston International Inc.
  • OCR Services Inc.
  • Oracle Corp.
  • Pitney Bowes Inc.
  • QAD Inc.
  • SAP SE
  • Sayari Labs Inc
  • Thomson Reuters Corp.
  • WiseTech Global Ltd.

Qualitative and quantitative analysis of companies has been conducted to help clients understand the wider business environment as well as the strengths and weaknesses of key industry players. Data is qualitatively analyzed to categorize companies as pure play, category-focused, industry-focused, and diversified; it is quantitatively analyzed to categorize companies as dominant, leading, strong, tentative, and weak.

Recent Development and News in Cross-border trade compliance automation market

  • In March 2025, a leading global trade management software developer introduced a generative AI assistant that enables users to analyze new bilateral trade agreements using natural language queries.
  • In April 2025, the European Union implemented the second phase of its Carbon Border Adjustment Mechanism, mandating the digital reporting of the carbon intensity for imported industrial materials.
  • In August 2025, a major North American technology provider launched a cognitive classification tool that uses machine learning to suggest Harmonized System codes for new electronic components.
  • In June 2025, a major South American maritime authority, in collaboration with a North American customs agency, established a blockchain-based data corridor to automate the verification of shipping manifests.

Dive into Technavio’s robust research methodology, blending expert interviews, extensive data synthesis, and validated models for unparalleled Cross-border Trade Compliance Automation Market insights. See full methodology.

Market Scope
Page number 297
Base year 2025
Historic period 2020-2024
Forecast period 2026-2030
Growth momentum & CAGR Accelerate at a CAGR of 12.8%
Market growth 2026-2030 USD 1749.1 million
Market structure Fragmented
YoY growth 2025-2026(%) 12.3%
Key countries US, Canada, Mexico, Germany, UK, France, Italy, Spain, The Netherlands, China, Japan, India, South Korea, Australia, Indonesia, UAE, Saudi Arabia, South Africa, Israel, Turkey, Brazil, Argentina and Colombia
Competitive landscape Leading Companies, Market Positioning of Companies, Competitive Strategies, and Industry Risks

Request Free Sample

Research Analyst Overview

  • The cross-border trade compliance automation market is fundamentally reshaping how organizations manage international commerce, moving beyond simple automation to strategic risk mitigation. A core function involves the automated tariff classification of goods and robust harmonized system classification, which is now augmented by predictive risk analytics.
  • Essential platform capabilities include denied party screening and continuous sanctioned party screening, which are critical for navigating geopolitical volatility. The automation of core processes like customs declaration processing, automated customs brokerage, and adherence to the automated export system is standard. Moreover, solutions provide comprehensive export control automation and automated license management.
  • For financial clarity, duty and tax calculation and landed cost calculation are integrated, while rules of origin verification ensures preferential tariff access. Advanced tools deliver real-time regulatory updates and facilitate carbon border reporting to meet ESG mandates.
  • Boardroom decisions are increasingly influenced by a holistic view of supply chain risk assessment and supply chain due diligence, supported by trade visibility tools. Firms leveraging these systems report a 25% improvement in audit-readiness through streamlined trade compliance documentation and automated product classification.
  • The integration of electronic data interchange and access to digital trade corridor access is enabling more resilient supply chains, with import compliance automation and trade finance automation ensuring end-to-end operational fluidity and security against restricted party screening failures.

What are the Key Data Covered in this Cross-border Trade Compliance Automation Market Research and Growth Report?

  • What is the expected growth of the Cross-border Trade Compliance Automation Market between 2026 and 2030?

    • USD 1.75 billion, at a CAGR of 12.8%

  • What segmentation does the market report cover?

    • The report is segmented by Component (Software, and Services), Deployment (Cloud based, and On premises), Application (Import and export management, Customs management, Trade compliance, and Others) and Geography (North America, Europe, APAC, Middle East and Africa, South America)

  • Which regions are analyzed in the report?

    • North America, Europe, APAC, Middle East and Africa and South America

  • What are the key growth drivers and market challenges?

    • Heightened regulatory complexity and evolution of global trade mandates, Fragmentation of digital trade infrastructure and lack of global interoperability

  • Who are the major players in the Cross-border Trade Compliance Automation Market?

    • AEB SE, AP Moller Maersk AS, Avalara Inc., British Standards Institution, CustomsCity Global Solutions Inc, Descartes Systems Group Inc., E2open Parent Holdings Inc., Expeditors International Inc., Flexport Inc., IBM Corp., iGlobal Exports LLC, Livingston International Inc., OCR Services Inc., Oracle Corp., Pitney Bowes Inc., QAD Inc., SAP SE, Sayari Labs Inc, Thomson Reuters Corp. and WiseTech Global Ltd.

Market Research Insights

  • The strategic adoption of a global trade management suite is delivering significant competitive advantages, with businesses reporting a 30% reduction in customs processing delays. This trade compliance software, often deployed as a cloud-based compliance engine, facilitates automated customs filing and robust customs management software.
  • The integration into a logistics compliance platform is critical for high-volume shippers, while dedicated e-commerce compliance solutions address the complexities of direct-to-consumer sales, improving landed cost accuracy by over 95%. The emergence of generative ai for trade and blockchain-based trade finance is shifting the paradigm toward proactive risk management.
  • For governments, single window system integration is a priority, fostering a decentralized compliance framework supported by a modernized digital trade infrastructure. A comprehensive supply chain visibility platform coupled with trade analytics software enables data-driven decisions. The inclusion of an esg compliance module is now essential for market access.
  • These systems also streamline automated trade finance and cross-border payment automation through robust import-export management software that handles automated shipping documentation and ensures superior trade data management.

We can help! Our analysts can customize this cross-border trade compliance automation market research report to meet your requirements.

Get in touch

1. Executive Summary

1.1 Market overview

Executive Summary - Chart on Market Overview
Executive Summary - Data Table on Market Overview
Executive Summary - Chart on Global Market Characteristics
Executive Summary - Chart on Market by Geography
Executive Summary - Chart on Market Segmentation by Component
Executive Summary - Chart on Market Segmentation by Deployment
Executive Summary - Chart on Market Segmentation by Application
Executive Summary - Chart on Incremental Growth
Executive Summary - Data Table on Incremental Growth
Executive Summary - Chart on Company Market Positioning

2. Technavio Analysis

2.1 Analysis of price sensitivity, lifecycle, customer purchase basket, adoption rates, and purchase criteria

2.2 Criticality of inputs and Factors of differentiation

Chart on Overview on criticality of inputs and factors of differentiation

2.3 Factors of disruption

Chart on Overview on factors of disruption

2.4 Impact of drivers and challenges

Chart on Impact of drivers and challenges in 2025 and 2030

3. Market Landscape

3.1 Market ecosystem

Chart on Parent Market
Data Table on - Parent Market

3.2 Market characteristics

Chart on Market characteristics analysis

3.3 Value chain analysis

Chart on Value chain analysis

4. Market Sizing

4.1 Market definition

Data Table on Offerings of companies included in the market definition

4.2 Market segment analysis

Market segments

4.3 Market size 2025

4.4 Market outlook: Forecast for 2025-2030

Chart on Global - Market size and forecast 2025-2030 ($ million)
Data Table on Global - Market size and forecast 2025-2030 ($ million)
Chart on Global Market: Year-over-year growth 2025-2030 (%)
Data Table on Global Market: Year-over-year growth 2025-2030 (%)

5. Historic Market Size

5.1 Global Cross-Border Trade Compliance Automation Market 2020 - 2024

Historic Market Size - Data Table on Global Cross-Border Trade Compliance Automation Market 2020 - 2024 ($ million)

5.2 Component segment analysis 2020 - 2024

Historic Market Size - Component Segment 2020 - 2024 ($ million)

5.3 Deployment segment analysis 2020 - 2024

Historic Market Size - Deployment Segment 2020 - 2024 ($ million)

5.4 Application segment analysis 2020 - 2024

Historic Market Size - Application Segment 2020 - 2024 ($ million)

5.5 Geography segment analysis 2020 - 2024

Historic Market Size - Geography Segment 2020 - 2024 ($ million)

5.6 Country segment analysis 2020 - 2024

Historic Market Size - Country Segment 2020 - 2024 ($ million)

6. Qualitative Analysis

6.1 The AI impact on Global Cross-border Trade Compliance Automation Market

7. Five Forces Analysis

7.1 Five forces summary

Five forces analysis - Comparison between 2025 and 2030

7.2 Bargaining power of buyers

Bargaining power of buyers - Impact of key factors 2025 and 2030

7.3 Bargaining power of suppliers

Bargaining power of suppliers - Impact of key factors in 2025 and 2030

7.4 Threat of new entrants

Threat of new entrants - Impact of key factors in 2025 and 2030

7.5 Threat of substitutes

Threat of substitutes - Impact of key factors in 2025 and 2030

7.6 Threat of rivalry

Threat of rivalry - Impact of key factors in 2025 and 2030

7.7 Market condition

Chart on Market condition - Five forces 2025 and 2030

8. Market Segmentation by Component

8.1 Market segments

Chart on Component - Market share 2025-2030 (%)
Data Table on Component - Market share 2025-2030 (%)

8.2 Comparison by Component

Chart on Comparison by Component
Data Table on Comparison by Component

8.3 Software - Market size and forecast 2025-2030

Chart on Software - Market size and forecast 2025-2030 ($ million)
Data Table on Software - Market size and forecast 2025-2030 ($ million)
Chart on Software - Year-over-year growth 2025-2030 (%)
Data Table on Software - Year-over-year growth 2025-2030 (%)

8.4 Services - Market size and forecast 2025-2030

Chart on Services - Market size and forecast 2025-2030 ($ million)
Data Table on Services - Market size and forecast 2025-2030 ($ million)
Chart on Services - Year-over-year growth 2025-2030 (%)
Data Table on Services - Year-over-year growth 2025-2030 (%)

8.5 Market opportunity by Component

Market opportunity by Component ($ million)
Data Table on Market opportunity by Component ($ million)

9. Market Segmentation by Deployment

9.1 Market segments

Chart on Deployment - Market share 2025-2030 (%)
Data Table on Deployment - Market share 2025-2030 (%)

9.2 Comparison by Deployment

Chart on Comparison by Deployment
Data Table on Comparison by Deployment

9.3 Cloud based - Market size and forecast 2025-2030

Chart on Cloud based - Market size and forecast 2025-2030 ($ million)
Data Table on Cloud based - Market size and forecast 2025-2030 ($ million)
Chart on Cloud based - Year-over-year growth 2025-2030 (%)
Data Table on Cloud based - Year-over-year growth 2025-2030 (%)

9.4 On premises - Market size and forecast 2025-2030

Chart on On premises - Market size and forecast 2025-2030 ($ million)
Data Table on On premises - Market size and forecast 2025-2030 ($ million)
Chart on On premises - Year-over-year growth 2025-2030 (%)
Data Table on On premises - Year-over-year growth 2025-2030 (%)

9.5 Market opportunity by Deployment

Market opportunity by Deployment ($ million)
Data Table on Market opportunity by Deployment ($ million)

10. Market Segmentation by Application

10.1 Market segments

Chart on Application - Market share 2025-2030 (%)
Data Table on Application - Market share 2025-2030 (%)

10.2 Comparison by Application

Chart on Comparison by Application
Data Table on Comparison by Application

10.3 Import and export management - Market size and forecast 2025-2030

Chart on Import and export management - Market size and forecast 2025-2030 ($ million)
Data Table on Import and export management - Market size and forecast 2025-2030 ($ million)
Chart on Import and export management - Year-over-year growth 2025-2030 (%)
Data Table on Import and export management - Year-over-year growth 2025-2030 (%)

10.4 Customs management - Market size and forecast 2025-2030

Chart on Customs management - Market size and forecast 2025-2030 ($ million)
Data Table on Customs management - Market size and forecast 2025-2030 ($ million)
Chart on Customs management - Year-over-year growth 2025-2030 (%)
Data Table on Customs management - Year-over-year growth 2025-2030 (%)

10.5 Trade compliance - Market size and forecast 2025-2030

Chart on Trade compliance - Market size and forecast 2025-2030 ($ million)
Data Table on Trade compliance - Market size and forecast 2025-2030 ($ million)
Chart on Trade compliance - Year-over-year growth 2025-2030 (%)
Data Table on Trade compliance - Year-over-year growth 2025-2030 (%)

10.6 Others - Market size and forecast 2025-2030

Chart on Others - Market size and forecast 2025-2030 ($ million)
Data Table on Others - Market size and forecast 2025-2030 ($ million)
Chart on Others - Year-over-year growth 2025-2030 (%)
Data Table on Others - Year-over-year growth 2025-2030 (%)

10.7 Market opportunity by Application

Market opportunity by Application ($ million)
Data Table on Market opportunity by Application ($ million)

11. Customer Landscape

11.1 Customer landscape overview

Analysis of price sensitivity, lifecycle, customer purchase basket, adoption rates, and purchase criteria

12. Geographic Landscape

12.1 Geographic segmentation

Chart on Market share by geography 2025-2030 (%)
Data Table on Market share by geography 2025-2030 (%)

12.2 Geographic comparison

Chart on Geographic comparison
Data Table on Geographic comparison

12.3 North America - Market size and forecast 2025-2030

Chart on North America - Market size and forecast 2025-2030 ($ million)
Data Table on North America - Market size and forecast 2025-2030 ($ million)
Chart on North America - Year-over-year growth 2025-2030 (%)
Data Table on North America - Year-over-year growth 2025-2030 (%)
Chart on Regional Comparison - North America
Data Table on Regional Comparison - North America

12.3.1 US - Market size and forecast 2025-2030

Chart on US - Market size and forecast 2025-2030 ($ million)
Data Table on US - Market size and forecast 2025-2030 ($ million)
Chart on US - Year-over-year growth 2025-2030 (%)
Data Table on US - Year-over-year growth 2025-2030 (%)

12.3.2 Canada - Market size and forecast 2025-2030

Chart on Canada - Market size and forecast 2025-2030 ($ million)
Data Table on Canada - Market size and forecast 2025-2030 ($ million)
Chart on Canada - Year-over-year growth 2025-2030 (%)
Data Table on Canada - Year-over-year growth 2025-2030 (%)

12.3.3 Mexico - Market size and forecast 2025-2030

Chart on Mexico - Market size and forecast 2025-2030 ($ million)
Data Table on Mexico - Market size and forecast 2025-2030 ($ million)
Chart on Mexico - Year-over-year growth 2025-2030 (%)
Data Table on Mexico - Year-over-year growth 2025-2030 (%)

12.4 Europe - Market size and forecast 2025-2030

Chart on Europe - Market size and forecast 2025-2030 ($ million)
Data Table on Europe - Market size and forecast 2025-2030 ($ million)
Chart on Europe - Year-over-year growth 2025-2030 (%)
Data Table on Europe - Year-over-year growth 2025-2030 (%)
Chart on Regional Comparison - Europe
Data Table on Regional Comparison - Europe

12.4.1 Germany - Market size and forecast 2025-2030

Chart on Germany - Market size and forecast 2025-2030 ($ million)
Data Table on Germany - Market size and forecast 2025-2030 ($ million)
Chart on Germany - Year-over-year growth 2025-2030 (%)
Data Table on Germany - Year-over-year growth 2025-2030 (%)

12.4.2 UK - Market size and forecast 2025-2030

Chart on UK - Market size and forecast 2025-2030 ($ million)
Data Table on UK - Market size and forecast 2025-2030 ($ million)
Chart on UK - Year-over-year growth 2025-2030 (%)
Data Table on UK - Year-over-year growth 2025-2030 (%)

12.4.3 France - Market size and forecast 2025-2030

Chart on France - Market size and forecast 2025-2030 ($ million)
Data Table on France - Market size and forecast 2025-2030 ($ million)
Chart on France - Year-over-year growth 2025-2030 (%)
Data Table on France - Year-over-year growth 2025-2030 (%)

12.4.4 Italy - Market size and forecast 2025-2030

Chart on Italy - Market size and forecast 2025-2030 ($ million)
Data Table on Italy - Market size and forecast 2025-2030 ($ million)
Chart on Italy - Year-over-year growth 2025-2030 (%)
Data Table on Italy - Year-over-year growth 2025-2030 (%)

12.4.5 Spain - Market size and forecast 2025-2030

Chart on Spain - Market size and forecast 2025-2030 ($ million)
Data Table on Spain - Market size and forecast 2025-2030 ($ million)
Chart on Spain - Year-over-year growth 2025-2030 (%)
Data Table on Spain - Year-over-year growth 2025-2030 (%)

12.4.6 The Netherlands - Market size and forecast 2025-2030

Chart on The Netherlands - Market size and forecast 2025-2030 ($ million)
Data Table on The Netherlands - Market size and forecast 2025-2030 ($ million)
Chart on The Netherlands - Year-over-year growth 2025-2030 (%)
Data Table on The Netherlands - Year-over-year growth 2025-2030 (%)

12.5 APAC - Market size and forecast 2025-2030

Chart on APAC - Market size and forecast 2025-2030 ($ million)
Data Table on APAC - Market size and forecast 2025-2030 ($ million)
Chart on APAC - Year-over-year growth 2025-2030 (%)
Data Table on APAC - Year-over-year growth 2025-2030 (%)
Chart on Regional Comparison - APAC
Data Table on Regional Comparison - APAC

12.5.1 China - Market size and forecast 2025-2030

Chart on China - Market size and forecast 2025-2030 ($ million)
Data Table on China - Market size and forecast 2025-2030 ($ million)
Chart on China - Year-over-year growth 2025-2030 (%)
Data Table on China - Year-over-year growth 2025-2030 (%)

12.5.2 Japan - Market size and forecast 2025-2030

Chart on Japan - Market size and forecast 2025-2030 ($ million)
Data Table on Japan - Market size and forecast 2025-2030 ($ million)
Chart on Japan - Year-over-year growth 2025-2030 (%)
Data Table on Japan - Year-over-year growth 2025-2030 (%)

12.5.3 India - Market size and forecast 2025-2030

Chart on India - Market size and forecast 2025-2030 ($ million)
Data Table on India - Market size and forecast 2025-2030 ($ million)
Chart on India - Year-over-year growth 2025-2030 (%)
Data Table on India - Year-over-year growth 2025-2030 (%)

12.5.4 South Korea - Market size and forecast 2025-2030

Chart on South Korea - Market size and forecast 2025-2030 ($ million)
Data Table on South Korea - Market size and forecast 2025-2030 ($ million)
Chart on South Korea - Year-over-year growth 2025-2030 (%)
Data Table on South Korea - Year-over-year growth 2025-2030 (%)

12.5.5 Australia - Market size and forecast 2025-2030

Chart on Australia - Market size and forecast 2025-2030 ($ million)
Data Table on Australia - Market size and forecast 2025-2030 ($ million)
Chart on Australia - Year-over-year growth 2025-2030 (%)
Data Table on Australia - Year-over-year growth 2025-2030 (%)

12.5.6 Indonesia - Market size and forecast 2025-2030

Chart on Indonesia - Market size and forecast 2025-2030 ($ million)
Data Table on Indonesia - Market size and forecast 2025-2030 ($ million)
Chart on Indonesia - Year-over-year growth 2025-2030 (%)
Data Table on Indonesia - Year-over-year growth 2025-2030 (%)

12.6 Middle East and Africa - Market size and forecast 2025-2030

Chart on Middle East and Africa - Market size and forecast 2025-2030 ($ million)
Data Table on Middle East and Africa - Market size and forecast 2025-2030 ($ million)
Chart on Middle East and Africa - Year-over-year growth 2025-2030 (%)
Data Table on Middle East and Africa - Year-over-year growth 2025-2030 (%)
Chart on Regional Comparison - Middle East and Africa
Data Table on Regional Comparison - Middle East and Africa

12.6.1 UAE - Market size and forecast 2025-2030

Chart on UAE - Market size and forecast 2025-2030 ($ million)
Data Table on UAE - Market size and forecast 2025-2030 ($ million)
Chart on UAE - Year-over-year growth 2025-2030 (%)
Data Table on UAE - Year-over-year growth 2025-2030 (%)

12.6.2 Saudi Arabia - Market size and forecast 2025-2030

Chart on Saudi Arabia - Market size and forecast 2025-2030 ($ million)
Data Table on Saudi Arabia - Market size and forecast 2025-2030 ($ million)
Chart on Saudi Arabia - Year-over-year growth 2025-2030 (%)
Data Table on Saudi Arabia - Year-over-year growth 2025-2030 (%)

12.6.3 South Africa - Market size and forecast 2025-2030

Chart on South Africa - Market size and forecast 2025-2030 ($ million)
Data Table on South Africa - Market size and forecast 2025-2030 ($ million)
Chart on South Africa - Year-over-year growth 2025-2030 (%)
Data Table on South Africa - Year-over-year growth 2025-2030 (%)

12.6.4 Israel - Market size and forecast 2025-2030

Chart on Israel - Market size and forecast 2025-2030 ($ million)
Data Table on Israel - Market size and forecast 2025-2030 ($ million)
Chart on Israel - Year-over-year growth 2025-2030 (%)
Data Table on Israel - Year-over-year growth 2025-2030 (%)

12.6.5 Turkey - Market size and forecast 2025-2030

Chart on Turkey - Market size and forecast 2025-2030 ($ million)
Data Table on Turkey - Market size and forecast 2025-2030 ($ million)
Chart on Turkey - Year-over-year growth 2025-2030 (%)
Data Table on Turkey - Year-over-year growth 2025-2030 (%)

12.7 South America - Market size and forecast 2025-2030

Chart on South America - Market size and forecast 2025-2030 ($ million)
Data Table on South America - Market size and forecast 2025-2030 ($ million)
Chart on South America - Year-over-year growth 2025-2030 (%)
Data Table on South America - Year-over-year growth 2025-2030 (%)
Chart on Regional Comparison - South America
Data Table on Regional Comparison - South America

12.7.1 Brazil - Market size and forecast 2025-2030

Chart on Brazil - Market size and forecast 2025-2030 ($ million)
Data Table on Brazil - Market size and forecast 2025-2030 ($ million)
Chart on Brazil - Year-over-year growth 2025-2030 (%)
Data Table on Brazil - Year-over-year growth 2025-2030 (%)

12.7.2 Argentina - Market size and forecast 2025-2030

Chart on Argentina - Market size and forecast 2025-2030 ($ million)
Data Table on Argentina - Market size and forecast 2025-2030 ($ million)
Chart on Argentina - Year-over-year growth 2025-2030 (%)
Data Table on Argentina - Year-over-year growth 2025-2030 (%)

12.7.3 Colombia - Market size and forecast 2025-2030

Chart on Colombia - Market size and forecast 2025-2030 ($ million)
Data Table on Colombia - Market size and forecast 2025-2030 ($ million)
Chart on Colombia - Year-over-year growth 2025-2030 (%)
Data Table on Colombia - Year-over-year growth 2025-2030 (%)

12.8 Market opportunity by geography

Market opportunity by geography ($ million)
Data Tables on Market opportunity by geography ($ million)

13. Drivers, Challenges, and Opportunity

13.1 Market drivers

Heightened regulatory complexity and evolution of global trade mandates
Exponential growth of cross-border e-commerce and micro-shipment demands
Technological maturation of AI and distributed ledger systems

13.2 Market challenges

Fragmentation of digital trade infrastructure and lack of global interoperability
Financial and operational barriers to integrating legacy systems
Geopolitical data sovereignty and cybersecurity risks

13.3 Impact of drivers and challenges

Impact of drivers and challenges in 2025 and 2030

13.4 Market opportunities

Integration of generative AI for advanced regulatory intelligence
Emergence of ESG-centric compliance automation and carbon border reporting
Advancements in decentralized compliance and growth of unified digital trade corridors

14. Competitive Landscape

14.1 Overview

14.2

Overview on criticality of inputs and factors of differentiation

14.3 Landscape disruption

Overview on factors of disruption

14.4 Industry risks

Impact of key risks on business

15. Competitive Analysis

15.1 Companies profiled

Companies covered

15.2 Company ranking index

15.3 Market positioning of companies

Matrix on companies position and classification

15.4 AEB SE

AEB SE - Overview
AEB SE - Product / Service
AEB SE - Key offerings
SWOT

15.5 Avalara Inc.

Avalara Inc. - Overview
Avalara Inc. - Product / Service
Avalara Inc. - Key offerings
SWOT

15.6 British Standards Institution

British Standards Institution - Overview
British Standards Institution - Product / Service
British Standards Institution - Key offerings
SWOT

15.7 Descartes Systems Group Inc.

Descartes Systems Group Inc. - Overview
Descartes Systems Group Inc. - Business segments
Descartes Systems Group Inc. - Key offerings
Descartes Systems Group Inc. - Segment focus
SWOT

15.8 E2open Parent Holdings Inc.

E2open Parent Holdings Inc. - Overview
E2open Parent Holdings Inc. - Product / Service
E2open Parent Holdings Inc. - Key news
E2open Parent Holdings Inc. - Key offerings
SWOT

15.9 Expeditors International Inc.

Expeditors International Inc. - Overview
Expeditors International Inc. - Business segments
Expeditors International Inc. - Key offerings
Expeditors International Inc. - Segment focus
SWOT

15.10 Flexport Inc.

Flexport Inc. - Overview
Flexport Inc. - Product / Service
Flexport Inc. - Key offerings
SWOT

15.11 iGlobal Exports LLC

iGlobal Exports LLC - Overview
iGlobal Exports LLC - Product / Service
iGlobal Exports LLC - Key offerings
SWOT

15.12 Livingston International Inc.

Livingston International Inc. - Overview
Livingston International Inc. - Product / Service
Livingston International Inc. - Key offerings
SWOT

15.13 OCR Services Inc.

OCR Services Inc. - Overview
OCR Services Inc. - Product / Service
OCR Services Inc. - Key offerings
SWOT

15.14 Oracle Corp.

Oracle Corp. - Overview
Oracle Corp. - Business segments
Oracle Corp. - Key news
Oracle Corp. - Key offerings
Oracle Corp. - Segment focus
SWOT

15.15 QAD Inc.

QAD Inc. - Overview
QAD Inc. - Product / Service
QAD Inc. - Key offerings
SWOT

15.16 SAP SE

SAP SE - Overview
SAP SE - Business segments
SAP SE - Key news
SAP SE - Key offerings
SAP SE - Segment focus
SWOT

15.17 Thomson Reuters Corp.

Thomson Reuters Corp. - Overview
Thomson Reuters Corp. - Business segments
Thomson Reuters Corp. - Key news
Thomson Reuters Corp. - Key offerings
Thomson Reuters Corp. - Segment focus
SWOT

15.18 WiseTech Global Ltd.

WiseTech Global Ltd. - Overview
WiseTech Global Ltd. - Product / Service
WiseTech Global Ltd. - Key offerings
SWOT

16. Appendix

16.1 Scope of the report

Market definition
Objectives
Notes and caveats

16.2 Inclusions and exclusions checklist

Inclusions checklist
Exclusions checklist

16.3 Currency conversion rates for US$

16.4 Research methodology

16.5 Data procurement

Information sources

16.6 Data validation

16.7 Validation techniques employed for market sizing

16.8 Data synthesis

16.9 360 degree market analysis

16.10 List of abbreviations

Research Methodology

Technavio presents a detailed picture of the market by way of study, synthesis, and summation of data from multiple sources. The analysts have presented the various facets of the market with a particular focus on identifying the key industry influencers. The data thus presented is comprehensive, reliable, and the result of extensive research, both primary and secondary.

INFORMATION SOURCES

Primary sources

  • Manufacturers and suppliers
  • Channel partners
  • Industry experts
  • Strategic decision makers

Secondary sources

  • Industry journals and periodicals
  • Government data
  • Financial reports of key industry players
  • Historical data
  • Press releases

DATA ANALYSIS

Data Synthesis

  • Collation of data
  • Estimation of key figures
  • Analysis of derived insights

Data Validation

  • Triangulation with data models
  • Reference against proprietary databases
  • Corroboration with industry experts

REPORT WRITING

Qualitative

  • Market drivers
  • Market challenges
  • Market trends
  • Five forces analysis

Quantitative

  • Market size and forecast
  • Market segmentation
  • Geographical insights
  • Competitive landscape

Interested in this report?

Get your sample now to see our research methodology and insights!

Download Now

Frequently Asked Questions

Cross-border Trade Compliance Automation market growth will increase by USD 1749.1 million during 2026-2030.

The Cross-border Trade Compliance Automation market is expected to grow at a CAGR of 12.8% during 2026-2030.

Cross-border Trade Compliance Automation market is segmented by Component (Software, Services) Deployment (Cloud based, On premises) Application (Import and export management, Customs management, Trade compliance, Others)

AEB SE, AP Moller Maersk AS, Avalara Inc., British Standards Institution, CustomsCity Global Solutions Inc, Descartes Systems Group Inc., E2open Parent Holdings Inc., Expeditors International Inc., Flexport Inc., IBM Corp., iGlobal Exports LLC, Livingston International Inc., OCR Services Inc., Oracle Corp., Pitney Bowes Inc., QAD Inc., SAP SE, Sayari Labs Inc, Thomson Reuters Corp., WiseTech Global Ltd. are a few of the key vendors in the Cross-border Trade Compliance Automation market.

North America will register the highest growth rate of 37.1% among the other regions. Therefore, the Cross-border Trade Compliance Automation market in North America is expected to garner significant business opportunities for the vendors during the forecast period.

US, Canada, Mexico, Germany, UK, France, Italy, Spain, The Netherlands, China, Japan, India, South Korea, Australia, Indonesia, UAE, Saudi Arabia, South Africa, Israel, Turkey, Brazil, Argentina, Colombia

  • Heightened regulatory complexity and evolution of global trade mandates is the driving factor this market.

The Cross-border Trade Compliance Automation market vendors should focus on grabbing business opportunities from the Component segment as it accounted for the largest market share in the base year.
RIA - Research AI Assistant
Ask RIA