Dairy Desserts Market Size 2025-2029
The dairy desserts market size is forecast to increase by USD 1.46 billion at a CAGR of 5.3% between 2024 and 2029.
- The market is experiencing growth, driven primarily by the increasing demand for convenient and indulgent food options. Consumers' preference for desserts made from natural and high-quality ingredients, particularly dairy, is fueling market expansion. Furthermore, the growing number of companies entering the market, offering innovative and diverse product ranges, is intensifying competition. However, the market is not without challenges. The rising number of product recalls due to contamination issues poses a significant threat to market players, necessitating stringent quality control measures.
- To capitalize on market opportunities and navigate challenges effectively, companies must focus on product innovation, sustainable sourcing, and quality control systems. By addressing these trends and challenges, players can differentiate themselves in the competitive landscape and capture a larger share of the growing the market.
What will be the Size of the Dairy Desserts Market during the forecast period?

- The market encompasses a wide range of sweet treats, including ice cream, yoghurts, custard, and chocolates, among others. This market continues to experience growth, driven by consumers' increasing preference for convenient, indulgent, and nutrient-rich dessert options. Protein-fortified and low-fat dairy desserts are gaining popularity among health-conscious consumers, who seek to balance their sweet cravings with essential nutrients like calcium, potassium, magnesium, phosphorus, and various vitamins, such as Vitamin A and Vitamin D. Fruit-flavored and vegan dairy desserts cater to diverse consumer preferences and dietary needs. High-pressure processing and other advanced technologies ensure product safety and extended shelf life, while premium ice creams and specialty stores cater to consumers seeking unique and gourmet dessert experiences.
- Food service channels, including restaurants and boutique shops, also contribute significantly to the market's growth, as they offer a wide variety of dairy desserts and customizable options. Overall, the market is expected to continue its upward trajectory, driven by consumers' evolving preferences and the industry's ongoing innovation in taste, texture, and health benefits.
How is this Dairy Desserts Industry segmented?
The dairy desserts industry research report provides comprehensive data (region-wise segment analysis), with forecasts and estimates in "USD million" for the period 2025-2029, as well as historical data from 2019-2023 for the following segments.
- Product
- Yogurt
- Cream
- Others
- Distribution Channel
- Offline
- Online
- Type
- Ice cream
- Cheesecakes
- Frozen desserts
- Mousses
- Others
- Packaging
- Cup
- Pack
- Bottle
- Geography
- Europe
- France
- Germany
- Italy
- UK
- North America
- US
- Canada
- APAC
- China
- India
- Japan
- South America
- Brazil
- Middle East and Africa
- Europe
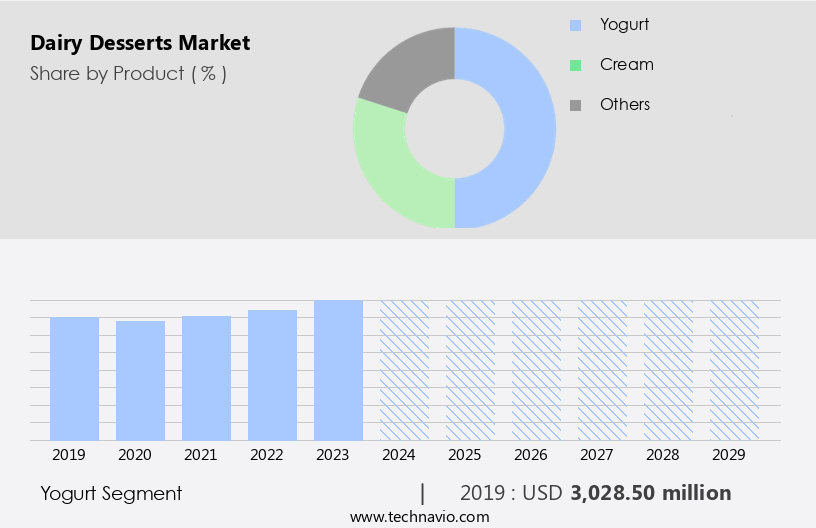
By Product Insights
The yogurt segment is estimated to witness significant growth during the forecast period.
Yogurt, a dairy product created through the bacterial fermentation of milk, has gained considerable popularity worldwide due to its numerous health benefits. Made from various milk types, including skim and whole, fat-free and full-fat yogurts cater to diverse consumer preferences. The fermentation process, using Lactobacillus bulgaricus and Streptococcus thermophilus, results in a nutrient-rich food source. Yogurt is an excellent provider of essential nutrients like vitamin B12, phosphorus, and calcium, contributing to bone health and immune system support. Health consciousness and increasing awareness of yogurt's role in managing conditions such as osteoporosis and irritable bowel syndrome have fueled its global consumption.
Consumers seek out yogurt in various formats, from supermarkets and hypermarkets to boutique shops and convenience stores. The market encompasses a wide range of flavors, including vanilla, fruits, and spices, catering to diverse tastes. Low-fat and plant-based alternatives, such as those made with soy milk, almond milk, and coconut milk, cater to consumers following lactose-free or vegan diets. Premium ice creams and custards, often fortified with vitamins A, D, and E, offer indulgent sweet treats with added health benefits. The market also includes chocolates, catering to consumers with different dietary needs and preferences. The increasing urbanization and lifestyle changes have led to a growing demand for convenient, ready-to-eat dessert options.
As consumers become more health-conscious, dairy desserts with reduced calorie, sugar, and cholesterol levels are gaining traction. The market also caters to those with allergies, offering lactose-free, nut-free, and gluten-free options. In , the market is driven by consumers' evolving preferences, health awareness, and the availability of diverse options catering to various dietary needs and lifestyles.
Get a glance at the market report of share of various segments Request Free Sample
The Yogurt segment was valued at USD 3.03 billion in 2019 and showed a gradual increase during the forecast period.
Regional Analysis
Europe is estimated to contribute 35% to the growth of the global market during the forecast period.Technavio’s analysts have elaborately explained the regional trends and drivers that shape the market during the forecast period.

For more insights on the market size of various regions, Request Free Sample
The market in Europe is witnessing significant growth as consumers increasingly opt for healthier alternatives to traditional dairy products. Plant-based dairy desserts, such as almond milk, soy milk, and coconut milk, are gaining popularity due to their calcium, vitamin, and protein content. European suppliers are responding to this trend by investing in research and development to enhance the taste, texture, and nutritional value of vegan alternatives. For instance, the European Union recently invested USD5.23 million in the Delicious project to improve the taste and texture of vegan cheese and kefir through advanced fermentation techniques. As health awareness increases and consumers adopt plant-based diets, dairy desserts made from lactose-free sources are becoming a preferred choice for sweet treats.
This shift is not limited to supermarkets and grocery stores but is also influencing food service channels, including restaurants and boutique shops. Additionally, consumers with allergies or intolerances to dairy, such as lactose intolerance or allergies to certain proteins, are driving demand for these alternatives. The market for dairy desserts is expanding to include a diverse range of flavors, from classic vanilla and chocolate to more exotic fruits and spices. Low-fat and high-protein desserts are also gaining popularity, particularly among those following specific diets, such as vegan or muscle-building regimens. Essential nutrients like calcium, phosphorus, magnesium, potassium, and vitamins A and D are crucial for maintaining a healthy immune system and overall wellbeing.
The convenience offered by dairy desserts, particularly in the form of single-serve containers and long shell life, makes them a popular choice for consumers seeking sweet indulgences without compromising their health or lifestyle.
Market Dynamics
Our researchers analyzed the data with 2024 as the base year, along with the key drivers, trends, and challenges. A holistic analysis of drivers will help companies refine their marketing strategies to gain a competitive advantage.
What are the key market drivers leading to the rise in the adoption of Dairy Desserts Industry?
- Rising demand for convenience is the key driver of the market.
- The market is experiencing significant growth due to the increasing demand for convenient and indulgent treats. In today's hectic world, consumers seek quick and easy meal and snack options that fit into their busy lifestyles. Dairy desserts, including ready-to-eat puddings, yogurt-based desserts, and ice cream, offer a convenient solution for those desiring indulgent yet hassle-free options. These products are typically pre-packaged and require minimal preparation, making them perfect for on-the-go consumption or as a quick snack at home.
- This convenience factor has contributed to the popularity of dairy desserts, particularly in urban areas where consumers are continuously searching for ways to save time while satisfying their cravings. The market's growth can be attributed to the rising demand for convenient and indulgent treats, making it an attractive investment opportunity for companies.
What are the market trends shaping the Dairy Desserts Industry?
- Expansion of companies offering dairy desserts is the upcoming market trend.
- The market is experiencing significant growth due to the increasing number of companies introducing new and innovative dairy-based treat offerings. Established players like Danone and Unilever have expanded their product lines to cater to the rising consumer demand for indulgent yet accessible desserts. Unilever, with its brands Ben & Jerry and Magnum, has been at the forefront of innovation, launching more sustainable and healthier dairy dessert options, appealing to consumers seeking guilt-free indulgence.
- Newer entrants have also made their mark in the market, contributing to its expansion. Companies are focusing on product innovation and sustainability to meet the evolving preferences of consumers.
What challenges does the Dairy Desserts Industry face during its growth?
- Increasing number of product recalls is a key challenge affecting the industry growth.
- Dairy desserts, a popular category in the food industry, require careful handling of raw materials to ensure consumer safety and product quality. Manufacturers source essential ingredients, such as milk, fruits, and vegetables, from external companies. The improper handling of these supplies can lead to food safety issues, potentially resulting in regulatory actions, recalls, or even business closures. For instance, in 2023, Cadbury, a Mondelez brand in the UK, recalled six dairy desserts due to the possible presence of listeria monocytogenes bacteria.
- Consumption of food contaminated with this bacteria can lead to listeriosis, causing symptoms like flu, high temperature, and muscle pain. Ensuring the highest standards of raw material handling is crucial for dairy dessert manufacturers to maintain a strong market presence and consumer trust.
Exclusive Customer Landscape
The dairy desserts market forecasting report includes the adoption lifecycle of the market, covering from the innovator’s stage to the laggard’s stage. It focuses on adoption rates in different regions based on penetration. Furthermore, the dairy desserts market report also includes key purchase criteria and drivers of price sensitivity to help companies evaluate and develop their market growth analysis strategies.

Customer Landscape
Key Companies & Market Insights
Companies are implementing various strategies, such as strategic alliances, dairy desserts market forecast, partnerships, mergers and acquisitions, geographical expansion, and product/service launches, to enhance their presence in the industry.
Becoolz Ice Creams and Frozen Desserts - The company specializes in producing a diverse range of desserts, including Vanilla, Mango, and Kesar Pista, under the dairy category. These offerings showcase a rich and authentic taste experience for consumers. The company's commitment to quality and innovation sets it apart in the dessert industry.
The industry research and growth report includes detailed analyses of the competitive landscape of the market and information about key companies, including:
- Becoolz Ice Creams and Frozen Desserts
- Chobani Global Holdings LLC
- Conagra Brands Inc.
- Coolhull Farm
- DANA Dairy Group Ltd.
- Danone SA
- Dodla Dairy Limited
- General Mills Inc.
- Gujarat Cooperative Milk Marketing Federation Ltd.
- Iceland Foods Ltd.
- Mondelez International Inc.
- Mother Dairy Fruit and Vegetable Pvt. Ltd.
- Nestle SA
- Royal FrieslandCampina NV
- Silver Pail Dairy
- Siveele BV
- The Kraft Heinz Co.
- Turkey Hill Dairy
- Unilever PLC
- Unternehmensgruppe Theo Muller
Qualitative and quantitative analysis of companies has been conducted to help clients understand the wider business environment as well as the strengths and weaknesses of key industry players. Data is qualitatively analyzed to categorize companies as pure play, category-focused, industry-focused, and diversified; it is quantitatively analyzed to categorize companies as dominant, leading, strong, tentative, and weak.
Research Analyst Overview
Dairy desserts have long been a staple in the global food industry, providing consumers with a wide range of sweet and indulgent treats. These desserts, which include yoghurts, cream, custard, ice cream, and puddings, among others, offer various health benefits and cater to diverse consumer preferences. The production of dairy desserts involves the use of milk from livestock, such as cows, goats, and sheep. High pressure processing (HPP) is a modern technology employed in the production of these desserts to ensure their safety and prolong their shelf life. HPP subjects the desserts to high pressure, eliminating harmful bacteria while preserving their nutritional value and natural flavors.
Dairy desserts are rich sources of essential nutrients, including calcium, phosphorus, magnesium, potassium, and vitamins A and D. They are also a significant source of protein, making them an ideal choice for individuals seeking muscle growth and recovery. However, some consumers are turning to plant-based alternatives, such as soy milk, almond milk, and coconut milk, due to dietary restrictions or lifestyle choices. The market for dairy desserts is diverse and caters to various consumer segments. Supermarkets and hypermarkets are the primary retail channels for these desserts, offering a wide range of options at competitive prices. Consumers can also find dairy desserts in convenience stores, specialty shops, and food service channels, such as restaurants and cafes.
The health consciousness of consumers is a significant driver of the market. Many consumers are seeking desserts that offer health benefits, such as low-fat options, reduced sugar content, and added vitamins and minerals. Dairy desserts can be fortified with essential nutrients, such as vitamin A, calcium, and protein, to cater to this demand. The market for dairy desserts is also influenced by lifestyle trends, such as the rise of veganism and lactose intolerance. Vegan consumers are turning to plant-based alternatives, such as soy milk and almond milk, for their desserts. Lactose intolerant consumers, on the other hand, require dairy-free options or lactose-reduced desserts to enjoy their favorite sweet treats.
The market for dairy desserts is dynamic, with new flavors and innovations constantly emerging. Vanilla, chocolate, and fruit are popular flavors, but consumers are also seeking out more exotic and unique flavors, such as spices and nuts. Premium ice creams and custards are also gaining popularity, offering consumers a more indulgent and luxurious dessert experience. In , the market for dairy desserts is diverse and dynamic, catering to various consumer preferences and lifestyle trends. The use of technology, such as high pressure processing, ensures the safety and prolonged shelf life of these desserts, while fortification with essential nutrients adds to their health benefits.
The market is influenced by various factors, including health consciousness, lifestyle trends, and consumer preferences, making it an exciting and ever-evolving industry.
|
Market Scope |
|
|
Report Coverage |
Details |
|
Page number |
244 |
|
Base year |
2024 |
|
Historic period |
2019-2023 |
|
Forecast period |
2025-2029 |
|
Growth momentum & CAGR |
Accelerate at a CAGR of 5.3% |
|
Market growth 2025-2029 |
USD 1460.8 million |
|
Market structure |
Fragmented |
|
YoY growth 2024-2025(%) |
4.9 |
|
Key countries |
US, Canada, Germany, UK, India, France, China, Japan, Italy, and Brazil |
|
Competitive landscape |
Leading Companies, Market Positioning of Companies, Competitive Strategies, and Industry Risks |
What are the Key Data Covered in this Dairy Desserts Market Research and Growth Report?
- CAGR of the Dairy Desserts industry during the forecast period
- Detailed information on factors that will drive the growth and forecasting between 2025 and 2029
- Precise estimation of the size of the market and its contribution of the industry in focus to the parent market
- Accurate predictions about upcoming growth and trends and changes in consumer behaviour
- Growth of the market across Europe, North America, APAC, South America, and Middle East and Africa
- Thorough analysis of the market’s competitive landscape and detailed information about companies
- Comprehensive analysis of factors that will challenge the dairy desserts market growth of industry companies
We can help! Our analysts can customize this dairy desserts market research report to meet your requirements.
 RIA -
RIA - 
