Defense IT Spending Market Analysis, Size, and Forecast 2026-2030: North America (US, Canada, and Mexico), APAC (China, Japan, and India), Europe (Germany, UK, and France), Middle East and Africa (Saudi Arabia, Israel, and UAE), South America (Brazil and Argentina), and Rest of World (ROW)

Defense IT Spending Market Analysis, Size, and Forecast 2026-2030:
North America (US, Canada, and Mexico), APAC (China, Japan, and India), Europe (Germany, UK, and France), Middle East and Africa (Saudi Arabia, Israel, and UAE), South America (Brazil and Argentina), and Rest of World (ROW)

Published: May 2026 313 Pages SKU: IRTNTR76743

Market Overview at a Glance

$26.88 B
Market Opportunity
4.7%
CAGR 2025 - 2030
46.3%
North America Growth
$40.40 B
Service segment 2024

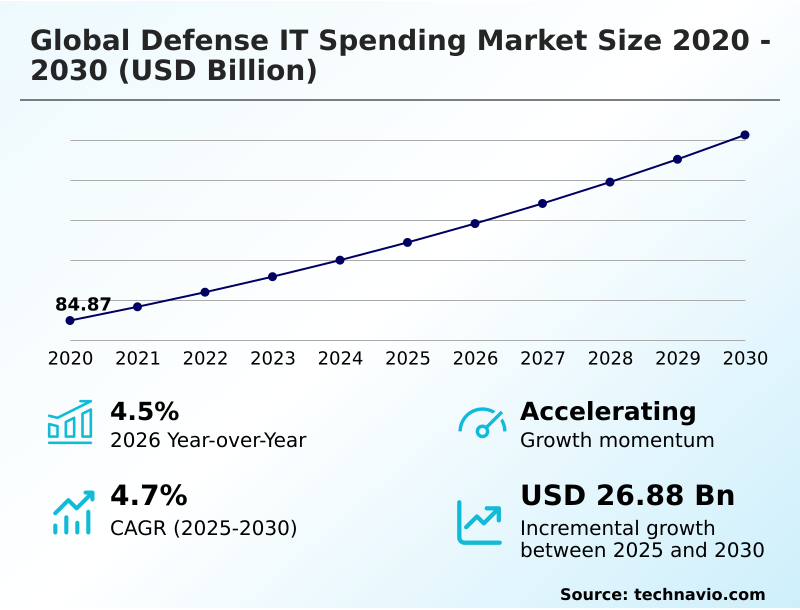
Defense IT Spending Market Size 2026-2030

The defense it spending market size is valued to increase by USD 26.88 billion, at a CAGR of 4.7% from 2025 to 2030. Proliferation of generative artificial intelligence and autonomous combat systems will drive the defense it spending market.

Major Market Trends & Insights

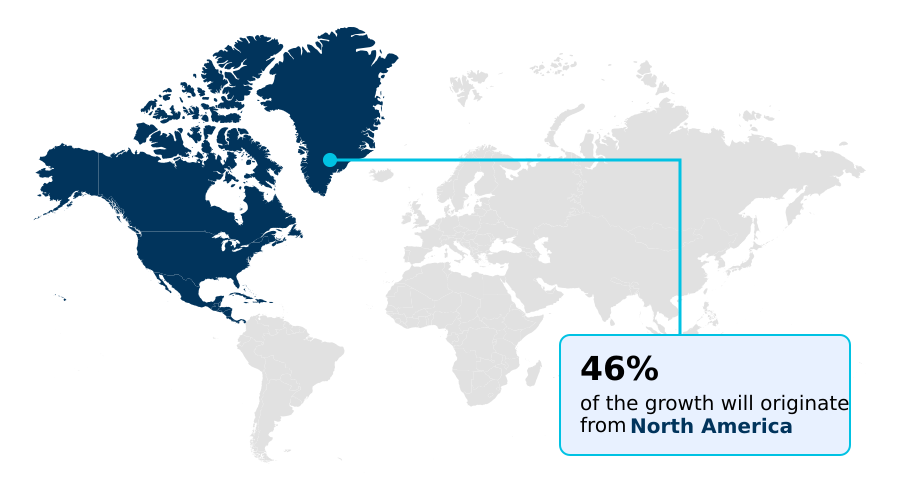
  • North America dominated the market and accounted for a 46.3% growth during the forecast period.
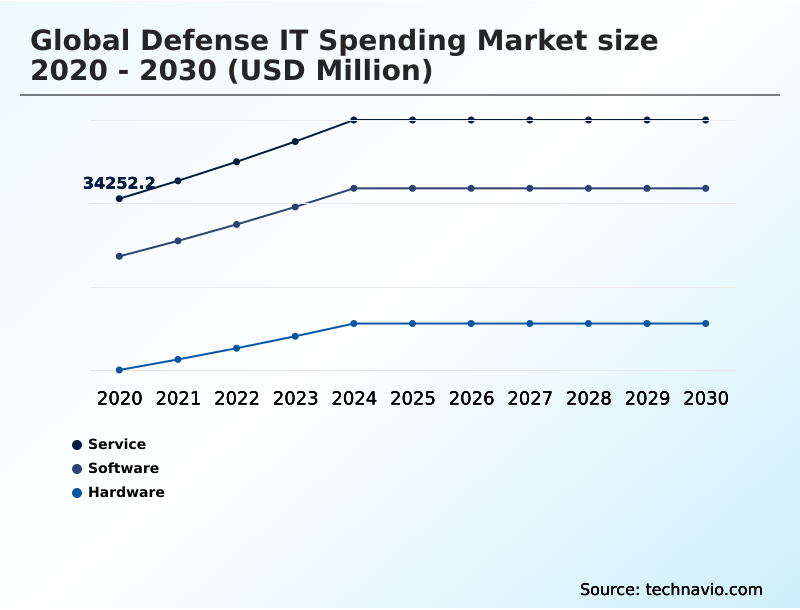
  • By Type - Service segment was valued at USD 40.40 billion in 2024
  • By Application - Cyber security segment accounted for the largest market revenue share in 2024

Market Size & Forecast

  • Market Opportunities: USD 46.40 billion
  • Market Future Opportunities: USD 26.88 billion
  • CAGR from 2025 to 2030 : 4.7%

Market Summary

  • The defense IT spending market is undergoing a structural transformation, prioritizing digital frameworks that enable secure communication, data processing, and tactical decision-making. This shift is driven by the operational necessity for AI-driven predictive modeling and the implementation of zero trust architecture to counter sophisticated cyber threats.
  • Key trends include the move toward tactical edge computing and software-defined platforms, which enhance real-time situational awareness and allow for rapid system updates.
  • For instance, a multinational joint force can leverage a unified, secure data lake within a hybrid cloud environment to coordinate logistics, track assets via the internet of military things (IoMT), and execute predictive maintenance algorithms, ensuring peak operational readiness. However, navigating complex data sovereignty mandates while maintaining interoperability across allied networks presents a significant hurdle.
  • The market's evolution reflects a strategic pivot from hardware-centric models to intelligent, software-defined systems like C4ISR systems and agentic teammates that deliver a decisive advantage in modern warfare.

What will be the Size of the Defense IT Spending Market during the forecast period?

Get Key Insights on Market Forecast (PDF) Request Free Sample

How is the Defense IT Spending Market Segmented?

The defense it spending industry research report provides comprehensive data (region-wise segment analysis), with forecasts and estimates in "USD million" for the period 2026-2030, as well as historical data from 2020-2024 for the following segments.

  • Type
    • Service
    • Software
    • Hardware
  • Application
    • Cyber security
    • IT infrastructure
    • Logistic and asset management
    • Others
  • Deployment
    • On-premises
    • Cloud
  • Geography
    • North America
      • US
      • Canada
      • Mexico
    • APAC
      • China
      • Japan
      • India
    • Europe
      • Germany
      • UK
      • France
    • Middle East and Africa
      • Saudi Arabia
      • Israel
      • UAE
    • South America
      • Brazil
      • Argentina
    • Rest of World (ROW)

By Type Insights

The service segment is estimated to witness significant growth during the forecast period.

The service segment underpins the operational backbone of defense IT spending, focusing on professional consulting, systems integration, and managed security services. As defense agencies pivot from legacy architectures, demand intensifies for specialized support in complex cloud migrations and achieving multi-domain operations.

This shift is increasingly defined by as-a-service models, allowing military organizations to leverage cutting-edge capabilities like battlefield management systems and encrypted tactical communications without incurring prohibitive infrastructure ownership costs.

Managed detection and response (MDR) and advisory services concerning digital sovereignty are becoming critical components.

These services improve threat response times by over 25% as geopolitical tensions necessitate localized yet interconnected digital defense postures using solutions like cross-domain security solutions and AI-augmented planning.

Request Free Sample

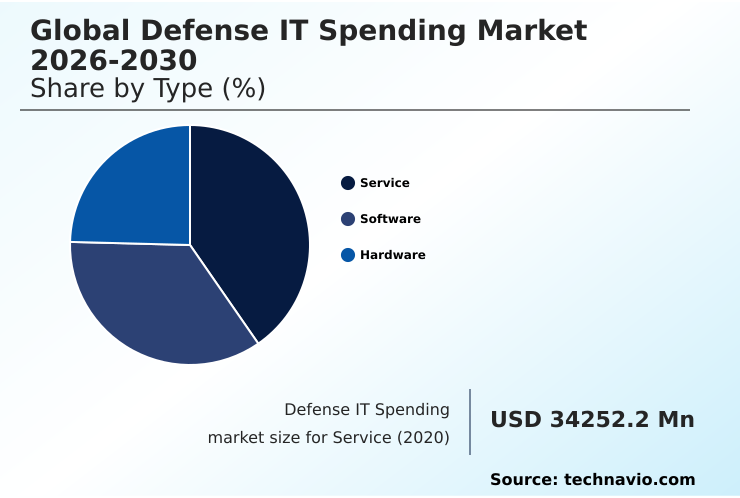
The Service segment was valued at USD 40.40 billion in 2024 and showed a gradual increase during the forecast period.

Request Free Sample

Regional Analysis

North America is estimated to contribute 46.3% to the growth of the global market during the forecast period.Technavio’s analysts have elaborately explained the regional trends and drivers that shape the market during the forecast period.

See How Defense IT Spending Market Demand is Rising in North America Request Free Sample

The global defense IT spending market is geographically dominated by North America, which accounts for over 46% of expenditures, driven by large-scale modernization programs focused on achieving information superiority.

Concurrently, the APAC region is exhibiting the fastest growth, with nations investing heavily in indigenous defensive cyber capabilities and resilient communications to address regional tensions.

In Europe, the focus is on strategic autonomy and interoperability standards, with a goal to increase cross-border data sharing efficiency by 15%.

Across these regions, the deployment of tactical edge computing in forward-operating bases has cut data latency by over 60%, enhancing situational awareness.

This global landscape reflects a unified push toward digital sovereignty, with nations adopting advanced C4ISR systems and secure satellite communications to protect their interests.

Market Dynamics

Our researchers analyzed the data with 2025 as the base year, along with the key drivers, trends, and challenges. A holistic analysis of drivers will help companies refine their marketing strategies to gain a competitive advantage.

  • The imperative for command and control systems modernization is reshaping defense spending, pushing agencies to evaluate on-premises vs cloud defense IT solutions. The benefits of zero trust architecture implementation are becoming clear, offering a robust security posture against evolving threats.
  • A key focus is on tactical edge computing in defense, which brings processing power closer to the data source in contested environments. This is often paired with ruggedized hardware for contested environments to ensure system survivability.
  • AI in defense predictive maintenance is another critical area, optimizing fleet readiness and reducing operational costs, with modern systems demonstrating twice the analytical capacity of legacy platforms. The integration of generative AI for military simulations allows for more realistic and complex training scenarios. For advanced forces, JADC2 interoperability challenges and solutions are paramount for seamless multi-domain operations data fusion.
  • Ensuring cybersecurity for autonomous combat systems is non-negotiable, as is securing military IoT device networks. The adoption of digital twin for aircraft maintenance and the modernization of electronic warfare systems highlight the shift toward software-defined platforms in naval systems.
  • As this transition accelerates, leveraging geospatial intelligence platform benefits and enhancing battlefield management with AI will be essential for maintaining a strategic advantage.

What are the key market drivers leading to the rise in the adoption of Defense IT Spending Industry?

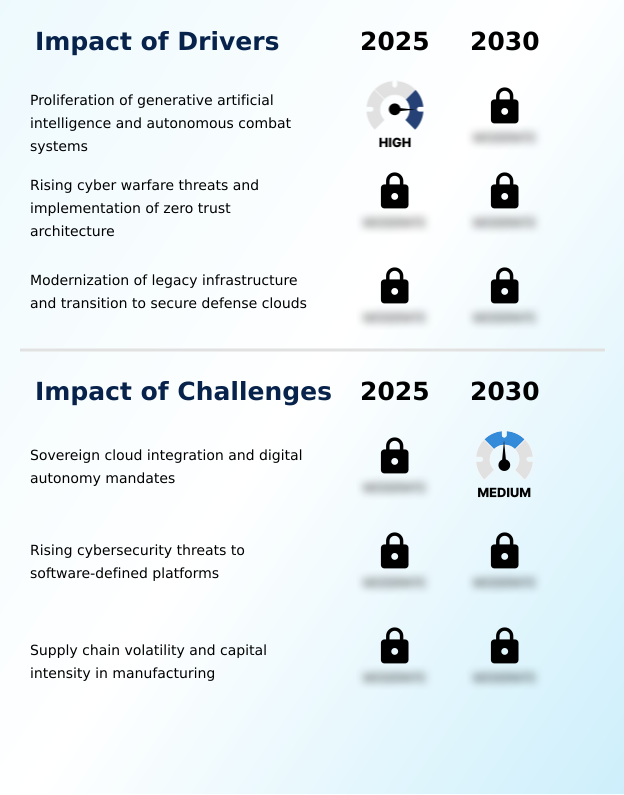
  • The proliferation of generative artificial intelligence and autonomous combat systems serves as a key driver for market growth.

  • The market is primarily propelled by the operationalization of generative artificial intelligence and autonomous combat systems. This drive toward intelligentized warfare and kill chain automation is a response to the increasing complexity of the modern cyber threat landscape.
  • Defense organizations are investing heavily in AI-ready infrastructure, with GenAI-powered simulations accelerating training cycles by up to 70%.
  • Another key driver is the modernization of legacy systems through migration to secure, scalable defense clouds, which underpins joint all-domain command and control (JADC2). This transition to cloud-native combat systems has reduced infrastructure maintenance costs by 35%.
  • Furthermore, the persistent threat of sophisticated cyberattacks is forcing the adoption of advanced cyber-physical systems security and threat intelligence platforms to maintain digital sovereignty and operational readiness.

What are the market trends shaping the Defense IT Spending Industry?

  • The proliferation of tactical edge computing is a key market trend. It is complemented by the deployment of ruggedized cloud infrastructure for contested environments.

  • A structural shift toward decentralization defines current market trends, led by the adoption of tactical edge computing and ruggedized cloud infrastructure. This move is essential for ensuring real-time situational awareness and decision support systems in contested environments where network access is unreliable. The deployment of AI-augmented planning tools has improved resource allocation accuracy by over 20%.
  • Concurrently, the mandatory implementation of zero trust architecture, which continuously validates every access request, has become a core acquisition requirement. This identity-centric security model, which has reduced insider threat incidents by 15%, is critical for protecting mission-critical workloads.
  • These trends, including the use of software-defined platforms and sensor data fusion, are driven by the need for faster, more secure, and autonomous operations at the tactical level, ensuring technological superiority.

What challenges does the Defense IT Spending Industry face during its growth?

  • The integration of sovereign clouds and the adherence to digital autonomy mandates present a key challenge affecting industry growth.

  • The market faces significant constraints, primarily the complexity of balancing commercial cloud scalability with stringent sovereign cloud architectures and data residency requirements. This challenge increases compliance overhead by an average of 15% and can hinder the seamless interoperability required for multi-domain operations.
  • Another major hurdle is the expanding attack surface created by software-defined defense, where the integration of AI introduces new vulnerabilities to adversarial machine learning. Securing these systems against advanced cyber threats in low-bandwidth environments is a persistent issue.
  • Additionally, global supply chain volatility for semiconductors and critical components has increased lead times by 25%, delaying the deployment of modernized hardware and command and control infrastructure, thereby impacting force modernization timelines.

Exclusive Technavio Analysis on Customer Landscape

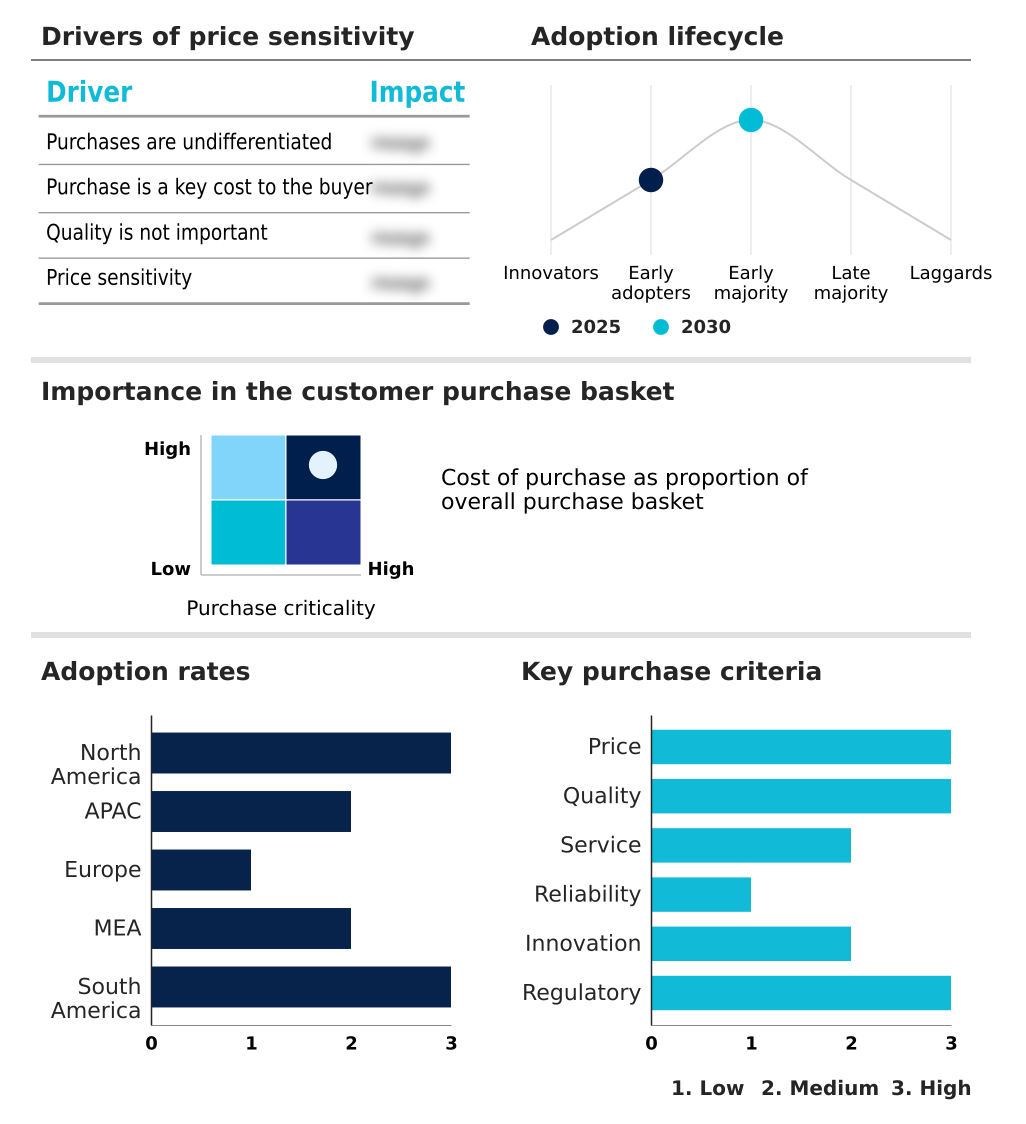
The defense it spending market forecasting report includes the adoption lifecycle of the market, covering from the innovator’s stage to the laggard’s stage. It focuses on adoption rates in different regions based on penetration. Furthermore, the defense it spending market report also includes key purchase criteria and drivers of price sensitivity to help companies evaluate and develop their market growth analysis strategies.

Customer Landscape of Defense IT Spending Industry

Competitive Landscape

Companies are implementing various strategies, such as strategic alliances, defense it spending market forecast, partnerships, mergers and acquisitions, geographical expansion, and product/service launches, to enhance their presence in the industry.

Amazon Web Services Inc. - Offerings include advanced cybersecurity solutions, integrated electronic systems, and intelligence IT platforms tailored for defense applications, enhancing operational readiness and information superiority.

The industry research and growth report includes detailed analyses of the competitive landscape of the market and information about key companies, including:

  • Amazon Web Services Inc.
  • BAE Systems Plc
  • Booz Allen Hamilton Corp.
  • CACI International Inc.
  • CGI Inc.
  • DXC Technology Co.
  • General Dynamics Corp.
  • IBM Corp.
  • Indra Group
  • L3Harris Technologies Inc.
  • Leidos Holdings Inc.
  • Leonardo S.p.A.
  • Lockheed Martin Corp.
  • Microsoft Corp.
  • Northrop Grumman Corp.
  • Oracle Corp.
  • Palantir Technologies Inc.
  • RTX Corp.
  • SAP SE
  • Thales Group

Qualitative and quantitative analysis of companies has been conducted to help clients understand the wider business environment as well as the strengths and weaknesses of key industry players. Data is qualitatively analyzed to categorize companies as pure play, category-focused, industry-focused, and diversified; it is quantitatively analyzed to categorize companies as dominant, leading, strong, tentative, and weak.

Recent Development and News in Defense it spending market

  • In November, 2024, Lockheed Martin announced a strategic partnership with a leading AI firm to accelerate the development of autonomous systems for reconnaissance missions, focusing on edge computing integration.
  • In April, 2025, the regional presence of international technology groups was bolstered by significant acquisitions, such as Visma’s expansion in Argentina, signaling a broader trend of digitizing operational frameworks within government sectors.
  • In May, 2025, the Microsoft Digital Crimes Unit collaborated with the United States Department of Justice and Europol to execute a landmark disruption operation against the Lumma Stealer malware-as-a-service platform.
  • In May, 2025, the Department of Defense launched the Software Fast Track (SWIFT) initiative to accelerate technical modernization by introducing automated continuous risk monitoring and zero trust compliance frameworks into the procurement cycle.

Dive into Technavio’s robust research methodology, blending expert interviews, extensive data synthesis, and validated models for unparalleled Defense IT Spending Market insights. See full methodology.

Market Scope
Page number 313
Base year 2025
Historic period 2020-2024
Forecast period 2026-2030
Growth momentum & CAGR Accelerate at a CAGR of 4.7%
Market growth 2026-2030 USD 26876.5 million
Market structure Fragmented
YoY growth 2025-2026(%) 4.5%
Key countries US, Canada, Mexico, China, Japan, India, South Korea, Australia, Indonesia, Germany, UK, France, Italy, Spain, The Netherlands, Saudi Arabia, Israel, UAE, Turkey, South Africa, Brazil, Argentina and Chile
Competitive landscape Leading Companies, Market Positioning of Companies, Competitive Strategies, and Industry Risks

Request Free Sample

Research Analyst Overview

  • The defense IT spending market is evolving from a hardware-centric model to one dominated by software-defined platforms and cognitive computing. This transition is driven by the need to manage vast data streams from the internet of military things (IoMT) and achieve digital overmatch in multi-domain operations.
  • Investments are concentrated in high-performance computing clusters and secure data lakes to support generative artificial intelligence and predictive maintenance algorithms. The mandatory adoption of zero trust architecture and post-quantum cryptography directly impacts boardroom decisions on long-term cybersecurity investments and compliance strategies, especially with the rise of adversarial machine learning threats.
  • Integrating technologies like agentic teammates and battlefield management systems into a cohesive C4ISR system is critical. Organizations leveraging these advanced frameworks have reported a 30% reduction in data processing times, enhancing their ability to conduct offensive cyber operations and maintain technological superiority. The focus remains on deploying ruggedized hardware and immersive training technologies to ensure force readiness.

What are the Key Data Covered in this Defense IT Spending Market Research and Growth Report?

  • What is the expected growth of the Defense IT Spending Market between 2026 and 2030?

    • USD 26.88 billion, at a CAGR of 4.7%

  • What segmentation does the market report cover?

    • The report is segmented by Type (Service, Software, and Hardware), Application (Cyber security, IT infrastructure, Logistic and asset management, and Others), Deployment (On-premises, and Cloud) and Geography (North America, APAC, Europe, Middle East and Africa, South America)

  • Which regions are analyzed in the report?

    • North America, APAC, Europe, Middle East and Africa and South America

  • What are the key growth drivers and market challenges?

    • Proliferation of generative artificial intelligence and autonomous combat systems, Sovereign cloud integration and digital autonomy mandates

  • Who are the major players in the Defense IT Spending Market?

    • Amazon Web Services Inc., BAE Systems Plc, Booz Allen Hamilton Corp., CACI International Inc., CGI Inc., DXC Technology Co., General Dynamics Corp., IBM Corp., Indra Group, L3Harris Technologies Inc., Leidos Holdings Inc., Leonardo S.p.A., Lockheed Martin Corp., Microsoft Corp., Northrop Grumman Corp., Oracle Corp., Palantir Technologies Inc., RTX Corp., SAP SE and Thales Group

Market Research Insights

  • The market's dynamics are shaped by a strategic shift toward data-centric warfare and digital overmatch, compelling force modernization across all domains. The adoption of advanced battlefield analytics has improved threat identification accuracy by 30%, while the integration of resilient communications ensures information superiority in contested environments.
  • This transition is supported by enhanced decision support systems, which have demonstrated a 20% reduction in response times for mission-critical workloads. As military organizations prioritize operational readiness and technological superiority, investments are increasingly directed toward technologies that facilitate network-centric warfare and secure the supply chain. These strategic imperatives drive the continuous evolution of defense IT infrastructure and its applications.

We can help! Our analysts can customize this defense it spending market research report to meet your requirements.

Get in touch

1. Executive Summary

1.1 Market overview

Executive Summary - Chart on Market Overview
Executive Summary - Data Table on Market Overview
Executive Summary - Chart on Global Market Characteristics
Executive Summary - Chart on Market by Geography
Executive Summary - Chart on Market Segmentation by Type
Executive Summary - Chart on Market Segmentation by Application
Executive Summary - Chart on Market Segmentation by Deployment
Executive Summary - Chart on Incremental Growth
Executive Summary - Data Table on Incremental Growth
Executive Summary - Chart on Company Market Positioning

2. Technavio Analysis

2.1 Analysis of price sensitivity, lifecycle, customer purchase basket, adoption rates, and purchase criteria

2.2 Criticality of inputs and Factors of differentiation

Chart on Overview on criticality of inputs and factors of differentiation

2.3 Factors of disruption

Chart on Overview on factors of disruption

2.4 Impact of drivers and challenges

Chart on Impact of drivers and challenges in 2025 and 2030

3. Market Landscape

3.1 Market ecosystem

Chart on Parent Market
Data Table on - Parent Market

3.2 Market characteristics

Chart on Market characteristics analysis

3.3 Value chain analysis

Chart on Value chain analysis

4. Market Sizing

4.1 Market definition

Data Table on Offerings of companies included in the market definition

4.2 Market segment analysis

Market segments

4.3 Market size 2025

4.4 Market outlook: Forecast for 2025-2030

Chart on Global - Market size and forecast 2025-2030 ($ million)
Data Table on Global - Market size and forecast 2025-2030 ($ million)
Chart on Global Market: Year-over-year growth 2025-2030 (%)
Data Table on Global Market: Year-over-year growth 2025-2030 (%)

5. Historic Market Size

5.1 Global Defense IT Spending Market 2020 - 2024

Historic Market Size - Data Table on Global Defense IT Spending Market 2020 - 2024 ($ million)

5.2 Type segment analysis 2020 - 2024

Historic Market Size - Type Segment 2020 - 2024 ($ million)

5.3 Application segment analysis 2020 - 2024

Historic Market Size - Application Segment 2020 - 2024 ($ million)

5.4 Deployment segment analysis 2020 - 2024

Historic Market Size - Deployment Segment 2020 - 2024 ($ million)

5.5 Geography segment analysis 2020 - 2024

Historic Market Size - Geography Segment 2020 - 2024 ($ million)

5.6 Country segment analysis 2020 - 2024

Historic Market Size - Country Segment 2020 - 2024 ($ million)

6. Qualitative Analysis

6.1 Impact of AI on global defense IT spending market

6.2 Impact of geopolitical conflict on global defense IT spending market

7. Five Forces Analysis

7.1 Five forces summary

Five forces analysis - Comparison between 2025 and 2030

7.2 Bargaining power of buyers

Bargaining power of buyers - Impact of key factors 2025 and 2030

7.3 Bargaining power of suppliers

Bargaining power of suppliers - Impact of key factors in 2025 and 2030

7.4 Threat of new entrants

Threat of new entrants - Impact of key factors in 2025 and 2030

7.5 Threat of substitutes

Threat of substitutes - Impact of key factors in 2025 and 2030

7.6 Threat of rivalry

Threat of rivalry - Impact of key factors in 2025 and 2030

7.7 Market condition

Chart on Market condition - Five forces 2025 and 2030

8. Market Segmentation by Type

8.1 Market segments

Chart on Type - Market share 2025-2030 (%)
Data Table on Type - Market share 2025-2030 (%)

8.2 Comparison by Type

Chart on Comparison by Type
Data Table on Comparison by Type

8.3 Service - Market size and forecast 2025-2030

Chart on Service - Market size and forecast 2025-2030 ($ million)
Data Table on Service - Market size and forecast 2025-2030 ($ million)
Chart on Service - Year-over-year growth 2025-2030 (%)
Data Table on Service - Year-over-year growth 2025-2030 (%)

8.4 Software - Market size and forecast 2025-2030

Chart on Software - Market size and forecast 2025-2030 ($ million)
Data Table on Software - Market size and forecast 2025-2030 ($ million)
Chart on Software - Year-over-year growth 2025-2030 (%)
Data Table on Software - Year-over-year growth 2025-2030 (%)

8.5 Hardware - Market size and forecast 2025-2030

Chart on Hardware - Market size and forecast 2025-2030 ($ million)
Data Table on Hardware - Market size and forecast 2025-2030 ($ million)
Chart on Hardware - Year-over-year growth 2025-2030 (%)
Data Table on Hardware - Year-over-year growth 2025-2030 (%)

8.6 Market opportunity by Type

Market opportunity by Type ($ million)
Data Table on Market opportunity by Type ($ million)

9. Market Segmentation by Application

9.1 Market segments

Chart on Application - Market share 2025-2030 (%)
Data Table on Application - Market share 2025-2030 (%)

9.2 Comparison by Application

Chart on Comparison by Application
Data Table on Comparison by Application

9.3 Cyber security - Market size and forecast 2025-2030

Chart on Cyber security - Market size and forecast 2025-2030 ($ million)
Data Table on Cyber security - Market size and forecast 2025-2030 ($ million)
Chart on Cyber security - Year-over-year growth 2025-2030 (%)
Data Table on Cyber security - Year-over-year growth 2025-2030 (%)

9.4 IT infrastructure - Market size and forecast 2025-2030

Chart on IT infrastructure - Market size and forecast 2025-2030 ($ million)
Data Table on IT infrastructure - Market size and forecast 2025-2030 ($ million)
Chart on IT infrastructure - Year-over-year growth 2025-2030 (%)
Data Table on IT infrastructure - Year-over-year growth 2025-2030 (%)

9.5 Logistic and asset management - Market size and forecast 2025-2030

Chart on Logistic and asset management - Market size and forecast 2025-2030 ($ million)
Data Table on Logistic and asset management - Market size and forecast 2025-2030 ($ million)
Chart on Logistic and asset management - Year-over-year growth 2025-2030 (%)
Data Table on Logistic and asset management - Year-over-year growth 2025-2030 (%)

9.6 Others - Market size and forecast 2025-2030

Chart on Others - Market size and forecast 2025-2030 ($ million)
Data Table on Others - Market size and forecast 2025-2030 ($ million)
Chart on Others - Year-over-year growth 2025-2030 (%)
Data Table on Others - Year-over-year growth 2025-2030 (%)

9.7 Market opportunity by Application

Market opportunity by Application ($ million)
Data Table on Market opportunity by Application ($ million)

10. Market Segmentation by Deployment

10.1 Market segments

Chart on Deployment - Market share 2025-2030 (%)
Data Table on Deployment - Market share 2025-2030 (%)

10.2 Comparison by Deployment

Chart on Comparison by Deployment
Data Table on Comparison by Deployment

10.3 On-premises - Market size and forecast 2025-2030

Chart on On-premises - Market size and forecast 2025-2030 ($ million)
Data Table on On-premises - Market size and forecast 2025-2030 ($ million)
Chart on On-premises - Year-over-year growth 2025-2030 (%)
Data Table on On-premises - Year-over-year growth 2025-2030 (%)

10.4 Cloud - Market size and forecast 2025-2030

Chart on Cloud - Market size and forecast 2025-2030 ($ million)
Data Table on Cloud - Market size and forecast 2025-2030 ($ million)
Chart on Cloud - Year-over-year growth 2025-2030 (%)
Data Table on Cloud - Year-over-year growth 2025-2030 (%)

10.5 Market opportunity by Deployment

Market opportunity by Deployment ($ million)
Data Table on Market opportunity by Deployment ($ million)

11. Customer Landscape

11.1 Customer landscape overview

Analysis of price sensitivity, lifecycle, customer purchase basket, adoption rates, and purchase criteria

12. Geographic Landscape

12.1 Geographic segmentation

Chart on Market share by geography 2025-2030 (%)
Data Table on Market share by geography 2025-2030 (%)

12.2 Geographic comparison

Chart on Geographic comparison
Data Table on Geographic comparison

12.3 North America - Market size and forecast 2025-2030

Chart on North America - Market size and forecast 2025-2030 ($ million)
Data Table on North America - Market size and forecast 2025-2030 ($ million)
Chart on North America - Year-over-year growth 2025-2030 (%)
Data Table on North America - Year-over-year growth 2025-2030 (%)
Chart on Regional Comparison - North America
Data Table on Regional Comparison - North America

12.3.1 US - Market size and forecast 2025-2030

Chart on US - Market size and forecast 2025-2030 ($ million)
Data Table on US - Market size and forecast 2025-2030 ($ million)
Chart on US - Year-over-year growth 2025-2030 (%)
Data Table on US - Year-over-year growth 2025-2030 (%)

12.3.2 Canada - Market size and forecast 2025-2030

Chart on Canada - Market size and forecast 2025-2030 ($ million)
Data Table on Canada - Market size and forecast 2025-2030 ($ million)
Chart on Canada - Year-over-year growth 2025-2030 (%)
Data Table on Canada - Year-over-year growth 2025-2030 (%)

12.3.3 Mexico - Market size and forecast 2025-2030

Chart on Mexico - Market size and forecast 2025-2030 ($ million)
Data Table on Mexico - Market size and forecast 2025-2030 ($ million)
Chart on Mexico - Year-over-year growth 2025-2030 (%)
Data Table on Mexico - Year-over-year growth 2025-2030 (%)

12.4 APAC - Market size and forecast 2025-2030

Chart on APAC - Market size and forecast 2025-2030 ($ million)
Data Table on APAC - Market size and forecast 2025-2030 ($ million)
Chart on APAC - Year-over-year growth 2025-2030 (%)
Data Table on APAC - Year-over-year growth 2025-2030 (%)
Chart on Regional Comparison - APAC
Data Table on Regional Comparison - APAC

12.4.1 China - Market size and forecast 2025-2030

Chart on China - Market size and forecast 2025-2030 ($ million)
Data Table on China - Market size and forecast 2025-2030 ($ million)
Chart on China - Year-over-year growth 2025-2030 (%)
Data Table on China - Year-over-year growth 2025-2030 (%)

12.4.2 Japan - Market size and forecast 2025-2030

Chart on Japan - Market size and forecast 2025-2030 ($ million)
Data Table on Japan - Market size and forecast 2025-2030 ($ million)
Chart on Japan - Year-over-year growth 2025-2030 (%)
Data Table on Japan - Year-over-year growth 2025-2030 (%)

12.4.3 India - Market size and forecast 2025-2030

Chart on India - Market size and forecast 2025-2030 ($ million)
Data Table on India - Market size and forecast 2025-2030 ($ million)
Chart on India - Year-over-year growth 2025-2030 (%)
Data Table on India - Year-over-year growth 2025-2030 (%)

12.4.4 South Korea - Market size and forecast 2025-2030

Chart on South Korea - Market size and forecast 2025-2030 ($ million)
Data Table on South Korea - Market size and forecast 2025-2030 ($ million)
Chart on South Korea - Year-over-year growth 2025-2030 (%)
Data Table on South Korea - Year-over-year growth 2025-2030 (%)

12.4.5 Australia - Market size and forecast 2025-2030

Chart on Australia - Market size and forecast 2025-2030 ($ million)
Data Table on Australia - Market size and forecast 2025-2030 ($ million)
Chart on Australia - Year-over-year growth 2025-2030 (%)
Data Table on Australia - Year-over-year growth 2025-2030 (%)

12.4.6 Indonesia - Market size and forecast 2025-2030

Chart on Indonesia - Market size and forecast 2025-2030 ($ million)
Data Table on Indonesia - Market size and forecast 2025-2030 ($ million)
Chart on Indonesia - Year-over-year growth 2025-2030 (%)
Data Table on Indonesia - Year-over-year growth 2025-2030 (%)

12.5 Europe - Market size and forecast 2025-2030

Chart on Europe - Market size and forecast 2025-2030 ($ million)
Data Table on Europe - Market size and forecast 2025-2030 ($ million)
Chart on Europe - Year-over-year growth 2025-2030 (%)
Data Table on Europe - Year-over-year growth 2025-2030 (%)
Chart on Regional Comparison - Europe
Data Table on Regional Comparison - Europe

12.5.1 Germany - Market size and forecast 2025-2030

Chart on Germany - Market size and forecast 2025-2030 ($ million)
Data Table on Germany - Market size and forecast 2025-2030 ($ million)
Chart on Germany - Year-over-year growth 2025-2030 (%)
Data Table on Germany - Year-over-year growth 2025-2030 (%)

12.5.2 UK - Market size and forecast 2025-2030

Chart on UK - Market size and forecast 2025-2030 ($ million)
Data Table on UK - Market size and forecast 2025-2030 ($ million)
Chart on UK - Year-over-year growth 2025-2030 (%)
Data Table on UK - Year-over-year growth 2025-2030 (%)

12.5.3 France - Market size and forecast 2025-2030

Chart on France - Market size and forecast 2025-2030 ($ million)
Data Table on France - Market size and forecast 2025-2030 ($ million)
Chart on France - Year-over-year growth 2025-2030 (%)
Data Table on France - Year-over-year growth 2025-2030 (%)

12.5.4 Italy - Market size and forecast 2025-2030

Chart on Italy - Market size and forecast 2025-2030 ($ million)
Data Table on Italy - Market size and forecast 2025-2030 ($ million)
Chart on Italy - Year-over-year growth 2025-2030 (%)
Data Table on Italy - Year-over-year growth 2025-2030 (%)

12.5.5 Spain - Market size and forecast 2025-2030

Chart on Spain - Market size and forecast 2025-2030 ($ million)
Data Table on Spain - Market size and forecast 2025-2030 ($ million)
Chart on Spain - Year-over-year growth 2025-2030 (%)
Data Table on Spain - Year-over-year growth 2025-2030 (%)

12.5.6 The Netherlands - Market size and forecast 2025-2030

Chart on The Netherlands - Market size and forecast 2025-2030 ($ million)
Data Table on The Netherlands - Market size and forecast 2025-2030 ($ million)
Chart on The Netherlands - Year-over-year growth 2025-2030 (%)
Data Table on The Netherlands - Year-over-year growth 2025-2030 (%)

12.6 Middle East and Africa - Market size and forecast 2025-2030

Chart on Middle East and Africa - Market size and forecast 2025-2030 ($ million)
Data Table on Middle East and Africa - Market size and forecast 2025-2030 ($ million)
Chart on Middle East and Africa - Year-over-year growth 2025-2030 (%)
Data Table on Middle East and Africa - Year-over-year growth 2025-2030 (%)
Chart on Regional Comparison - Middle East and Africa
Data Table on Regional Comparison - Middle East and Africa

12.6.1 Saudi Arabia - Market size and forecast 2025-2030

Chart on Saudi Arabia - Market size and forecast 2025-2030 ($ million)
Data Table on Saudi Arabia - Market size and forecast 2025-2030 ($ million)
Chart on Saudi Arabia - Year-over-year growth 2025-2030 (%)
Data Table on Saudi Arabia - Year-over-year growth 2025-2030 (%)

12.6.2 Israel - Market size and forecast 2025-2030

Chart on Israel - Market size and forecast 2025-2030 ($ million)
Data Table on Israel - Market size and forecast 2025-2030 ($ million)
Chart on Israel - Year-over-year growth 2025-2030 (%)
Data Table on Israel - Year-over-year growth 2025-2030 (%)

12.6.3 UAE - Market size and forecast 2025-2030

Chart on UAE - Market size and forecast 2025-2030 ($ million)
Data Table on UAE - Market size and forecast 2025-2030 ($ million)
Chart on UAE - Year-over-year growth 2025-2030 (%)
Data Table on UAE - Year-over-year growth 2025-2030 (%)

12.6.4 Turkey - Market size and forecast 2025-2030

Chart on Turkey - Market size and forecast 2025-2030 ($ million)
Data Table on Turkey - Market size and forecast 2025-2030 ($ million)
Chart on Turkey - Year-over-year growth 2025-2030 (%)
Data Table on Turkey - Year-over-year growth 2025-2030 (%)

12.6.5 South Africa - Market size and forecast 2025-2030

Chart on South Africa - Market size and forecast 2025-2030 ($ million)
Data Table on South Africa - Market size and forecast 2025-2030 ($ million)
Chart on South Africa - Year-over-year growth 2025-2030 (%)
Data Table on South Africa - Year-over-year growth 2025-2030 (%)

12.7 South America - Market size and forecast 2025-2030

Chart on South America - Market size and forecast 2025-2030 ($ million)
Data Table on South America - Market size and forecast 2025-2030 ($ million)
Chart on South America - Year-over-year growth 2025-2030 (%)
Data Table on South America - Year-over-year growth 2025-2030 (%)
Chart on Regional Comparison - South America
Data Table on Regional Comparison - South America

12.7.1 Brazil - Market size and forecast 2025-2030

Chart on Brazil - Market size and forecast 2025-2030 ($ million)
Data Table on Brazil - Market size and forecast 2025-2030 ($ million)
Chart on Brazil - Year-over-year growth 2025-2030 (%)
Data Table on Brazil - Year-over-year growth 2025-2030 (%)

12.7.2 Argentina - Market size and forecast 2025-2030

Chart on Argentina - Market size and forecast 2025-2030 ($ million)
Data Table on Argentina - Market size and forecast 2025-2030 ($ million)
Chart on Argentina - Year-over-year growth 2025-2030 (%)
Data Table on Argentina - Year-over-year growth 2025-2030 (%)

12.7.3 Chile - Market size and forecast 2025-2030

Chart on Chile - Market size and forecast 2025-2030 ($ million)
Data Table on Chile - Market size and forecast 2025-2030 ($ million)
Chart on Chile - Year-over-year growth 2025-2030 (%)
Data Table on Chile - Year-over-year growth 2025-2030 (%)

12.8 Market opportunity by geography

Market opportunity by geography ($ million)
Data Tables on Market opportunity by geography ($ million)

13. Drivers, Challenges, and Opportunity

13.1 Market drivers

Proliferation of generative artificial intelligence and autonomous combat systems
Rising cyber warfare threats and implementation of zero trust architecture
Modernization of legacy infrastructure and transition to secure defense clouds

13.2 Market challenges

Sovereign cloud integration and digital autonomy mandates
Rising cybersecurity threats to software-defined platforms
Supply chain volatility and capital intensity in manufacturing

13.3 Impact of drivers and challenges

Impact of drivers and challenges in 2025 and 2030

13.4 Market opportunities

Proliferation of tactical edge computing and ruggedized cloud infrastructure
Mandatory adoption of zero trust architectures and quantum-resilient cybersecurity
Acceleration of AI-augmented decision support and autonomous mission planning

14. Competitive Landscape

14.1 Overview

14.2

Overview on criticality of inputs and factors of differentiation

14.3 Landscape disruption

Overview on factors of disruption

14.4 Industry risks

Impact of key risks on business

15. Competitive Analysis

15.1 Companies profiled

Companies covered

15.2 Company ranking index

15.3 Market positioning of companies

Matrix on companies position and classification

15.4 BAE Systems Plc

BAE Systems Plc - Overview
BAE Systems Plc - Business segments
BAE Systems Plc - Key offerings
BAE Systems Plc - Segment focus
SWOT

15.5 CGI Inc.

CGI Inc. - Overview
CGI Inc. - Business segments
CGI Inc. - Key offerings
CGI Inc. - Segment focus
SWOT

15.6 General Dynamics Corp.

General Dynamics Corp. - Overview
General Dynamics Corp. - Business segments
General Dynamics Corp. - Key offerings
General Dynamics Corp. - Segment focus
SWOT

15.7 IBM Corp.

IBM Corp. - Overview
IBM Corp. - Business segments
IBM Corp. - Key news
IBM Corp. - Key offerings
IBM Corp. - Segment focus
SWOT

15.8 Indra Group

Indra Group - Overview
Indra Group - Product / Service
Indra Group - Key offerings
SWOT

15.9 L3Harris Technologies Inc.

L3Harris Technologies Inc. - Overview
L3Harris Technologies Inc. - Business segments
L3Harris Technologies Inc. - Key offerings
L3Harris Technologies Inc. - Segment focus
SWOT

15.10 Leidos Holdings Inc.

Leidos Holdings Inc. - Overview
Leidos Holdings Inc. - Business segments
Leidos Holdings Inc. - Key offerings
Leidos Holdings Inc. - Segment focus
SWOT

15.11 Leonardo S.p.A.

Leonardo S.p.A. - Overview
Leonardo S.p.A. - Business segments
Leonardo S.p.A. - Key offerings
Leonardo S.p.A. - Segment focus
SWOT

15.12 Lockheed Martin Corp.

Lockheed Martin Corp. - Overview
Lockheed Martin Corp. - Business segments
Lockheed Martin Corp. - Key offerings
Lockheed Martin Corp. - Segment focus
SWOT

15.13 Microsoft Corp.

Microsoft Corp. - Overview
Microsoft Corp. - Business segments
Microsoft Corp. - Key news
Microsoft Corp. - Key offerings
Microsoft Corp. - Segment focus
SWOT

15.14 Northrop Grumman Corp.

Northrop Grumman Corp. - Overview
Northrop Grumman Corp. - Business segments
Northrop Grumman Corp. - Key offerings
Northrop Grumman Corp. - Segment focus
SWOT

15.15 Oracle Corp.

Oracle Corp. - Overview
Oracle Corp. - Business segments
Oracle Corp. - Key news
Oracle Corp. - Key offerings
Oracle Corp. - Segment focus
SWOT

15.16 Palantir Technologies Inc.

Palantir Technologies Inc. - Overview
Palantir Technologies Inc. - Business segments
Palantir Technologies Inc. - Key offerings
Palantir Technologies Inc. - Segment focus
SWOT

15.17 RTX Corp.

RTX Corp. - Overview
RTX Corp. - Business segments
RTX Corp. - Key news
RTX Corp. - Key offerings
RTX Corp. - Segment focus
SWOT

15.18 Thales Group

Thales Group - Overview
Thales Group - Business segments
Thales Group - Key offerings
Thales Group - Segment focus
SWOT

16. Appendix

16.1 Scope of the report

Market definition
Objectives
Notes and caveats

16.2 Inclusions and exclusions checklist

Inclusions checklist
Exclusions checklist

16.3 Currency conversion rates for US$

16.4 Research methodology

16.5 Data procurement

Information sources

16.6 Data validation

16.7 Validation techniques employed for market sizing

16.8 Data synthesis

16.9 360 degree market analysis

16.10 List of abbreviations

Research Methodology

Technavio presents a detailed picture of the market by way of study, synthesis, and summation of data from multiple sources. The analysts have presented the various facets of the market with a particular focus on identifying the key industry influencers. The data thus presented is comprehensive, reliable, and the result of extensive research, both primary and secondary.

INFORMATION SOURCES

Primary sources

  • Manufacturers and suppliers
  • Channel partners
  • Industry experts
  • Strategic decision makers

Secondary sources

  • Industry journals and periodicals
  • Government data
  • Financial reports of key industry players
  • Historical data
  • Press releases

DATA ANALYSIS

Data Synthesis

  • Collation of data
  • Estimation of key figures
  • Analysis of derived insights

Data Validation

  • Triangulation with data models
  • Reference against proprietary databases
  • Corroboration with industry experts

REPORT WRITING

Qualitative

  • Market drivers
  • Market challenges
  • Market trends
  • Five forces analysis

Quantitative

  • Market size and forecast
  • Market segmentation
  • Geographical insights
  • Competitive landscape

Interested in this report?

Get your sample now to see our research methodology and insights!

Download Now

Frequently Asked Questions

Defense IT Spending market growth will increase by USD 26876.5 million during 2026-2030.

The Defense IT Spending market is expected to grow at a CAGR of 4.7% during 2026-2030.

Defense IT Spending market is segmented by Type (Service, Software, Hardware) Application (Cyber security, IT infrastructure, Logistic and asset management, Others) Deployment (On-premises, Cloud)

Amazon Web Services Inc., BAE Systems Plc, Booz Allen Hamilton Corp., CACI International Inc., CGI Inc., DXC Technology Co., General Dynamics Corp., IBM Corp., Indra Group, L3Harris Technologies Inc., Leidos Holdings Inc., Leonardo S.p.A., Lockheed Martin Corp., Microsoft Corp., Northrop Grumman Corp., Oracle Corp., Palantir Technologies Inc., RTX Corp., SAP SE, Thales Group are a few of the key vendors in the Defense IT Spending market.

North America will register the highest growth rate of 46.3% among the other regions. Therefore, the Defense IT Spending market in North America is expected to garner significant business opportunities for the vendors during the forecast period.

US, Canada, Mexico, China, Japan, India, South Korea, Australia, Indonesia, Germany, UK, France, Italy, Spain, The Netherlands, Saudi Arabia, Israel, UAE, Turkey, South Africa, Brazil, Argentina, Chile

  • Proliferation of generative artificial intelligence and autonomous combat systems is the driving factor this market.

The Defense IT Spending market vendors should focus on grabbing business opportunities from the Type segment as it accounted for the largest market share in the base year.
RIA - Research AI Assistant
Ask RIA