Digital Commerce Market Analysis APAC, North America, Europe, South America, Middle East and Africa - China, US, Japan, UK, Germany - Size and Forecast 2024-2028

Digital Commerce Market Analysis APAC, North America, Europe, South America, Middle East and Africa - China, US, Japan, UK, Germany - Size and Forecast 2024-2028

Published: Jun 2024 141 Pages SKU: IRTNTR74378

Market Overview at a Glance

$3634 B
Market Opportunity
16.6%
CAGR
13.86
YoY growth 2023-2024(%)

Digital Commerce Market Size 2024-2028 

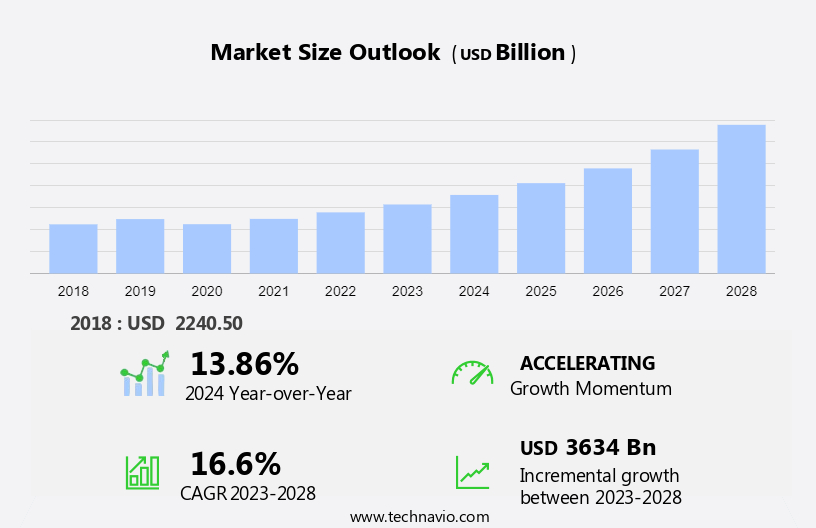
The digital commerce market size is forecast to increase by USD 3,634 billion at a CAGR of 16.6% between 2023 and 2028. The market is experiencing significant growth, driven by vigorous internet penetration and advancements in technological digital commerce platforms. The increasing use of smartphones and the convenience they offer for online shopping have contributed to the market's expansion. Additionally, the trend towards contactless transactions and social distancing during the COVID-19 pandemic has accelerated the shift towards digital commerce. Robotics and advanced technologies like smartphones and laptops facilitate seamless transactions. However, challenges persist, including growing data privacy and security concerns, which require strong security measures and transparency from digital commerce platforms to maintain consumer trust. The market's future growth is expected to be fueled by continued technological advancements and the increasing adoption of digital commerce solutions by businesses of all sizes.

Digital Commerce Market Size

 Request Free Sample

The market refers to the buying and selling of goods and services through an electronic network, specifically the Internet. This market encompasses various types of transactions, including Business-to-Consumer (B2C), Business-to-Business (B2B), Consumer-to-Business (C2B), and Consumer-to-Consumer (C2C). The market is driven by the increasing use of the Internet in homes and offices, and the widespread adoption of computers, tablets, cell phones, and broadband connections. E-commerce sector players require digital marketing expertise to establish an online presence and attract customers. Retailers in industries such as industrial and logistics are increasingly leveraging e-commerce to reach a broader audience. Women and social networking sites also play a significant role in driving e-business growth. Overall, the market is transforming traditional business models and offering new opportunities for businesses and consumers alike.

Market Segmentation

The market research report provides comprehensive data (region-wise segment analysis), with forecasts and estimates in "USD billion" for the period 2024-2028, as well as historical data from 2018-2022 for the following segments.
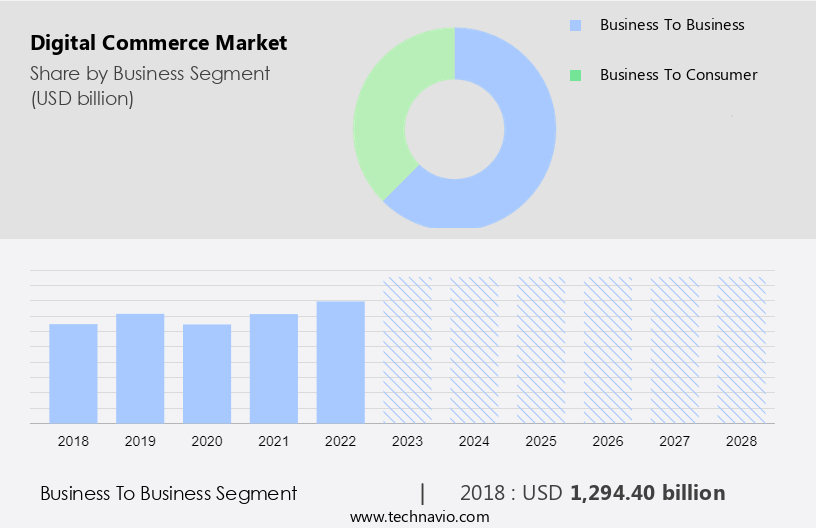
  • Business Segment
    • Business to business
    • Business to consumer
  • Geography
    • APAC
      • China
      • Japan
    • North America
      • US
    • Europe
      • Germany
      • UK
    • South America
    • Middle East and Africa

By Business Segment Insights

The business to business segment is estimated to witness significant growth during the forecast period. The market is experiencing significant growth due to the proliferation of smart phones, multiple payment modes, and cross-border e-commerce. CXOs are increasingly focusing on digital commerce visibility to expand their businesses, leveraging AI, machine learning, and in-memory technologies. Small and medium-sized businesses are embracing SaaS delivery models to enhance their online presence and reach a wider customer base. Cyber security issues and online frauds are major concerns, necessitating the implementation of advanced security measures such as block chain and memorandums of understanding with logistics, warehouse, and transportation service providers. Online sales are no longer limited to homes and offices, with the rise of mobile commerce, social commerce, and local commerce.

Additionally, digital marketing expertise is essential for retailers to effectively engage with consumers through web contacts, social media, and mobile payments. The e-commerce sector is transforming rapidly, offering immense opportunities for innovation and growth.

Digital Commerce Market Size

Get a glance at the market share of various segments Request Free Sample

The business to business segment accounted for USD 1,294.40 billion in 2018 and showed a gradual increase during the forecast period.

Regional Insights

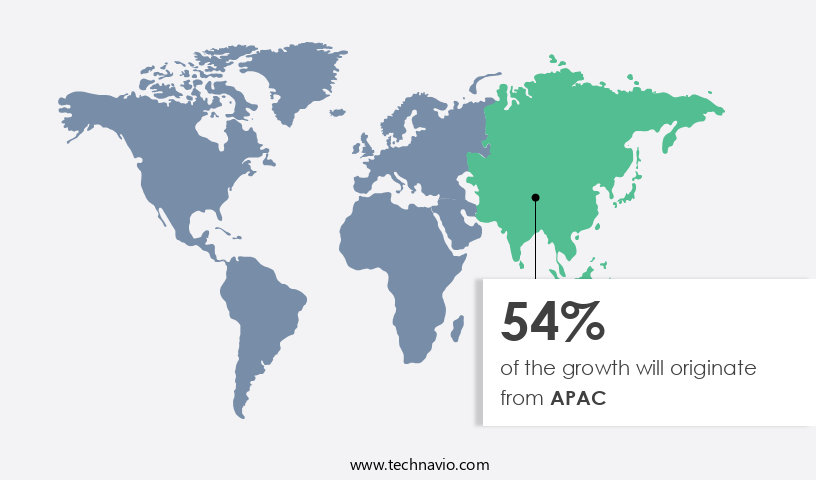
APAC is estimated to contribute 54% to the growth of the global market during the forecast period. Technavio's analysts have elaborately explained the regional trends and drivers that shape the market during the forecast period.

Digital Commerce Market Share by Geography

For more insights on the market share of various regions Request Free Sample

Digital commerce refers to the buying and selling of goods and services through an electronic network, specifically the Internet. This encompasses various business models such as business-to-consumer (B2C), business-to-business (B2B), consumer-to-business (C2B), and consumer-to-consumer (C2C). E-commerce and e-business are interchangeable terms used to describe this phenomenon, with e-tail being a specific term for businesses that sell products online. Digital commerce software and inventory management solutions facilitate the process, enabling retailers to manage sales and marketing efforts across multiple channels. The automotive segment, manufacturing, retail household goods, healthcare and pharmaceuticals, media and entertainment, food and beverage, and logistics companies are significant contributors to the digital commerce landscape.

Additionally, omni-channel players leverage digital technology to provide seamless shopping experiences, integrating browsing and payment methods on desktops, smartphones, and tablets. Payment methods include card payment, bank transfer, wallet payment, cash payment, and even crypto currency. Personalization technology and AI-based e-commerce solutions enhance the customer experience. Trading networks and automation streamline operations for increased efficiency.

Our researchers analyzed the data with 2023 as the base year, along with the key drivers, trends, and challenges. A holistic analysis of drivers will help companies refine their marketing strategies to gain a competitive advantage.

Market Driver

Strong Internet penetration is the key driver of the market. The market is experiencing significant growth due to the increasing use of smartphones and other smart devices, expanding online consumer base, and the availability of multiple payment modes. Cross-border ecommerce is gaining popularity, leading CXOs to prioritize cyber security issues and online fraud prevention. The e-commerce sector is witnessing a shift towards AI, machine learning, in-memory technologies, and blockchain for enhancing digital commerce visibility and ensuring secure transactions. Small and medium-sized businesses are adopting SaaS delivery models to expand their online presence and reach a wider audience. Logistics, warehouse, and transportation service providers are collaborating through memorandums of understanding to optimize supply chain operations and improve multi-enterprise visibility.

Additionally, online sales of computers, tablets, cellphones, and other consumer electronics are on the rise, fueled by digital marketing expertise and the increasing availability of broadband connections. Online marketplaces, consumer-to-consumer sales, direct selling, web contacts, social media, mobile commerce, and mobile payments are driving the growth of the e-commerce industry. Local commerce is also gaining traction as businesses adapt to the changing consumer behavior and preferences.

Market Trends

Advancements in technological digital commerce platforms is the upcoming trend in the market. The market has witnessed significant growth in recent years, driven by the widespread use of smart phones and multiple payment modes. Cross-border ecommerce has become increasingly popular, leading to cyber security issues and online frauds being a major concern for CXOs. To address these challenges, e-commerce players are leveraging advanced technologies such as AI, machine learning, and in-memory technologies. Memorandums of understanding between logistics, warehouse, and transportation service providers have become essential for ensuring multi-enterprise visibility and efficient delivery. Small and medium-sized businesses are also adopting SaaS delivery models to enhance their digital commerce visibility. Consumers are shopping online for various products, including homes and offices, computers, tablets, cellphones, and broadband connections.

Further, e-commerce retailers are focusing on building a strong online presence through digital marketing expertise and social media engagement. Mobile commerce, social commerce, and local commerce are also gaining traction, with online sales increasingly being made through mobile devices and mobile payments. Blockchain technology is revolutionizing the e-commerce sector by streamlining customs clearance and enabling secure transactions through smart contracts.

Market Challenge

Growing data privacy and security concerns is a key challenge affecting the market growth. Digital commerce, encompassing online sales through various devices and platforms, has seen significant growth in recent years. However, this expanding market is not without challenges. Cyber security issues, including online frauds, pose a major threat to both consumers and businesses. With the increasing use of smart phones for real-time transactions, data collected on these devices can be misused, leading to potential financial losses and privacy concerns. Payment service providers employ cookies to gather customer data, which, if mishandled, can compromise privacy. Cross-border ecommerce adds complexity with memorandums of understanding required between countries for seamless transactions. Small & medium-sized businesses and CXOs seek digital marketing expertise to boost their online presence and engage in multiple payment modes.

Besides, emerging technologies like AI, machine learning, block chain, and in-memory technologies offer solutions for enhancing digital commerce visibility and security. Logistics, warehouse, and transportation service providers play crucial roles in ensuring the efficient delivery of goods. Online sales span homes and offices, as well as computers, tablets, and cellphones, all requiring broadband connections. Social media and mobile commerce, including social commerce and local commerce, further expand the digital marketplace. Regulations and partnerships, such as those between online marketplaces and retailers, are essential for mitigating risks and fostering trust in the e-commerce sector.

Exclusive Customer Landscape

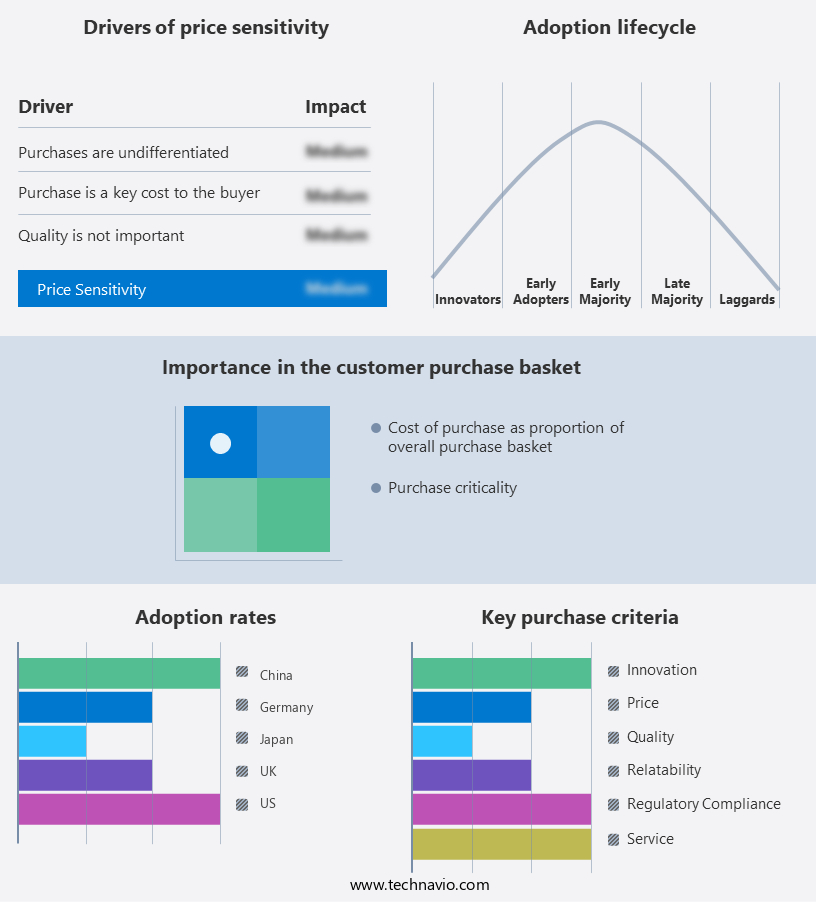
The market forecasting report includes the adoption lifecycle of the market, covering from the innovator's stage to the laggard's stage. It focuses on adoption rates in different regions based on penetration. Furthermore, the report also includes key purchase criteria and drivers of price sensitivity to help companies evaluate and develop their market growth analysis strategies.

Digital Commerce Market Share by Geography

 Customer Landscape

Key Companies & Market Insights

Companies are implementing various strategies, such as strategic alliances, partnerships, mergers and acquisitions, geographical expansion, and product/service launches, to enhance their presence in the market.

Alibaba Group Holding Ltd. - The company offers digital commerce such as China commerce, international commerce and local consumer services.

The market research and growth report includes detailed analyses of the competitive landscape of the market and information about key companies, including:

  • Amazon.com Inc.
  • Apple Inc.
  • Best Buy Co. Inc.
  • Costco Wholesale Corp.
  • eBay Inc.
  • Flipkart Internet Pvt. Ltd.
  • JD.com Inc.
  • Meituan Dianping
  • MercadoLibre Inc.
  • NASPERS Ltd.
  • Otto GmbH and Co. KG
  • Rakuten Group Inc.
  • Shopee Ltd.
  • Shopify Inc.
  • The Home Depot Inc.
  • Trendyol BV
  • Walmart Inc.
  • Wayfair Inc.
  • Zalando SE

Qualitative and quantitative analysis of companies has been conducted to help clients understand the wider business environment as well as the strengths and weaknesses of key market players. Data is qualitatively analyzed to categorize companies as pure play, category-focused, industry-focused, and diversified; it is quantitatively analyzed to categorize companies as dominant, leading, strong, tentative, and weak.

Research Analyst Overview

Digital commerce, also known as e-commerce or e-business, refers to the buying and selling of goods and services through an electronic network, specifically an online store. This type of business model includes business-to-consumer (B2C), business-to-business (B2B), consumer-to-business (C2B), and consumer-to-consumer (C2C) transactions. The Internet is the backbone of digital commerce, enabling consumers to browse and purchase items using various devices such as desktops, smartphones, and tablets. E-commerce encompasses various sectors, including automotive, manufacturing, retail household goods, healthcare and pharmaceuticals, media & entertainment, food & beverage, and more. Omni-channel players leverage digital technology to offer seamless sales and marketing experiences across multiple channels. Digital commerce software solutions, such as inventory management systems, help businesses manage their stock and sales effectively.

Additionally, consumers prefer online shopping due to its convenience and the ability to compare prices and reviews easily. The browsing method and payment method play crucial roles in the digital commerce experience. Payment options include card payment, bank transfer, wallet payment, cash payment, and even crypto currency. Logistics companies and automation play a significant role in ensuring the timely delivery of goods. AI-based e-commerce solutions and personalization technology enhance the CX (customer experience) by offering customized recommendations and solutions based on user behavior and preferences. Trading networks facilitate the exchange of goods and services between businesses and consumers, further expanding the digital commerce landscape.

Market Scope

Report Coverage

Details

Page number

141

Base year

2023

Historic period

2018-2022

Forecast period

2024-2028

Growth momentum & CAGR

Accelerate at a CAGR of 16.6%

Market Growth 2024-2028

USD 3,634 billion

Market structure

Fragmented

YoY growth 2023-2024(%)

13.86

Regional analysis

APAC, North America, Europe, South America, and Middle East and Africa

Performing market contribution

APAC at 54%

Key countries

China, US, Japan, UK, and Germany

Competitive landscape

Leading Companies, Market Positioning of Companies, Competitive Strategies, and Industry Risks

Key companies profiled

Alibaba Group Holding Ltd., Amazon.com Inc., Apple Inc., Best Buy Co. Inc., Costco Wholesale Corp., eBay Inc., Flipkart Internet Pvt. Ltd., JD.com Inc., Meituan Dianping, MercadoLibre Inc., NASPERS Ltd., Otto GmbH and Co. KG, Rakuten Group Inc., Shopee Ltd., Shopify Inc., The Home Depot Inc., Trendyol BV, Walmart Inc., Wayfair Inc., and Zalando SE

Market dynamics

Parent market analysis, market growth inducers and obstacles, market forecast, fast-growing and slow-growing segment analysis, COVID-19 impact and recovery analysis and future consumer dynamics, market condition analysis for the forecast period

Customization purview

If our market report has not included the data that you are looking for, you can reach out to our analysts and get segments customized.

Request Free Sample

What are the Key Data Covered in this Market Research and Growth Report?

  • CAGR of the market during the forecast period
  • Detailed information on factors that will drive the market growth and forecasting between 2024 and 2028
  • Precise estimation of the size of the market  and its contribution of the market in focus to the parent market
  • Accurate predictions about upcoming market growth and trends and changes in consumer behaviour
  • Growth of the market across APAC, North America, Europe, South America, and Middle East and Africa
  • Thorough analysis of the market's competitive landscape and detailed information about companies
  • Comprehensive analysis of factors that will challenge the growth of market companies

We can help! Our analysts can customize this market research report to meet your requirements. Get in touch

1 Executive Summary

  • 1.1 Market overview
    • Executive Summary - Chart on Market Overview
    • Executive Summary - Data Table on Market Overview
    • Executive Summary - Chart on Global Market Characteristics
    • Executive Summary - Chart on Market by Geography
    • Executive Summary - Chart on Market Segmentation by Business Segment
    • Executive Summary - Chart on Incremental Growth
    • Executive Summary - Data Table on Incremental Growth
    • Executive Summary - Chart on Company Market Positioning

2 Market Landscape

  • 2.1 Market ecosystem
    • Parent Market
    • Data Table on - Parent Market
  • 2.2 Market characteristics
    • Market characteristics analysis
  • 2.3 Value chain analysis
    • Value Chain Analysis

3 Market Sizing

  • 3.1 Market definition
    • Offerings of companies included in the market definition
  • 3.2 Market segment analysis
    • Market segments
  • 3.3 Market size 2023
    • 3.4 Market outlook: Forecast for 2023-2028
      • Chart on Global - Market size and forecast 2023-2028 ($ billion)
      • Data Table on Global - Market size and forecast 2023-2028 ($ billion)
      • Chart on Global Market: Year-over-year growth 2023-2028 (%)
      • Data Table on Global Market: Year-over-year growth 2023-2028 (%)

    4 Historic Market Size

    • 4.1 Global Digital Commerce Market 2018 - 2022
      • Historic Market Size - Data Table on Global Digital Commerce Market 2018 - 2022 ($ billion)
    • 4.2 Business segment analysis 2018 - 2022
      • Historic Market Size - Business Segment 2018 - 2022 ($ billion)
    • 4.3 Geography segment analysis 2018 - 2022
      • Historic Market Size - Geography Segment 2018 - 2022 ($ billion)
    • 4.4 Country segment analysis 2018 - 2022
      • Historic Market Size - Country Segment 2018 - 2022 ($ billion)

    5 Five Forces Analysis

    • 5.1 Five forces summary
      • Five forces analysis - Comparison between 2023 and 2028
    • 5.2 Bargaining power of buyers
      • Bargaining power of buyers - Impact of key factors 2023 and 2028
    • 5.3 Bargaining power of suppliers
      • Bargaining power of suppliers - Impact of key factors in 2023 and 2028
    • 5.4 Threat of new entrants
      • Threat of new entrants - Impact of key factors in 2023 and 2028
    • 5.5 Threat of substitutes
      • Threat of substitutes - Impact of key factors in 2023 and 2028
    • 5.6 Threat of rivalry
      • Threat of rivalry - Impact of key factors in 2023 and 2028
    • 5.7 Market condition
      • Chart on Market condition - Five forces 2023 and 2028

    6 Market Segmentation by Business Segment

    • 6.1 Market segments
      • Chart on Market Segmentation by Business Segment - Market share 2023-2028 (%)
      • Data Table on Market Segmentation by Business Segment - Market share 2023-2028 (%)
    • 6.2 Comparison by Market Segmentation by Business Segment
      • Chart on Comparison by Market Segmentation by Business Segment
      • Data Table on Comparison by Market Segmentation by Business Segment
    • 6.3 Business to business - Market size and forecast 2023-2028
      • Chart on Business to business - Market size and forecast 2023-2028 ($ billion)
      • Data Table on Business to business - Market size and forecast 2023-2028 ($ billion)
      • Chart on Business to business - Year-over-year growth 2023-2028 (%)
      • Data Table on Business to business - Year-over-year growth 2023-2028 (%)
    • 6.4 Business to consumer - Market size and forecast 2023-2028
      • Chart on Business to consumer - Market size and forecast 2023-2028 ($ billion)
      • Data Table on Business to consumer - Market size and forecast 2023-2028 ($ billion)
      • Chart on Business to consumer - Year-over-year growth 2023-2028 (%)
      • Data Table on Business to consumer - Year-over-year growth 2023-2028 (%)
    • 6.5 Market opportunity by Market Segmentation by Business Segment
      • Market opportunity by Market Segmentation by Business Segment ($ billion)
      • Data Table on Market opportunity by Market Segmentation by Business Segment ($ billion)

    7 Customer Landscape

    • 7.1 Customer landscape overview
      • Analysis of price sensitivity, lifecycle, customer purchase basket, adoption rates, and purchase criteria

    8 Geographic Landscape

    • 8.1 Geographic segmentation
      • Chart on Market share by geography 2023-2028 (%)
      • Data Table on Market share by geography 2023-2028 (%)
    • 8.2 Geographic comparison
      • Chart on Geographic comparison
      • Data Table on Geographic comparison
    • 8.3 APAC - Market size and forecast 2023-2028
      • Chart on APAC - Market size and forecast 2023-2028 ($ billion)
      • Data Table on APAC - Market size and forecast 2023-2028 ($ billion)
      • Chart on APAC - Year-over-year growth 2023-2028 (%)
      • Data Table on APAC - Year-over-year growth 2023-2028 (%)
    • 8.4 North America - Market size and forecast 2023-2028
      • Chart on North America - Market size and forecast 2023-2028 ($ billion)
      • Data Table on North America - Market size and forecast 2023-2028 ($ billion)
      • Chart on North America - Year-over-year growth 2023-2028 (%)
      • Data Table on North America - Year-over-year growth 2023-2028 (%)
    • 8.5 Europe - Market size and forecast 2023-2028
      • Chart on Europe - Market size and forecast 2023-2028 ($ billion)
      • Data Table on Europe - Market size and forecast 2023-2028 ($ billion)
      • Chart on Europe - Year-over-year growth 2023-2028 (%)
      • Data Table on Europe - Year-over-year growth 2023-2028 (%)
    • 8.6 South America - Market size and forecast 2023-2028
      • Chart on South America - Market size and forecast 2023-2028 ($ billion)
      • Data Table on South America - Market size and forecast 2023-2028 ($ billion)
      • Chart on South America - Year-over-year growth 2023-2028 (%)
      • Data Table on South America - Year-over-year growth 2023-2028 (%)
    • 8.7 Middle East and Africa - Market size and forecast 2023-2028
      • Chart on Middle East and Africa - Market size and forecast 2023-2028 ($ billion)
      • Data Table on Middle East and Africa - Market size and forecast 2023-2028 ($ billion)
      • Chart on Middle East and Africa - Year-over-year growth 2023-2028 (%)
      • Data Table on Middle East and Africa - Year-over-year growth 2023-2028 (%)
    • 8.8 China - Market size and forecast 2023-2028
      • Chart on China - Market size and forecast 2023-2028 ($ billion)
      • Data Table on China - Market size and forecast 2023-2028 ($ billion)
      • Chart on China - Year-over-year growth 2023-2028 (%)
      • Data Table on China - Year-over-year growth 2023-2028 (%)
    • 8.9 US - Market size and forecast 2023-2028
      • Chart on US - Market size and forecast 2023-2028 ($ billion)
      • Data Table on US - Market size and forecast 2023-2028 ($ billion)
      • Chart on US - Year-over-year growth 2023-2028 (%)
      • Data Table on US - Year-over-year growth 2023-2028 (%)
    • 8.10 Japan - Market size and forecast 2023-2028
      • Chart on Japan - Market size and forecast 2023-2028 ($ billion)
      • Data Table on Japan - Market size and forecast 2023-2028 ($ billion)
      • Chart on Japan - Year-over-year growth 2023-2028 (%)
      • Data Table on Japan - Year-over-year growth 2023-2028 (%)
    • 8.11 UK - Market size and forecast 2023-2028
      • Chart on UK - Market size and forecast 2023-2028 ($ billion)
      • Data Table on UK - Market size and forecast 2023-2028 ($ billion)
      • Chart on UK - Year-over-year growth 2023-2028 (%)
      • Data Table on UK - Year-over-year growth 2023-2028 (%)
    • 8.12 Germany - Market size and forecast 2023-2028
      • Chart on Germany - Market size and forecast 2023-2028 ($ billion)
      • Data Table on Germany - Market size and forecast 2023-2028 ($ billion)
      • Chart on Germany - Year-over-year growth 2023-2028 (%)
      • Data Table on Germany - Year-over-year growth 2023-2028 (%)
    • 8.13 Market opportunity by geography
      • Market opportunity by geography ($ billion)
      • Data Tables on Market opportunity by geography ($ billion)

    9 Drivers, Challenges, and Opportunity/Restraints

    • 9.1 Market drivers
      • 9.2 Market challenges
        • 9.3 Impact of drivers and challenges
          • Impact of drivers and challenges in 2023 and 2028
        • 9.4 Market opportunities/restraints

          10 Competitive Landscape

          • 10.1 Overview
            • 10.2 Competitive Landscape
              • Overview on criticality of inputs and factors of differentiation
            • 10.3 Landscape disruption
              • Overview on factors of disruption
            • 10.4 Industry risks
              • Impact of key risks on business

            11 Competitive Analysis

            • 11.1 Companies profiled
              • Companies covered
            • 11.2 Market positioning of companies
              • Matrix on companies position and classification
            • 11.3 Alibaba Group Holding Ltd.
              • Alibaba Group Holding Ltd. - Overview
              • Alibaba Group Holding Ltd. - Business segments
              • Alibaba Group Holding Ltd. - Key news
              • Alibaba Group Holding Ltd. - Key offerings
              • Alibaba Group Holding Ltd. - Segment focus
            • 11.4 Amazon.com Inc.
              • Amazon.com Inc. - Overview
              • Amazon.com Inc. - Business segments
              • Amazon.com Inc. - Key news
              • Amazon.com Inc. - Key offerings
              • Amazon.com Inc. - Segment focus
            • 11.5 Apple Inc.
              • Apple Inc. - Overview
              • Apple Inc. - Business segments
              • Apple Inc. - Key news
              • Apple Inc. - Key offerings
              • Apple Inc. - Segment focus
            • 11.6 Best Buy Co. Inc.
              • Best Buy Co. Inc. - Overview
              • Best Buy Co. Inc. - Business segments
              • Best Buy Co. Inc. - Key news
              • Best Buy Co. Inc. - Key offerings
              • Best Buy Co. Inc. - Segment focus
            • 11.7 eBay Inc.
              • eBay Inc. - Overview
              • eBay Inc. - Product / Service
              • eBay Inc. - Key news
              • eBay Inc. - Key offerings
            • 11.8 Flipkart Internet Pvt. Ltd.
              • Flipkart Internet Pvt. Ltd. - Overview
              • Flipkart Internet Pvt. Ltd. - Product / Service
              • Flipkart Internet Pvt. Ltd. - Key offerings
            • 11.9 JD.com Inc.
              • JD.com Inc. - Overview
              • JD.com Inc. - Business segments
              • JD.com Inc. - Key offerings
              • JD.com Inc. - Segment focus
            • 11.10 The Home Depot Inc.
              • The Home Depot Inc. - Overview
              • The Home Depot Inc. - Business segments
              • The Home Depot Inc. - Key news
              • The Home Depot Inc. - Key offerings
              • The Home Depot Inc. - Segment focus
            • 11.11 Walmart Inc.
              • Walmart Inc. - Overview
              • Walmart Inc. - Business segments
              • Walmart Inc. - Key news
              • Walmart Inc. - Key offerings
              • Walmart Inc. - Segment focus
            • 11.12 Zalando SE
              • Zalando SE - Overview
              • Zalando SE - Product / Service
              • Zalando SE - Key offerings

            12 Appendix

            • 12.1 Scope of the report
              • 12.2 Inclusions and exclusions checklist
                • Inclusions checklist
                • Exclusions checklist
              • 12.3 Currency conversion rates for US$
                • Currency conversion rates for US$
              • 12.4 Research methodology
                • Research methodology
              • 12.5 Data procurement
                • Information sources
              • 12.6 Data validation
                • Data validation
              • 12.7 Validation techniques employed for market sizing
                • Validation techniques employed for market sizing
              • 12.8 Data synthesis
                • Data synthesis
              • 12.9 360 degree market analysis
                • 360 degree market analysis
              • 12.10 List of abbreviations
                • List of abbreviations

              Research Methodology

              Technavio presents a detailed picture of the market by way of study, synthesis, and summation of data from multiple sources. The analysts have presented the various facets of the market with a particular focus on identifying the key industry influencers. The data thus presented is comprehensive, reliable, and the result of extensive research, both primary and secondary.

              INFORMATION SOURCES

              Primary sources

              • Manufacturers and suppliers
              • Channel partners
              • Industry experts
              • Strategic decision makers

              Secondary sources

              • Industry journals and periodicals
              • Government data
              • Financial reports of key industry players
              • Historical data
              • Press releases

              DATA ANALYSIS

              Data Synthesis

              • Collation of data
              • Estimation of key figures
              • Analysis of derived insights

              Data Validation

              • Triangulation with data models
              • Reference against proprietary databases
              • Corroboration with industry experts

              REPORT WRITING

              Qualitative

              • Market drivers
              • Market challenges
              • Market trends
              • Five forces analysis

              Quantitative

              • Market size and forecast
              • Market segmentation
              • Geographical insights
              • Competitive landscape

              Interested in this report?

              Get your sample now to see our research methodology and insights!

              Download Now

              Frequently Asked Questions

              Digital Commerce market growth will increase by $ 3634 bn during 2024-2028 .

              The Digital Commerce market is expected to grow at a CAGR of 16.6% during 2024-2028 .

              Digital Commerce market is segmented by Business Segment( Business to business, Business to consumer)

              Alibaba Group Holding Ltd., Amazon.com Inc., Apple Inc., Best Buy Co. Inc., Costco Wholesale Corp., eBay Inc., Flipkart Internet Pvt. Ltd., JD.com Inc., Meituan Dianping, MercadoLibre Inc., NASPERS Ltd., Otto GmbH and Co. KG, Rakuten Group Inc., Shopee Ltd., Shopify Inc., The Home Depot Inc., Trendyol BV, Walmart Inc., Wayfair Inc., Zalando SE are a few of the key vendors in the Digital Commerce market.

              APAC will register the highest growth rate of 54% among the other regions. Therefore, the Digital Commerce market in APAC is expected to garner significant business opportunities for the vendors during the forecast period.

              China, US, Japan, UK, Germany

              • Robust Internet penetrationWith the increasing penetration of the Internet is the driving factor this market.
              • the number of people using smartphones around the world is increasing. Digital content is the driving factor this market.
              • travel and leisure is the driving factor this market.
              • financial services is the driving factor this market.
              • e-commerce is the driving factor this market.
              • etc. is the driving factor this market.
              • represent a variety of e-commerce options available to the Internet-connected customer base and are gaining momentum as Internet usage increases. Therefore is the driving factor this market.
              • customers' technological perception is expected to positively impact the growth of the market during the forecast period. The implementation of 4G and 5G technologies for connectivity is expected to positively impact the growth of the market as it provides users with an uninterrupted and seamless experience. In addition is the driving factor this market.
              • the growing adoption of smartphones is increasing the presence of online shopping among customers. Such factors are projected to drive the growth of the global digital commerce market during the forecast period. is the driving factor this market.

              The Digital Commerce market vendors should focus on grabbing business opportunities from the Business to business segment as it accounted for the largest market share in the base year.