Software As A Service (saas) Market Analysis, Size, and Forecast 2026-2030: North America (US, Canada, and Mexico), Europe (Germany, UK, and France), APAC (China, India, and Japan), South America (Brazil and Argentina), Middle East and Africa (Saudi Arabia, UAE, and South Africa), and Rest of World (ROW)

Software As A Service (saas) Market Analysis, Size, and Forecast 2026-2030:
North America (US, Canada, and Mexico), Europe (Germany, UK, and France), APAC (China, India, and Japan), South America (Brazil and Argentina), Middle East and Africa (Saudi Arabia, UAE, and South Africa), and Rest of World (ROW)

Published: Mar 2026 302 Pages SKU: IRTNTR70532

Market Overview at a Glance

$616 B
Market Opportunity
21.7%
CAGR 2025 - 2030
56.9%
North America Growth
$264 B
Public cloud segment 2024

Software As A Service (saas) Market Size 2026-2030

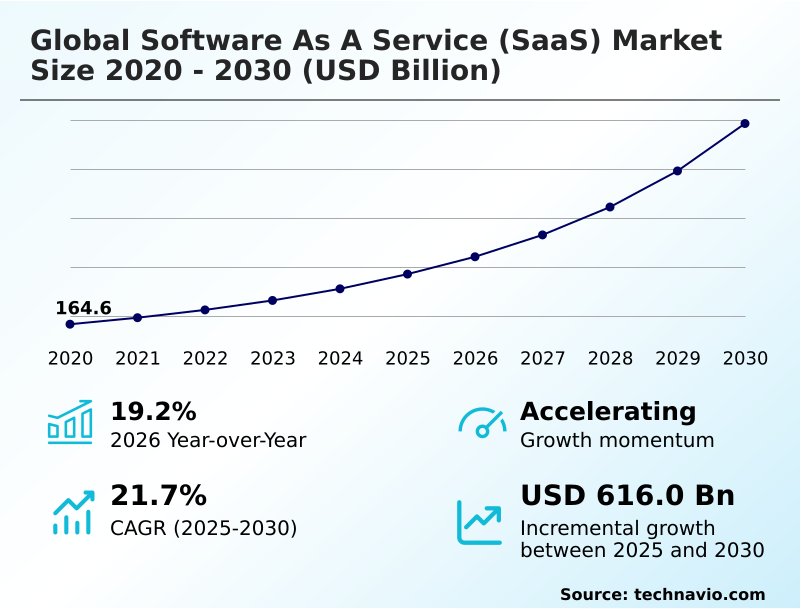
The software as a service (saas) market size is valued to increase by USD 616 billion, at a CAGR of 21.7% from 2025 to 2030. Integration of generative AI associated with SaaS will drive the software as a service (saas) market.

Major Market Trends & Insights

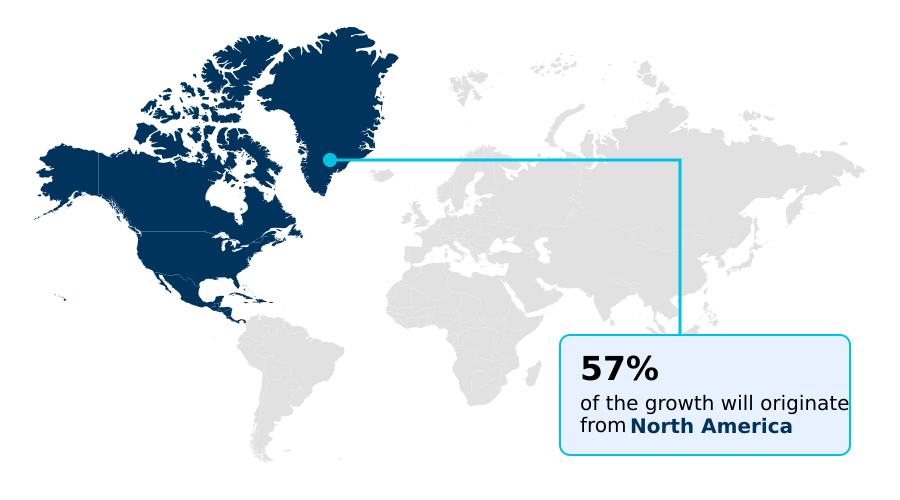
  • North America dominated the market and accounted for a 56.9% growth during the forecast period.
  • By Deployment - Public cloud segment was valued at USD 264 billion in 2024
  • By End-user - Large enterprises segment accounted for the largest market revenue share in 2024

Market Size & Forecast

  • Market Opportunities: USD 821 billion
  • Market Future Opportunities: USD 616 billion
  • CAGR from 2025 to 2030 : 21.7%

Market Summary

  • The software as a service (SaaS) market is undergoing a significant transformation, driven by the need for digital agility and operational efficiency. Organizations are increasingly shifting from on-premises systems to cloud-based solutions to achieve greater scalability, remote accessibility, and cost-effectiveness.
  • This evolution is particularly evident in how businesses manage core functions, with a strong demand for tools that provide actionable insights rather than just data storage. For instance, in supply chain management, companies are leveraging SaaS platforms to gain real-time visibility into logistics, which improves inventory turnover by up to 20% and reduces shipment delays.
  • The market is also characterized by a move toward vertical-specific solutions tailored to the unique regulatory and operational needs of industries like finance and healthcare. The integration of advanced technologies such as artificial intelligence and machine learning is central to this shift, enabling automated workflows and predictive analytics.
  • As businesses continue to prioritize data-driven decision-making, the ability of SaaS to provide sophisticated yet accessible tools will remain a critical factor in its sustained adoption and impact on enterprise operations.

What will be the Size of the Software As A Service (saas) Market during the forecast period?

Get Key Insights on Market Forecast (PDF) Request Free Sample

How is the Software As A Service (saas) Market Segmented?

The software as a service (saas) industry research report provides comprehensive data (region-wise segment analysis), with forecasts and estimates in "USD billion" for the period 2026-2030, as well as historical data from 2020-2024 for the following segments.
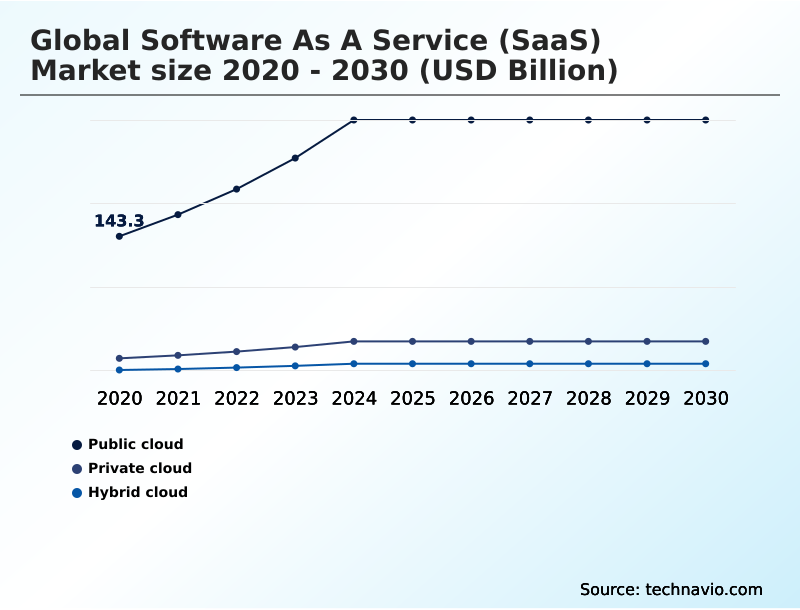
  • Deployment
    • Public cloud
    • Private cloud
    • Hybrid cloud
  • End-user
    • Large enterprises
    • SMEs
  • Component
    • Software
    • Services
  • Geography
    • North America
      • US
      • Canada
      • Mexico
    • Europe
      • Germany
      • UK
      • France
    • APAC
      • China
      • India
      • Japan
    • South America
      • Brazil
      • Argentina
    • Middle East and Africa
      • Saudi Arabia
      • UAE
      • South Africa
    • Rest of World (ROW)

By Deployment Insights

The public cloud segment is estimated to witness significant growth during the forecast period.

The public cloud segment facilitates unparalleled scalability and operational efficiency, allowing organizations to deploy applications without significant upfront capital investment in information technology infrastructure.

This model leverages multi-tenant architecture to deliver software, with providers managing all underlying hardware and maintenance, ensuring users always have access to the latest features.

The adoption of public cloud solutions, including business process management tools, improves application development agility by over 30%. This deployment strategy is central to modernizing enterprise-grade workflows and supporting real-time interoperability.

The use of cloud-native applications and intelligent agents within these environments enables advanced data and content management. Organizations utilize enterprise applications and financial applications on these platforms, benefiting from robust disaster recovery strategies and comprehensive data protection measures.

The focus remains on enhancing user experience through highly available and resilient services.

Request Free Sample

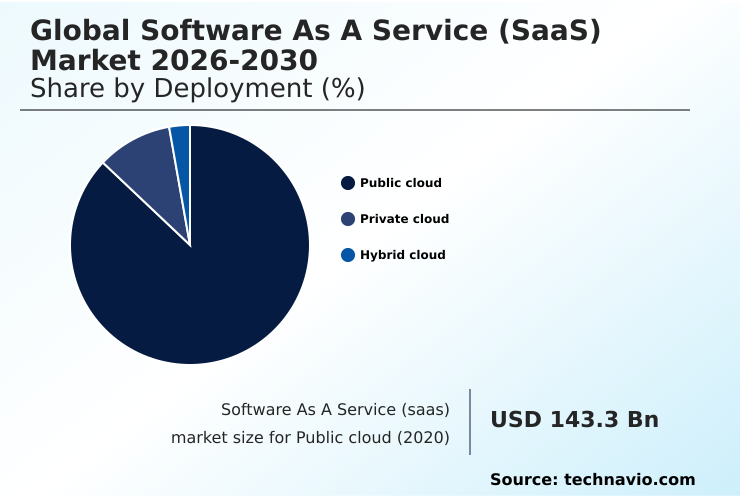
The Public cloud segment was valued at USD 264 billion in 2024 and showed a gradual increase during the forecast period.

Request Free Sample

Regional Analysis

North America is estimated to contribute 56.9% to the growth of the global market during the forecast period.Technavio’s analysts have elaborately explained the regional trends and drivers that shape the market during the forecast period.

See How Software As A Service (saas) Market Demand is Rising in North America Request Free Sample

The geographic landscape of the software as a service (SaaS) market is characterized by varied adoption rates and strategic priorities across regions.

North America leads in market maturity, with a high concentration of enterprises leveraging big data platforms for advanced analytics. This region shows a 40% higher adoption rate of AI-driven observability solutions compared to others.

In contrast, the APAC region is the fastest-growing market, driven by mobile-first strategies and the digitalization of SMEs. Europe focuses on data sovereignty and compliance, with a strong demand for private cloud deployment to meet regulatory requirements.

The use of robotic process automation and unified communications platforms is expanding globally.

The development of high-performance engineering software as a service is gaining traction in industrial economies, while emerging markets prioritize cost-effective communication and collaboration applications and cloud accounting platforms to fuel business growth.

Market Dynamics

Our researchers analyzed the data with 2025 as the base year, along with the key drivers, trends, and challenges. A holistic analysis of drivers will help companies refine their marketing strategies to gain a competitive advantage.

  • The evolution of the software as a service (SaaS) market is increasingly defined by its ability to address complex, specific enterprise needs. Successfully executing SaaS integration with legacy systems remains a critical hurdle, often determining the overall ROI of SaaS adoption. Organizations now prioritize security in multi-tenant SaaS applications, recognizing that a single breach can have cascading effects.
  • The shift toward vertical SaaS for the manufacturing sector highlights the demand for industry-specific functionalities that generic platforms cannot offer. Concurrently, the rise of low-code development for business users is democratizing innovation, allowing non-technical staff to create automated workflows in SaaS platforms.
  • The integration of generative AI in CRM software is transforming customer engagement, while the use of a SaaS platform for digital twins is revolutionizing product design. This has led to a 15% reduction in prototyping costs for early adopters.
  • Strategic decisions now revolve around SaaS pricing models for enterprises and the development of API strategies for SaaS ecosystems to foster interoperability. Furthermore, managing data sovereignty in SaaS is a non-negotiable aspect of modern IT governance, alongside ensuring SaaS compliance with data regulations. Firms are also exploring hybrid cloud for SaaS deployment and optimizing SaaS for mobile-first experiences.
  • The focus on credential management in SaaS environments and achieving SaaS for supply chain visibility addresses critical operational risks. Ultimately, success depends on a combination of robust technology—such as SaaS solutions for high-performance engineering and SaaS for enterprise IoT management—and a strong focus on user experience design in SaaS, supported by effective SaaS implementation and migration services.

What are the key market drivers leading to the rise in the adoption of Software As A Service (saas) Industry?

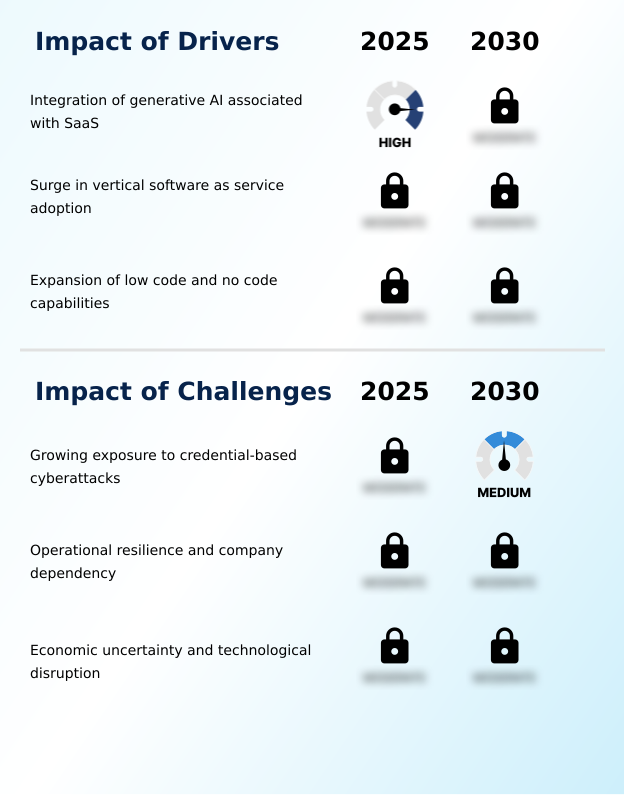
  • The integration of generative AI within SaaS platforms is a primary market driver, transforming application functionality and enhancing user productivity through intelligent automation.

  • The primary driver propelling the software as a service (SaaS) market is the integration of generative artificial intelligence, which automates complex tasks and enhances productivity. Companies leveraging AI-powered tools report a 30% increase in workflow efficiency.
  • This technological shift is complemented by the surge in vertical software as a service adoption, providing industry-specific functionalities that generic platforms lack.
  • The expansion of low-code platforms is also crucial, empowering non-technical users to build and deploy applications, thereby accelerating digital transformation initiatives by up to 40%. The citizen developer model is becoming mainstream, supported by virtual teammates and composable enterprise architectures.
  • These drivers collectively enable organizations to innovate faster, improve customer service performance, and respond more effectively to market changes, utilizing tools such as enterprise IoT platforms.

What are the market trends shaping the Software As A Service (saas) Industry?

  • The adoption of hybrid monetization models that combine recurring subscription fees with usage-based components represents a key market trend, aligning software costs with business value.

  • Key trends in the software as a service (SaaS) market are reshaping how organizations approach technology investment and monetization. The adoption of hybrid monetization models is accelerating, allowing businesses to align software costs with actual usage, which can reduce shelf-ware by up to 25%. This trend is driven by the rise of resource-intensive generative artificial intelligence features.
  • Another significant trend is the convergence of operational tools with analytical platforms through a unified data lakehouse architecture, which improves real-time data access and eliminates information silos. The expansion of vertical software as a service for industries like manufacturing and finance delivers tailored, compliant solutions.
  • The use of financial management software and tax preparation software from the cloud is now standard. This evolution towards flexible, integrated, and specialized platforms, including e-commerce merchant solutions, enables greater business agility.

What challenges does the Software As A Service (saas) Industry face during its growth?

  • Growing exposure to credential-based cyberattacks presents a significant market challenge, increasing security risks for enterprises that rely heavily on SaaS environments for critical operations.

  • The software as a service (SaaS) market faces significant challenges, primarily centered on security and operational resilience. The growing exposure to credential-based cyberattacks remains a top concern, with incidents of unauthorized access rising by over 20% in the last year. This necessitates stronger identity management and the adoption of zero-trust frameworks.
  • Another challenge is the risk of systemic failure due to dependency on a few major cloud providers, as a single outage can disrupt global operations. The fragility of the digital supply chain was highlighted by recent events that impacted millions of endpoints.
  • Furthermore, economic uncertainty is forcing organizations to scrutinize software spending, leading to portfolio consolidation and pressure on vendors to demonstrate immediate value. The rapid evolution of artificial intelligence platforms also creates technological disruption, challenging incumbents to adapt or risk obsolescence.

Exclusive Technavio Analysis on Customer Landscape

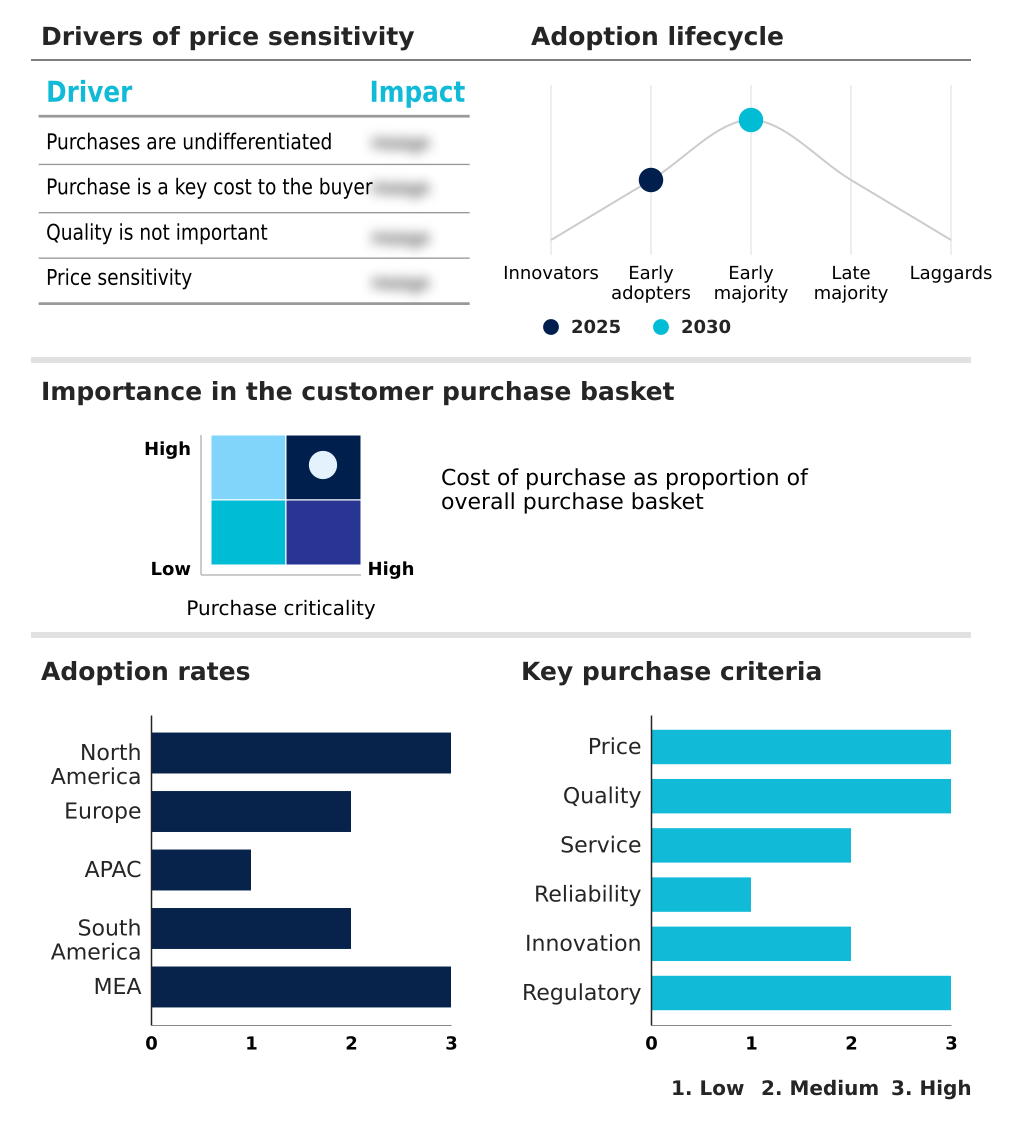
The software as a service (saas) market forecasting report includes the adoption lifecycle of the market, covering from the innovator’s stage to the laggard’s stage. It focuses on adoption rates in different regions based on penetration. Furthermore, the software as a service (saas) market report also includes key purchase criteria and drivers of price sensitivity to help companies evaluate and develop their market growth analysis strategies.

Customer Landscape of Software As A Service (saas) Industry

Competitive Landscape

Companies are implementing various strategies, such as strategic alliances, software as a service (saas) market forecast, partnerships, mergers and acquisitions, geographical expansion, and product/service launches, to enhance their presence in the industry.

Accenture Plc - Delivers software as a service (SaaS) solutions that support digital transformation by enabling the deployment of cloud native business applications for enhanced enterprise integration.

The industry research and growth report includes detailed analyses of the competitive landscape of the market and information about key companies, including:

  • Accenture Plc
  • Adobe Inc.
  • Amazon.com Inc.
  • BetterCloud Inc.
  • Box Inc.
  • Cisco Systems Inc.
  • Convedo Ltd.
  • Fujitsu Ltd.
  • Google LLC
  • Hewlett Packard Entp Co.
  • IBM Corp.
  • Infosys Ltd.
  • Intuit Inc.
  • Microsoft Corp.
  • Oracle Corp.
  • Salesforce Inc.
  • SAP SE
  • ServiceNow Inc.
  • Shopify Inc.
  • Zendesk Inc.

Qualitative and quantitative analysis of companies has been conducted to help clients understand the wider business environment as well as the strengths and weaknesses of key industry players. Data is qualitatively analyzed to categorize companies as pure play, category-focused, industry-focused, and diversified; it is quantitatively analyzed to categorize companies as dominant, leading, strong, tentative, and weak.

Recent Development and News in Software as a service (saas) market

  • In September 2024, Salesforce entered into a definitive agreement to acquire Own Company, a leading provider of data protection and management solutions to bolster its platform with robust backup and recovery capabilities.
  • In October 2024, Siemens entered into an agreement to acquire Altair Engineering to strengthen its position in industrial software and accelerate the integration of simulation and data analytics within its digital business platform.
  • In November 2024, Guidewire Software introduced Claims Intel, a predictive intelligence solution designed to streamline claims management and improve risk selection for property and casualty insurers.
  • In May 2025, HubSpot unveiled significant updates to Breeze, an integrated AI engine that facilitates lead enrichment and content creation across the entire customer journey.

Dive into Technavio’s robust research methodology, blending expert interviews, extensive data synthesis, and validated models for unparalleled Software As A Service (saas) Market insights. See full methodology.

Market Scope
Page number 302
Base year 2025
Historic period 2020-2024
Forecast period 2026-2030
Growth momentum & CAGR Accelerate at a CAGR of 21.7%
Market growth 2026-2030 USD 616.0 billion
Market structure Fragmented
YoY growth 2025-2026(%) 19.2%
Key countries US, Canada, Mexico, Germany, UK, France, Italy, Spain, The Netherlands, China, India, Japan, South Korea, Australia, Singapore, Brazil, Argentina, Chile, Saudi Arabia, UAE, Egypt, South Africa and Qatar
Competitive landscape Leading Companies, Market Positioning of Companies, Competitive Strategies, and Industry Risks

Request Free Sample

Research Analyst Overview

  • The software as a service (SaaS) market is advancing beyond basic cloud delivery toward a more integrated and intelligent ecosystem. A key strategic shift involves the convergence of operational tools and data analytics, enabled by the adoption of a unified data lakehouse architecture.
  • This approach, which improves data processing efficiency by over 35%, is critical for powering generative artificial intelligence and other intelligent agents within core business applications. Enterprises are increasingly adopting a hybrid cloud architecture and private cloud deployment models to balance security, cost, and performance, addressing concerns around data sovereignty.
  • The market is also seeing a rise in hybrid monetization models, where pricing is tied to consumption, reflecting the variable costs of AI-driven features. Boardroom decisions are now heavily influenced by the need to secure the digital supply chain against credential-based cyberattacks and to implement robust disaster recovery strategies.
  • The emphasis on user experience and real-time interoperability through open data standards is compelling organizations to rethink their IT infrastructure and embrace more flexible, cloud-native capabilities.

What are the Key Data Covered in this Software As A Service (saas) Market Research and Growth Report?

  • What is the expected growth of the Software As A Service (saas) Market between 2026 and 2030?

    • USD 616 billion, at a CAGR of 21.7%

  • What segmentation does the market report cover?

    • The report is segmented by Deployment (Public cloud, Private cloud, and Hybrid cloud), End-user (Large enterprises, and SMEs), Component (Software, and Services) and Geography (North America, Europe, APAC, South America, Middle East and Africa)

  • Which regions are analyzed in the report?

    • North America, Europe, APAC, South America and Middle East and Africa

  • What are the key growth drivers and market challenges?

    • Integration of generative AI associated with SaaS, Growing exposure to credential-based cyberattacks

  • Who are the major players in the Software As A Service (saas) Market?

    • Accenture Plc, Adobe Inc., Amazon.com Inc., BetterCloud Inc., Box Inc., Cisco Systems Inc., Convedo Ltd., Fujitsu Ltd., Google LLC, Hewlett Packard Entp Co., IBM Corp., Infosys Ltd., Intuit Inc., Microsoft Corp., Oracle Corp., Salesforce Inc., SAP SE, ServiceNow Inc., Shopify Inc. and Zendesk Inc.

Market Research Insights

  • The software as a service (SaaS) market is shaped by dynamic forces that prioritize digital agility and cost optimization. The integration of artificial intelligence platforms into enterprise resource planning applications is a key factor, with some businesses reporting a 25% improvement in forecast accuracy. This shift toward intelligent automation allows organizations to streamline operations and reallocate resources to strategic initiatives.
  • The adoption of specialized talent orchestration solutions improves internal mobility by over 30%, addressing skill gaps more efficiently. Meanwhile, the use of predictive intelligence solutions in niche sectors enhances risk assessment and operational decision-making.
  • As the market evolves, the focus on unified digital adoption capabilities and robust infrastructure automation offerings becomes critical for maintaining a competitive edge and ensuring seamless integration across diverse software ecosystems.

We can help! Our analysts can customize this software as a service (saas) market research report to meet your requirements.

Get in touch

1. Executive Summary

1.1 Market overview

Executive Summary - Chart on Market Overview
Executive Summary - Data Table on Market Overview
Executive Summary - Chart on Global Market Characteristics
Executive Summary - Chart on Market by Geography
Executive Summary - Chart on Market Segmentation by Deployment
Executive Summary - Chart on Market Segmentation by End-user
Executive Summary - Chart on Market Segmentation by Component
Executive Summary - Chart on Incremental Growth
Executive Summary - Data Table on Incremental Growth
Executive Summary - Chart on Company Market Positioning

2. Technavio Analysis

2.1 Analysis of price sensitivity, lifecycle, customer purchase basket, adoption rates, and purchase criteria

2.2 Criticality of inputs and Factors of differentiation

Chart on Overview on criticality of inputs and factors of differentiation

2.3 Factors of disruption

Chart on Overview on factors of disruption

2.4 Impact of drivers and challenges

Chart on Impact of drivers and challenges in 2025 and 2030

3. Market Landscape

3.1 Market ecosystem

Chart on Parent Market
Data Table on - Parent Market

3.2 Market characteristics

Chart on Market characteristics analysis

3.3 Value chain analysis

Chart on Value chain analysis

4. Market Sizing

4.1 Market definition

Data Table on Offerings of companies included in the market definition

4.2 Market segment analysis

Market segments

4.3 Market size 2025

4.4 Market outlook: Forecast for 2025-2030

Chart on Global - Market size and forecast 2025-2030 ($ billion)
Data Table on Global - Market size and forecast 2025-2030 ($ billion)
Chart on Global Market: Year-over-year growth 2025-2030 (%)
Data Table on Global Market: Year-over-year growth 2025-2030 (%)

5. Historic Market Size

5.1 Global Software As A Service (SaaS) Market 2020 - 2024

Historic Market Size - Data Table on Global Software As A Service (SaaS) Market 2020 - 2024 ($ billion)

5.2 Deployment segment analysis 2020 - 2024

Historic Market Size - Deployment Segment 2020 - 2024 ($ billion)

5.3 End-user segment analysis 2020 - 2024

Historic Market Size - End-user Segment 2020 - 2024 ($ billion)

5.4 Component segment analysis 2020 - 2024

Historic Market Size - Component Segment 2020 - 2024 ($ billion)

5.5 Geography segment analysis 2020 - 2024

Historic Market Size - Geography Segment 2020 - 2024 ($ billion)

5.6 Country segment analysis 2020 - 2024

Historic Market Size - Country Segment 2020 - 2024 ($ billion)

6. Qualitative Analysis

6.1 Impact of AI on Global Software as a Service (SaaS) Market

7. Five Forces Analysis

7.1 Five forces summary

Five forces analysis - Comparison between 2025 and 2030

7.2 Bargaining power of buyers

Bargaining power of buyers - Impact of key factors 2025 and 2030

7.3 Bargaining power of suppliers

Bargaining power of suppliers - Impact of key factors in 2025 and 2030

7.4 Threat of new entrants

Threat of new entrants - Impact of key factors in 2025 and 2030

7.5 Threat of substitutes

Threat of substitutes - Impact of key factors in 2025 and 2030

7.6 Threat of rivalry

Threat of rivalry - Impact of key factors in 2025 and 2030

7.7 Market condition

Chart on Market condition - Five forces 2025 and 2030

8. Market Segmentation by Deployment

8.1 Market segments

Chart on Deployment - Market share 2025-2030 (%)
Data Table on Deployment - Market share 2025-2030 (%)

8.2 Comparison by Deployment

Chart on Comparison by Deployment
Data Table on Comparison by Deployment

8.3 Public cloud - Market size and forecast 2025-2030

Chart on Public cloud - Market size and forecast 2025-2030 ($ billion)
Data Table on Public cloud - Market size and forecast 2025-2030 ($ billion)
Chart on Public cloud - Year-over-year growth 2025-2030 (%)
Data Table on Public cloud - Year-over-year growth 2025-2030 (%)

8.4 Private cloud - Market size and forecast 2025-2030

Chart on Private cloud - Market size and forecast 2025-2030 ($ billion)
Data Table on Private cloud - Market size and forecast 2025-2030 ($ billion)
Chart on Private cloud - Year-over-year growth 2025-2030 (%)
Data Table on Private cloud - Year-over-year growth 2025-2030 (%)

8.5 Hybrid cloud - Market size and forecast 2025-2030

Chart on Hybrid cloud - Market size and forecast 2025-2030 ($ billion)
Data Table on Hybrid cloud - Market size and forecast 2025-2030 ($ billion)
Chart on Hybrid cloud - Year-over-year growth 2025-2030 (%)
Data Table on Hybrid cloud - Year-over-year growth 2025-2030 (%)

8.6 Market opportunity by Deployment

Market opportunity by Deployment ($ billion)
Data Table on Market opportunity by Deployment ($ billion)

9. Market Segmentation by End-user

9.1 Market segments

Chart on End-user - Market share 2025-2030 (%)
Data Table on End-user - Market share 2025-2030 (%)

9.2 Comparison by End-user

Chart on Comparison by End-user
Data Table on Comparison by End-user

9.3 Large enterprises - Market size and forecast 2025-2030

Chart on Large enterprises - Market size and forecast 2025-2030 ($ billion)
Data Table on Large enterprises - Market size and forecast 2025-2030 ($ billion)
Chart on Large enterprises - Year-over-year growth 2025-2030 (%)
Data Table on Large enterprises - Year-over-year growth 2025-2030 (%)

9.4 SMEs - Market size and forecast 2025-2030

Chart on SMEs - Market size and forecast 2025-2030 ($ billion)
Data Table on SMEs - Market size and forecast 2025-2030 ($ billion)
Chart on SMEs - Year-over-year growth 2025-2030 (%)
Data Table on SMEs - Year-over-year growth 2025-2030 (%)

9.5 Market opportunity by End-user

Market opportunity by End-user ($ billion)
Data Table on Market opportunity by End-user ($ billion)

10. Market Segmentation by Component

10.1 Market segments

Chart on Component - Market share 2025-2030 (%)
Data Table on Component - Market share 2025-2030 (%)

10.2 Comparison by Component

Chart on Comparison by Component
Data Table on Comparison by Component

10.3 Software - Market size and forecast 2025-2030

Chart on Software - Market size and forecast 2025-2030 ($ billion)
Data Table on Software - Market size and forecast 2025-2030 ($ billion)
Chart on Software - Year-over-year growth 2025-2030 (%)
Data Table on Software - Year-over-year growth 2025-2030 (%)

10.4 Services - Market size and forecast 2025-2030

Chart on Services - Market size and forecast 2025-2030 ($ billion)
Data Table on Services - Market size and forecast 2025-2030 ($ billion)
Chart on Services - Year-over-year growth 2025-2030 (%)
Data Table on Services - Year-over-year growth 2025-2030 (%)

10.5 Market opportunity by Component

Market opportunity by Component ($ billion)
Data Table on Market opportunity by Component ($ billion)

11. Customer Landscape

11.1 Customer landscape overview

Analysis of price sensitivity, lifecycle, customer purchase basket, adoption rates, and purchase criteria

12. Geographic Landscape

12.1 Geographic segmentation

Chart on Market share by geography 2025-2030 (%)
Data Table on Market share by geography 2025-2030 (%)

12.2 Geographic comparison

Chart on Geographic comparison
Data Table on Geographic comparison

12.3 North America - Market size and forecast 2025-2030

Chart on North America - Market size and forecast 2025-2030 ($ billion)
Data Table on North America - Market size and forecast 2025-2030 ($ billion)
Chart on North America - Year-over-year growth 2025-2030 (%)
Data Table on North America - Year-over-year growth 2025-2030 (%)
Chart on Regional Comparison - North America
Data Table on Regional Comparison - North America

12.3.1 US - Market size and forecast 2025-2030

Chart on US - Market size and forecast 2025-2030 ($ billion)
Data Table on US - Market size and forecast 2025-2030 ($ billion)
Chart on US - Year-over-year growth 2025-2030 (%)
Data Table on US - Year-over-year growth 2025-2030 (%)

12.3.2 Canada - Market size and forecast 2025-2030

Chart on Canada - Market size and forecast 2025-2030 ($ billion)
Data Table on Canada - Market size and forecast 2025-2030 ($ billion)
Chart on Canada - Year-over-year growth 2025-2030 (%)
Data Table on Canada - Year-over-year growth 2025-2030 (%)

12.3.3 Mexico - Market size and forecast 2025-2030

Chart on Mexico - Market size and forecast 2025-2030 ($ billion)
Data Table on Mexico - Market size and forecast 2025-2030 ($ billion)
Chart on Mexico - Year-over-year growth 2025-2030 (%)
Data Table on Mexico - Year-over-year growth 2025-2030 (%)

12.4 Europe - Market size and forecast 2025-2030

Chart on Europe - Market size and forecast 2025-2030 ($ billion)
Data Table on Europe - Market size and forecast 2025-2030 ($ billion)
Chart on Europe - Year-over-year growth 2025-2030 (%)
Data Table on Europe - Year-over-year growth 2025-2030 (%)
Chart on Regional Comparison - Europe
Data Table on Regional Comparison - Europe

12.4.1 Germany - Market size and forecast 2025-2030

Chart on Germany - Market size and forecast 2025-2030 ($ billion)
Data Table on Germany - Market size and forecast 2025-2030 ($ billion)
Chart on Germany - Year-over-year growth 2025-2030 (%)
Data Table on Germany - Year-over-year growth 2025-2030 (%)

12.4.2 UK - Market size and forecast 2025-2030

Chart on UK - Market size and forecast 2025-2030 ($ billion)
Data Table on UK - Market size and forecast 2025-2030 ($ billion)
Chart on UK - Year-over-year growth 2025-2030 (%)
Data Table on UK - Year-over-year growth 2025-2030 (%)

12.4.3 France - Market size and forecast 2025-2030

Chart on France - Market size and forecast 2025-2030 ($ billion)
Data Table on France - Market size and forecast 2025-2030 ($ billion)
Chart on France - Year-over-year growth 2025-2030 (%)
Data Table on France - Year-over-year growth 2025-2030 (%)

12.4.4 Italy - Market size and forecast 2025-2030

Chart on Italy - Market size and forecast 2025-2030 ($ billion)
Data Table on Italy - Market size and forecast 2025-2030 ($ billion)
Chart on Italy - Year-over-year growth 2025-2030 (%)
Data Table on Italy - Year-over-year growth 2025-2030 (%)

12.4.5 Spain - Market size and forecast 2025-2030

Chart on Spain - Market size and forecast 2025-2030 ($ billion)
Data Table on Spain - Market size and forecast 2025-2030 ($ billion)
Chart on Spain - Year-over-year growth 2025-2030 (%)
Data Table on Spain - Year-over-year growth 2025-2030 (%)

12.4.6 The Netherlands - Market size and forecast 2025-2030

Chart on The Netherlands - Market size and forecast 2025-2030 ($ billion)
Data Table on The Netherlands - Market size and forecast 2025-2030 ($ billion)
Chart on The Netherlands - Year-over-year growth 2025-2030 (%)
Data Table on The Netherlands - Year-over-year growth 2025-2030 (%)

12.5 APAC - Market size and forecast 2025-2030

Chart on APAC - Market size and forecast 2025-2030 ($ billion)
Data Table on APAC - Market size and forecast 2025-2030 ($ billion)
Chart on APAC - Year-over-year growth 2025-2030 (%)
Data Table on APAC - Year-over-year growth 2025-2030 (%)
Chart on Regional Comparison - APAC
Data Table on Regional Comparison - APAC

12.5.1 China - Market size and forecast 2025-2030

Chart on China - Market size and forecast 2025-2030 ($ billion)
Data Table on China - Market size and forecast 2025-2030 ($ billion)
Chart on China - Year-over-year growth 2025-2030 (%)
Data Table on China - Year-over-year growth 2025-2030 (%)

12.5.2 India - Market size and forecast 2025-2030

Chart on India - Market size and forecast 2025-2030 ($ billion)
Data Table on India - Market size and forecast 2025-2030 ($ billion)
Chart on India - Year-over-year growth 2025-2030 (%)
Data Table on India - Year-over-year growth 2025-2030 (%)

12.5.3 Japan - Market size and forecast 2025-2030

Chart on Japan - Market size and forecast 2025-2030 ($ billion)
Data Table on Japan - Market size and forecast 2025-2030 ($ billion)
Chart on Japan - Year-over-year growth 2025-2030 (%)
Data Table on Japan - Year-over-year growth 2025-2030 (%)

12.5.4 South Korea - Market size and forecast 2025-2030

Chart on South Korea - Market size and forecast 2025-2030 ($ billion)
Data Table on South Korea - Market size and forecast 2025-2030 ($ billion)
Chart on South Korea - Year-over-year growth 2025-2030 (%)
Data Table on South Korea - Year-over-year growth 2025-2030 (%)

12.5.5 Australia - Market size and forecast 2025-2030

Chart on Australia - Market size and forecast 2025-2030 ($ billion)
Data Table on Australia - Market size and forecast 2025-2030 ($ billion)
Chart on Australia - Year-over-year growth 2025-2030 (%)
Data Table on Australia - Year-over-year growth 2025-2030 (%)

12.5.6 Singapore - Market size and forecast 2025-2030

Chart on Singapore - Market size and forecast 2025-2030 ($ billion)
Data Table on Singapore - Market size and forecast 2025-2030 ($ billion)
Chart on Singapore - Year-over-year growth 2025-2030 (%)
Data Table on Singapore - Year-over-year growth 2025-2030 (%)

12.6 South America - Market size and forecast 2025-2030

Chart on South America - Market size and forecast 2025-2030 ($ billion)
Data Table on South America - Market size and forecast 2025-2030 ($ billion)
Chart on South America - Year-over-year growth 2025-2030 (%)
Data Table on South America - Year-over-year growth 2025-2030 (%)
Chart on Regional Comparison - South America
Data Table on Regional Comparison - South America

12.6.1 Brazil - Market size and forecast 2025-2030

Chart on Brazil - Market size and forecast 2025-2030 ($ billion)
Data Table on Brazil - Market size and forecast 2025-2030 ($ billion)
Chart on Brazil - Year-over-year growth 2025-2030 (%)
Data Table on Brazil - Year-over-year growth 2025-2030 (%)

12.6.2 Argentina - Market size and forecast 2025-2030

Chart on Argentina - Market size and forecast 2025-2030 ($ billion)
Data Table on Argentina - Market size and forecast 2025-2030 ($ billion)
Chart on Argentina - Year-over-year growth 2025-2030 (%)
Data Table on Argentina - Year-over-year growth 2025-2030 (%)

12.6.3 Chile - Market size and forecast 2025-2030

Chart on Chile - Market size and forecast 2025-2030 ($ billion)
Data Table on Chile - Market size and forecast 2025-2030 ($ billion)
Chart on Chile - Year-over-year growth 2025-2030 (%)
Data Table on Chile - Year-over-year growth 2025-2030 (%)

12.7 Middle East and Africa - Market size and forecast 2025-2030

Chart on Middle East and Africa - Market size and forecast 2025-2030 ($ billion)
Data Table on Middle East and Africa - Market size and forecast 2025-2030 ($ billion)
Chart on Middle East and Africa - Year-over-year growth 2025-2030 (%)
Data Table on Middle East and Africa - Year-over-year growth 2025-2030 (%)
Chart on Regional Comparison - Middle East and Africa
Data Table on Regional Comparison - Middle East and Africa

12.7.1 Saudi Arabia - Market size and forecast 2025-2030

Chart on Saudi Arabia - Market size and forecast 2025-2030 ($ billion)
Data Table on Saudi Arabia - Market size and forecast 2025-2030 ($ billion)
Chart on Saudi Arabia - Year-over-year growth 2025-2030 (%)
Data Table on Saudi Arabia - Year-over-year growth 2025-2030 (%)

12.7.2 UAE - Market size and forecast 2025-2030

Chart on UAE - Market size and forecast 2025-2030 ($ billion)
Data Table on UAE - Market size and forecast 2025-2030 ($ billion)
Chart on UAE - Year-over-year growth 2025-2030 (%)
Data Table on UAE - Year-over-year growth 2025-2030 (%)

12.7.3 Egypt - Market size and forecast 2025-2030

Chart on Egypt - Market size and forecast 2025-2030 ($ billion)
Data Table on Egypt - Market size and forecast 2025-2030 ($ billion)
Chart on Egypt - Year-over-year growth 2025-2030 (%)
Data Table on Egypt - Year-over-year growth 2025-2030 (%)

12.7.4 South Africa - Market size and forecast 2025-2030

Chart on South Africa - Market size and forecast 2025-2030 ($ billion)
Data Table on South Africa - Market size and forecast 2025-2030 ($ billion)
Chart on South Africa - Year-over-year growth 2025-2030 (%)
Data Table on South Africa - Year-over-year growth 2025-2030 (%)

12.7.5 Qatar - Market size and forecast 2025-2030

Chart on Qatar - Market size and forecast 2025-2030 ($ billion)
Data Table on Qatar - Market size and forecast 2025-2030 ($ billion)
Chart on Qatar - Year-over-year growth 2025-2030 (%)
Data Table on Qatar - Year-over-year growth 2025-2030 (%)

12.8 Market opportunity by geography

Market opportunity by geography ($ billion)
Data Tables on Market opportunity by geography ($ billion)

13. Drivers, Challenges, and Opportunity

13.1 Market drivers

Integration of generative AI associated with SaaS
Surge in vertical software as service adoption
Expansion of low code and no code capabilities

13.2 Market challenges

Growing exposure to credential-based cyberattacks
Operational resilience and company dependency
Economic uncertainty and technological disruption

13.3 Impact of drivers and challenges

Impact of drivers and challenges in 2025 and 2030

13.4 Market opportunities

Adoption of hybrid monetization models
Convergence of data lakes and application logic
Cloud transition of high-performance engineering software

14. Competitive Landscape

14.1 Overview

14.2

Overview on criticality of inputs and factors of differentiation

14.3 Landscape disruption

Overview on factors of disruption

14.4 Industry risks

Impact of key risks on business

15. Competitive Analysis

15.1 Companies profiled

Companies covered

15.2 Company ranking index

15.3 Market positioning of companies

Matrix on companies position and classification

15.4 Accenture Plc

Accenture Plc - Overview
Accenture Plc - Business segments
Accenture Plc - Key news
Accenture Plc - Key offerings
Accenture Plc - Segment focus
SWOT

15.5 Adobe Inc.

Adobe Inc. - Overview
Adobe Inc. - Business segments
Adobe Inc. - Key news
Adobe Inc. - Key offerings
Adobe Inc. - Segment focus
SWOT

15.6 Amazon.com Inc.

Amazon.com Inc. - Overview
Amazon.com Inc. - Business segments
Amazon.com Inc. - Key news
Amazon.com Inc. - Key offerings
Amazon.com Inc. - Segment focus
SWOT

15.7 Cisco Systems Inc.

Cisco Systems Inc. - Overview
Cisco Systems Inc. - Business segments
Cisco Systems Inc. - Key news
Cisco Systems Inc. - Key offerings
Cisco Systems Inc. - Segment focus
SWOT

15.8 Fujitsu Ltd.

Fujitsu Ltd. - Overview
Fujitsu Ltd. - Business segments
Fujitsu Ltd. - Key news
Fujitsu Ltd. - Key offerings
Fujitsu Ltd. - Segment focus
SWOT

15.9 Google LLC

Google LLC - Overview
Google LLC - Product / Service
Google LLC - Key offerings
SWOT

15.10 Hewlett Packard Entp Co.

Hewlett Packard Entp Co. - Overview
Hewlett Packard Entp Co. - Business segments
Hewlett Packard Entp Co. - Key news
Hewlett Packard Entp Co. - Key offerings
Hewlett Packard Entp Co. - Segment focus
SWOT

15.11 IBM Corp.

IBM Corp. - Overview
IBM Corp. - Business segments
IBM Corp. - Key news
IBM Corp. - Key offerings
IBM Corp. - Segment focus
SWOT

15.12 Infosys Ltd.

Infosys Ltd. - Overview
Infosys Ltd. - Business segments
Infosys Ltd. - Key news
Infosys Ltd. - Key offerings
Infosys Ltd. - Segment focus
SWOT

15.13 Intuit Inc.

Intuit Inc. - Overview
Intuit Inc. - Business segments
Intuit Inc. - Key offerings
Intuit Inc. - Segment focus
SWOT

15.14 Microsoft Corp.

Microsoft Corp. - Overview
Microsoft Corp. - Business segments
Microsoft Corp. - Key news
Microsoft Corp. - Key offerings
Microsoft Corp. - Segment focus
SWOT

15.15 Oracle Corp.

Oracle Corp. - Overview
Oracle Corp. - Business segments
Oracle Corp. - Key news
Oracle Corp. - Key offerings
Oracle Corp. - Segment focus
SWOT

15.16 Salesforce Inc.

Salesforce Inc. - Overview
Salesforce Inc. - Product / Service
Salesforce Inc. - Key news
Salesforce Inc. - Key offerings
SWOT

15.17 SAP SE

SAP SE - Overview
SAP SE - Business segments
SAP SE - Key news
SAP SE - Key offerings
SAP SE - Segment focus
SWOT

15.18 Shopify Inc.

Shopify Inc. - Overview
Shopify Inc. - Product / Service
Shopify Inc. - Key offerings
SWOT

16. Appendix

16.1 Scope of the report

Market definition
Objectives
Notes and caveats

16.2 Inclusions and exclusions checklist

Inclusions checklist
Exclusions checklist

16.3 Currency conversion rates for US$

16.4 Research methodology

16.5 Data procurement

Information sources

16.6 Data validation

16.7 Validation techniques employed for market sizing

16.8 Data synthesis

16.9 360 degree market analysis

16.10 List of abbreviations

Research Methodology

Technavio presents a detailed picture of the market by way of study, synthesis, and summation of data from multiple sources. The analysts have presented the various facets of the market with a particular focus on identifying the key industry influencers. The data thus presented is comprehensive, reliable, and the result of extensive research, both primary and secondary.

INFORMATION SOURCES

Primary sources

  • Manufacturers and suppliers
  • Channel partners
  • Industry experts
  • Strategic decision makers

Secondary sources

  • Industry journals and periodicals
  • Government data
  • Financial reports of key industry players
  • Historical data
  • Press releases

DATA ANALYSIS

Data Synthesis

  • Collation of data
  • Estimation of key figures
  • Analysis of derived insights

Data Validation

  • Triangulation with data models
  • Reference against proprietary databases
  • Corroboration with industry experts

REPORT WRITING

Qualitative

  • Market drivers
  • Market challenges
  • Market trends
  • Five forces analysis

Quantitative

  • Market size and forecast
  • Market segmentation
  • Geographical insights
  • Competitive landscape

Interested in this report?

Get your sample now to see our research methodology and insights!

Download Now

Frequently Asked Questions

Software As A Service (saas) market growth will increase by USD 616.0 billion during 2026-2030.

The Software As A Service (saas) market is expected to grow at a CAGR of 21.7% during 2026-2030.

Software As A Service (saas) market is segmented by Deployment (Public cloud, Private cloud, Hybrid cloud) End-user (Large enterprises, SMEs) Component (Software, Services)

Accenture Plc, Adobe Inc., Amazon.com Inc., BetterCloud Inc., Box Inc., Cisco Systems Inc., Convedo Ltd., Fujitsu Ltd., Google LLC, Hewlett Packard Entp Co., IBM Corp., Infosys Ltd., Intuit Inc., Microsoft Corp., Oracle Corp., Salesforce Inc., SAP SE, ServiceNow Inc., Shopify Inc., Zendesk Inc. are a few of the key vendors in the Software As A Service (saas) market.

North America will register the highest growth rate of 56.9% among the other regions. Therefore, the Software As A Service (saas) market in North America is expected to garner significant business opportunities for the vendors during the forecast period.

US, Canada, Mexico, Germany, UK, France, Italy, Spain, The Netherlands, China, India, Japan, South Korea, Australia, Singapore, Brazil, Argentina, Chile, Saudi Arabia, UAE, Egypt, South Africa, Qatar

  • Integration of generative AI associated with SaaS is the driving factor this market.

The Software As A Service (saas) market vendors should focus on grabbing business opportunities from the Deployment segment as it accounted for the largest market share in the base year.
RIA - Research AI Assistant
Ask RIA