Digital Effects Market Analysis, Size, and Forecast 2026-2030: North America (US, Canada, and Mexico), APAC (China, Japan, and India), Europe (UK, Germany, and France), South America (Brazil, Argentina, and Colombia), Middle East and Africa (Saudi Arabia, UAE, and South Africa), and Rest of World (ROW)

Digital Effects Market Analysis, Size, and Forecast 2026-2030:
North America (US, Canada, and Mexico), APAC (China, Japan, and India), Europe (UK, Germany, and France), South America (Brazil, Argentina, and Colombia), Middle East and Africa (Saudi Arabia, UAE, and South Africa), and Rest of World (ROW)

Published: Apr 2026 301 Pages SKU: IRTNTR81396

Market Overview at a Glance

$175.37 B
Market Opportunity
13.3%
CAGR 2025 - 2030
32.1%
North America Growth
$160.17 B
Animation effects segment 2024

Digital Effects Market Size 2026-2030

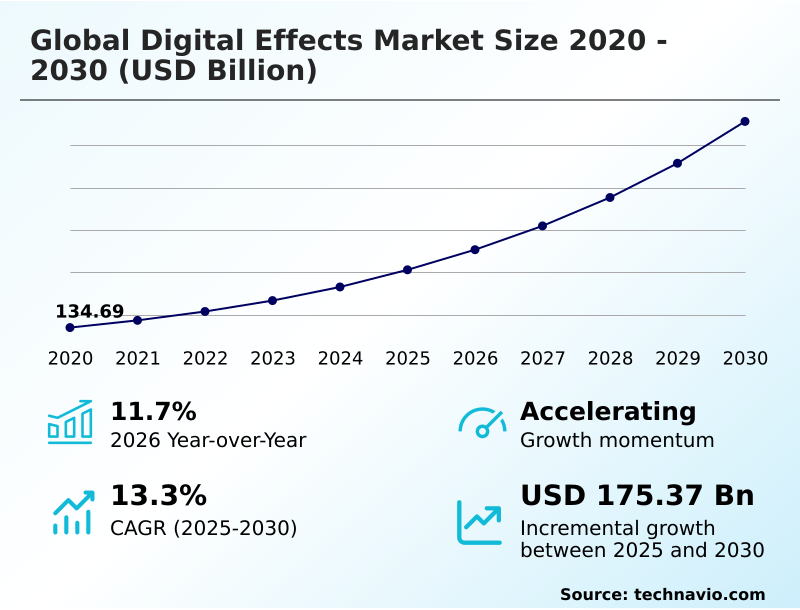
The digital effects market size is valued to increase by USD 175.37 billion, at a CAGR of 13.3% from 2025 to 2030. Surging demand for high-quality visual content across global streaming platforms will drive the digital effects market.

Major Market Trends & Insights

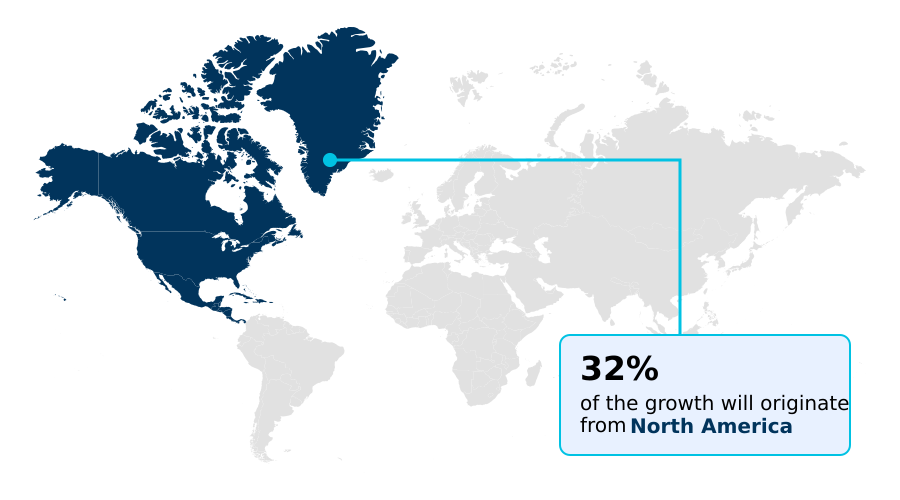
  • North America dominated the market and accounted for a 32.1% growth during the forecast period.
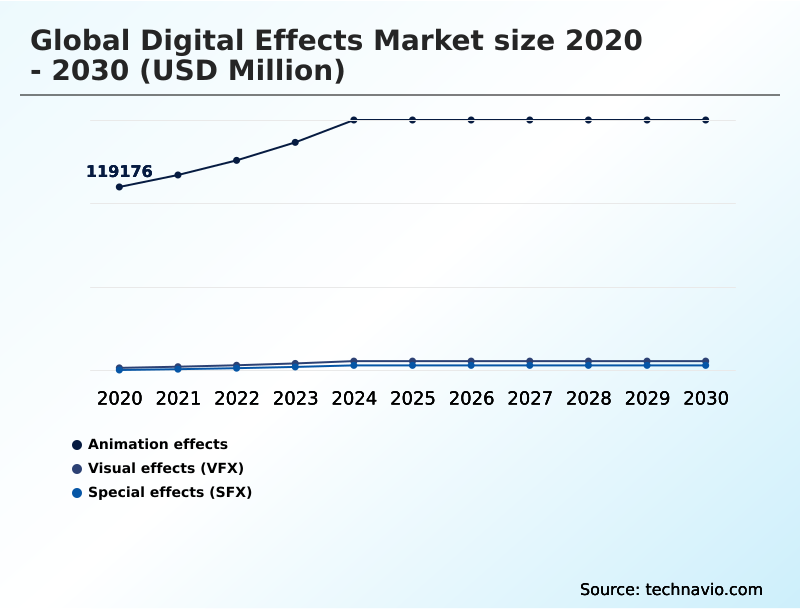
  • By Type - Animation effects segment was valued at USD 160.17 billion in 2024
  • By Application - Film production segment accounted for the largest market revenue share in 2024

Market Size & Forecast

  • Market Opportunities: USD 243.62 billion
  • Market Future Opportunities: USD 175.37 billion
  • CAGR from 2025 to 2030 : 13.3%

Market Summary

  • The digital effects market is fundamentally reshaping content creation, driven by the insatiable demand for high-fidelity visuals in film, television, and gaming. This expansion is fueled by the integration of AI and machine learning, which automate labor-intensive tasks like rotoscoping and crowd simulation, allowing artists to focus on creative execution.
  • A key trend is the adoption of virtual production, where real-time rendering engines and LED stages merge physical and digital sets, shortening post-production cycles. For instance, a studio can now capture scenes for multiple virtual locations in a single day, drastically reducing travel costs and logistical complexities. This technological shift enables even smaller studios to compete by maximizing output.
  • Beyond entertainment, these technologies are creating digital twin simulations for urban planning and advanced training applications. However, the industry grapples with the high costs of infrastructure and a persistent shortage of skilled professionals capable of mastering complex tools for procedural generation, character rigging, and photorealistic rendering. The market's evolution hinges on balancing technological innovation with sustainable financial and talent management.

What will be the Size of the Digital Effects Market during the forecast period?

Get Key Insights on Market Forecast (PDF) Request Free Sample

How is the Digital Effects Market Segmented?

The digital effects industry research report provides comprehensive data (region-wise segment analysis), with forecasts and estimates in "USD million" for the period 2026-2030, as well as historical data from 2020-2024 for the following segments.

  • Type
    • Animation effects
    • Visual effects (VFX)
    • Special effects (SFX)
  • Application
    • Film production
    • Television series
    • Gaming industry
    • Advertising
  • Technology
    • 3D modeling
    • Compositing
    • Simulation effects
    • Motion capture
  • Geography
    • North America
      • US
      • Canada
      • Mexico
    • APAC
      • China
      • Japan
      • India
    • Europe
      • UK
      • Germany
      • France
    • South America
      • Brazil
      • Argentina
      • Colombia
    • Middle East and Africa
      • Saudi Arabia
      • UAE
      • South Africa
    • Rest of World (ROW)

By Type Insights

The animation effects segment is estimated to witness significant growth during the forecast period.

The animation effects sub-segment is a rapidly expanding area within the digital effects market, involving the complete generation of moving images. Techniques range from 2D-style digital drawings to hyper-realistic 3D computer-generated imagery (CGI), with a strong emphasis on photorealistic rendering.

The demand for animation has surged due to the proliferation of streaming platforms needing captivating content, including cinematic visual effects. Creators use procedural generation and real-time rendering for absolute control, allowing stylized interpretations beyond physical cameras.

The evolution of real-time engines and virtual production has revolutionized pipelines; this iterative freedom improves creative workflow, reducing overall production costs and leading to a 15% decrease in project revision cycles for immersive experiences in spatial computing and interactive media, including digital twin simulation.

Request Free Sample

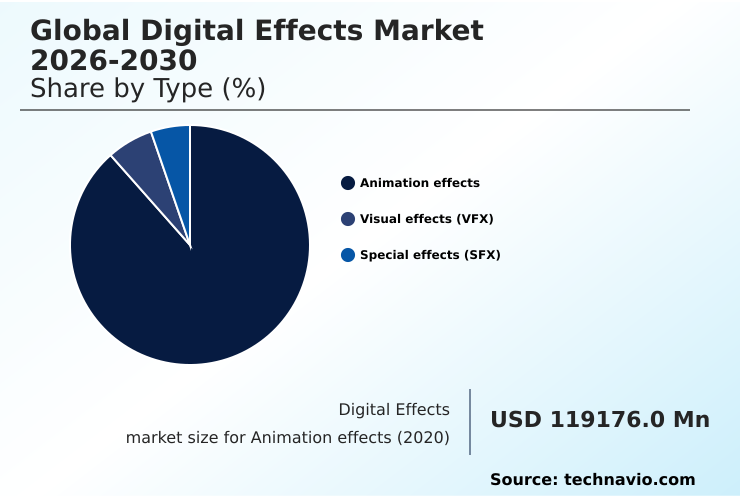
The Animation effects segment was valued at USD 160.17 billion in 2024 and showed a gradual increase during the forecast period.

Request Free Sample

Regional Analysis

North America is estimated to contribute 32.1% to the growth of the global market during the forecast period.Technavio’s analysts have elaborately explained the regional trends and drivers that shape the market during the forecast period.

See How Digital Effects Market Demand is Rising in North America Request Free Sample

The geographic landscape of the digital effects market is diversifying, with North America and Europe leading in technological adoption while the APAC region emerges as the fastest-growing hub.

North America, driven by major studios in the United States and tax incentives in Canada, remains the largest market, accounting for over 32% of incremental growth. This region pioneers the use of light-emitting diode stages and virtual art department workflows.

Meanwhile, APAC is rapidly expanding its capabilities, leveraging its talent pool for complex projects involving cg environments, particle simulations, and fluid dynamics. Europe, particularly the UK, excels in high-end cinematic visual effects and look development.

South America is becoming a strategic outsourcing destination, benefiting from remote workflows. This global distribution of talent and infrastructure, including advanced virtual cinematography and crowd simulation, creates a continuous, 24-hour production cycle.

Market Dynamics

Our researchers analyzed the data with 2025 as the base year, along with the key drivers, trends, and challenges. A holistic analysis of drivers will help companies refine their marketing strategies to gain a competitive advantage.

  • The strategic implementation of advanced digital effects is becoming a critical differentiator across multiple industries. An in-depth analysis of comparing cloud-based vs on-premise rendering reveals that cloud solutions offer superior scalability and can reduce initial hardware investments, a key consideration for new studios.
  • The methodology of virtual production for television series has proven to shorten production schedules significantly, with some projects reporting a 20% reduction in post-production time. A crucial area of development is integrating AI into vfx pipelines, where machine learning algorithms automate tasks like rotoscoping and object tracking, freeing up artists for more creative work.
  • Beyond entertainment, digital twin technology in urban planning allows for sophisticated, real-world simulations of traffic and environmental impacts before construction begins. Similarly, the application of real-time rendering for architectural visualization provides clients with immersive, interactive walkthroughs of unbuilt spaces.
  • This cross-pollination of technologies demonstrates that the expertise honed in cinematic digital effects is creating tangible value and new revenue streams in sectors that depend on high-fidelity simulation and visualization.

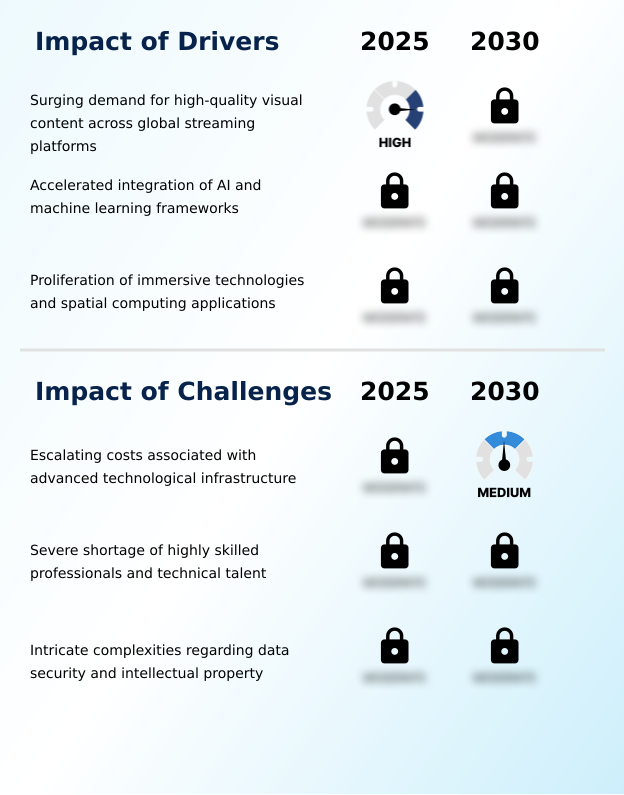
What are the key market drivers leading to the rise in the adoption of Digital Effects Industry?

  • The surging demand for high-quality visual content across global streaming platforms is a key driver propelling market growth.

  • Market growth is propelled by the surging demand for high-quality content and the integration of AI-driven technologies that enhance efficiency.
  • The global expansion of streaming services necessitates a constant stream of visually spectacular narratives, driving investment in cinematic visual effects and immersive experiences.
  • The adoption of generative AI and neural rendering is a massive force, automating repetitive tasks and accelerating content creation by up to 40%.
  • For example, AI-powered virtual humans and procedural animation can now generate realistic character movements and complex scenes that previously required thousands of manual hours.
  • This technological shift not only reduces production timelines but also democratizes access to high-end digital asset creation, allowing smaller studios to compete.
  • The proliferation of spatial computing and interactive media further fuels demand, with enterprise applications in training simulations showing a 20% higher user engagement rate.

What are the market trends shaping the Digital Effects Industry?

  • The market is witnessing a significant trend toward the expansion of cloud-based rendering. This shift is complemented by the increasing adoption of distributed remote workflows across the industry.

  • Key market trends are centered on the decentralization of production and the adoption of real-time technologies. The migration toward cloud-based rendering and distributed workflows allows studios to access global talent and scale computational power on demand, reducing reliance on costly on-premise hardware and cutting data management overhead by 30%.
  • Concurrently, the move to virtual production with in-camera visual effects is revolutionizing filmmaking. Using real-time engines for 3D modeling and previsualization enables directors to make creative decisions on set, significantly shortening post-production schedules by up to 25%.
  • This trend is complemented by the rise of digital twin simulations for non-entertainment applications and advanced techniques like node-based compositing and markerless motion capture, which streamline complex visual tasks and improve overall project efficiency.

What challenges does the Digital Effects Industry face during its growth?

  • A key challenge affecting industry growth is the escalating costs associated with acquiring and maintaining advanced technological infrastructure.

  • The digital effects market faces significant challenges related to escalating operational costs and a severe talent shortage. Acquiring and maintaining state-of-the-art infrastructure for tasks like volumetric capture and digital sculpting requires perpetual capital expenditure, with hardware and software licensing costs increasing by an average of 15% annually.
  • This financial pressure is intensified by a critical deficit of skilled professionals who can manage a modern VFX pipeline and execute complex character rigging or set extension work. The competition for talent drives up salaries and contributes to high burnout rates, creating a talent drain that limits studio capacity.
  • Furthermore, the complexities of data security for distributed digital asset creation and intellectual property rights in the age of generative AI introduce significant legal and financial risks, demanding a 20% increase in compliance and security budgets.

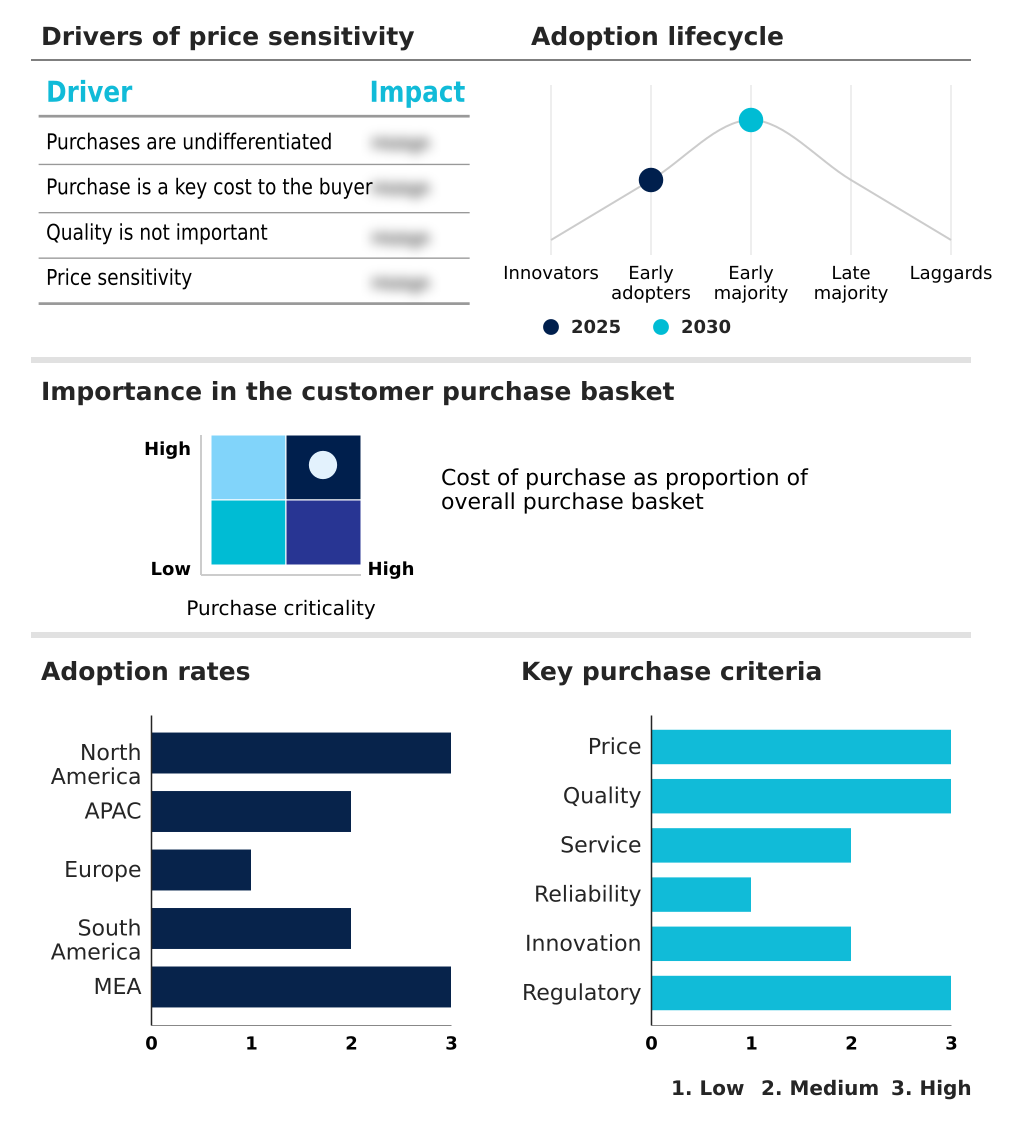
Exclusive Technavio Analysis on Customer Landscape

The digital effects market forecasting report includes the adoption lifecycle of the market, covering from the innovator’s stage to the laggard’s stage. It focuses on adoption rates in different regions based on penetration. Furthermore, the digital effects market report also includes key purchase criteria and drivers of price sensitivity to help companies evaluate and develop their market growth analysis strategies.

Customer Landscape of Digital Effects Industry

Competitive Landscape

Companies are implementing various strategies, such as strategic alliances, digital effects market forecast, partnerships, mergers and acquisitions, geographical expansion, and product/service launches, to enhance their presence in the industry.

Animal Logic - Key offerings include premium computer-generated animation, design, and visual effects tailored for fully animated and hybrid feature film productions.

The industry research and growth report includes detailed analyses of the competitive landscape of the market and information about key companies, including:

  • Animal Logic
  • BUF
  • Cinesite
  • Company 3 Studios Inc
  • Crafty Apes
  • Digital Domain Holdings Ltd.
  • DNEG
  • Eyeline Studios
  • Framestore Ltd.
  • ILP
  • Image Engine Design Inc.
  • Industrial Light and Magic
  • Luma Pictures
  • Milk Visual Effects
  • Pixomondo
  • Rodeo FX Inc.
  • Streamland Media Inc.
  • The Mill Ltd.
  • Weta Digital Ltd.
  • Zoic Studios

Qualitative and quantitative analysis of companies has been conducted to help clients understand the wider business environment as well as the strengths and weaknesses of key industry players. Data is qualitatively analyzed to categorize companies as pure play, category-focused, industry-focused, and diversified; it is quantitatively analyzed to categorize companies as dominant, leading, strong, tentative, and weak.

Recent Development and News in Digital effects market

  • In November 2024, Weta FX and Amazon Web Services (AWS) announced a collaboration to co-develop new AI-powered tools specifically designed for visual effects artists, aiming to innovate asset generation and real-time production workflows.
  • In October 2024, Netflix consolidated its visual effects and virtual production companies, merging the long-standing Scanline VFX with its internal Eyeline Studios under the unified global brand Eyeline to combine cinematic VFX expertise with virtual production advancements.
  • In September 2024, Disguise launched the Disguise X1, a compact, real-time VFX and virtual production solution designed to make high-end rendering capabilities accessible to a broader range of creators without requiring heavy infrastructure.
  • In May 2025, PhantomFX finalized its acquisition of Tippett Studio, a US-based visual effects house with a long history in the industry, signaling a move to expand its global service capabilities and creative portfolio.

Dive into Technavio’s robust research methodology, blending expert interviews, extensive data synthesis, and validated models for unparalleled Digital Effects Market insights. See full methodology.

Market Scope
Page number 301
Base year 2025
Historic period 2020-2024
Forecast period 2026-2030
Growth momentum & CAGR Accelerate at a CAGR of 13.3%
Market growth 2026-2030 USD 175366.3 million
Market structure Fragmented
YoY growth 2025-2026(%) 11.7%
Key countries US, Canada, Mexico, China, Japan, India, South Korea, Australia, Indonesia, UK, Germany, France, Italy, Spain, The Netherlands, Brazil, Argentina, Colombia, Saudi Arabia, UAE, South Africa, Israel and Turkey
Competitive landscape Leading Companies, Market Positioning of Companies, Competitive Strategies, and Industry Risks

Request Free Sample

Research Analyst Overview

  • The digital effects market is defined by a relentless pursuit of technological innovation to meet escalating demands for photorealistic content. Core technologies such as procedural generation and photorealistic rendering are fundamental, enabling the creation of complex cg environments and ai-powered virtual humans with unprecedented realism.
  • The industry-wide shift toward virtual production, utilizing in-camera visual effects and real-time rendering, is reshaping workflows from pre-production to final delivery. This transition requires significant boardroom-level investment decisions regarding infrastructure and talent. For instance, studios adopting these methods have reported up to a 30% reduction in post-production timelines.
  • The development of digital twin simulation is opening new enterprise markets, while techniques like digital sculpting, character rigging, and texture mapping remain essential artistic skills. Advanced processes such as keyframe animation, procedural animation, node-based compositing, and deep compositing are being enhanced by generative AI and neural rendering.
  • Furthermore, technologies like markerless motion capture, volumetric capture, and cloud-based rendering are democratizing access to high-end tools, allowing for the creation of sophisticated particle simulations and fluid dynamics across a broader range of productions.

What are the Key Data Covered in this Digital Effects Market Research and Growth Report?

  • What is the expected growth of the Digital Effects Market between 2026 and 2030?

    • USD 175.37 billion, at a CAGR of 13.3%

  • What segmentation does the market report cover?

    • The report is segmented by Type (Animation effects, Visual effects (VFX), and Special effects (SFX)), Application (Film production, Television series, Gaming industry, and Advertising), Technology (3D modeling, Compositing, Simulation effects, and Motion capture) and Geography (North America, APAC, Europe, South America, Middle East and Africa)

  • Which regions are analyzed in the report?

    • North America, APAC, Europe, South America and Middle East and Africa

  • What are the key growth drivers and market challenges?

    • Surging demand for high-quality visual content across global streaming platforms, Escalating costs associated with advanced technological infrastructure

  • Who are the major players in the Digital Effects Market?

    • Animal Logic, BUF, Cinesite, Company 3 Studios Inc, Crafty Apes, Digital Domain Holdings Ltd., DNEG, Eyeline Studios, Framestore Ltd., ILP, Image Engine Design Inc., Industrial Light and Magic, Luma Pictures, Milk Visual Effects, Pixomondo, Rodeo FX Inc., Streamland Media Inc., The Mill Ltd., Weta Digital Ltd. and Zoic Studios

Market Research Insights

  • The market's dynamics are shaped by a strategic shift toward efficiency and creative scalability. The adoption of virtual production and light-emitting diode stages has accelerated previsualization, reducing on-set-to-final-pixel timelines by up to 25%. Studios are leveraging advanced asset management systems to improve digital backlot and set extension reuse, achieving a 30% increase in asset portability across projects.
  • This focus on optimizing the vfx pipeline and rendering pipeline enhances cinematic visual effects while controlling costs. The use of digital matte painting and sophisticated color grading in post-production further refines visual storytelling, with advanced cg integration techniques now being a standard expectation, improving overall project ROI by 15% through reduced revision cycles.

We can help! Our analysts can customize this digital effects market research report to meet your requirements.

Get in touch

1. Executive Summary

1.1 Market overview

Executive Summary - Chart on Market Overview
Executive Summary - Data Table on Market Overview
Executive Summary - Chart on Global Market Characteristics
Executive Summary - Chart on Market by Geography
Executive Summary - Chart on Market Segmentation by Type
Executive Summary - Chart on Market Segmentation by Application
Executive Summary - Chart on Market Segmentation by Technology
Executive Summary - Chart on Incremental Growth
Executive Summary - Data Table on Incremental Growth
Executive Summary - Chart on Company Market Positioning

2. Technavio Analysis

2.1 Analysis of price sensitivity, lifecycle, customer purchase basket, adoption rates, and purchase criteria

2.2 Criticality of inputs and Factors of differentiation

Chart on Overview on criticality of inputs and factors of differentiation

2.3 Factors of disruption

Chart on Overview on factors of disruption

2.4 Impact of drivers and challenges

Chart on Impact of drivers and challenges in 2025 and 2030

3. Market Landscape

3.1 Market ecosystem

Chart on Parent Market
Data Table on - Parent Market

3.2 Market characteristics

Chart on Market characteristics analysis

3.3 Value chain analysis

Chart on Value chain analysis

4. Market Sizing

4.1 Market definition

Data Table on Offerings of companies included in the market definition

4.2 Market segment analysis

Market segments

4.3 Market size 2025

4.4 Market outlook: Forecast for 2025-2030

Chart on Global - Market size and forecast 2025-2030 ($ million)
Data Table on Global - Market size and forecast 2025-2030 ($ million)
Chart on Global Market: Year-over-year growth 2025-2030 (%)
Data Table on Global Market: Year-over-year growth 2025-2030 (%)

5. Historic Market Size

5.1 Global Digital Effects Market 2020 - 2024

Historic Market Size - Data Table on Global Digital Effects Market 2020 - 2024 ($ million)

5.2 Type segment analysis 2020 - 2024

Historic Market Size - Type Segment 2020 - 2024 ($ million)

5.3 Application segment analysis 2020 - 2024

Historic Market Size - Application Segment 2020 - 2024 ($ million)

5.4 Technology segment analysis 2020 - 2024

Historic Market Size - Technology Segment 2020 - 2024 ($ million)

5.5 Geography segment analysis 2020 - 2024

Historic Market Size - Geography Segment 2020 - 2024 ($ million)

5.6 Country segment analysis 2020 - 2024

Historic Market Size - Country Segment 2020 - 2024 ($ million)

6. Qualitative Analysis

6.1 Impact of AI on Global Digital Effects Market

6.2 Impact of Geopolitical Conflicts on Global Digital Effects Market

7. Five Forces Analysis

7.1 Five forces summary

Five forces analysis - Comparison between 2025 and 2030

7.2 Bargaining power of buyers

Bargaining power of buyers - Impact of key factors 2025 and 2030

7.3 Bargaining power of suppliers

Bargaining power of suppliers - Impact of key factors in 2025 and 2030

7.4 Threat of new entrants

Threat of new entrants - Impact of key factors in 2025 and 2030

7.5 Threat of substitutes

Threat of substitutes - Impact of key factors in 2025 and 2030

7.6 Threat of rivalry

Threat of rivalry - Impact of key factors in 2025 and 2030

7.7 Market condition

Chart on Market condition - Five forces 2025 and 2030

8. Market Segmentation by Type

8.1 Market segments

Chart on Type - Market share 2025-2030 (%)
Data Table on Type - Market share 2025-2030 (%)

8.2 Comparison by Type

Chart on Comparison by Type
Data Table on Comparison by Type

8.3 Animation effects - Market size and forecast 2025-2030

Chart on Animation effects - Market size and forecast 2025-2030 ($ million)
Data Table on Animation effects - Market size and forecast 2025-2030 ($ million)
Chart on Animation effects - Year-over-year growth 2025-2030 (%)
Data Table on Animation effects - Year-over-year growth 2025-2030 (%)

8.4 Visual effects (VFX) - Market size and forecast 2025-2030

Chart on Visual effects (VFX) - Market size and forecast 2025-2030 ($ million)
Data Table on Visual effects (VFX) - Market size and forecast 2025-2030 ($ million)
Chart on Visual effects (VFX) - Year-over-year growth 2025-2030 (%)
Data Table on Visual effects (VFX) - Year-over-year growth 2025-2030 (%)

8.5 Special effects (SFX) - Market size and forecast 2025-2030

Chart on Special effects (SFX) - Market size and forecast 2025-2030 ($ million)
Data Table on Special effects (SFX) - Market size and forecast 2025-2030 ($ million)
Chart on Special effects (SFX) - Year-over-year growth 2025-2030 (%)
Data Table on Special effects (SFX) - Year-over-year growth 2025-2030 (%)

8.6 Market opportunity by Type

Market opportunity by Type ($ million)
Data Table on Market opportunity by Type ($ million)

9. Market Segmentation by Application

9.1 Market segments

Chart on Application - Market share 2025-2030 (%)
Data Table on Application - Market share 2025-2030 (%)

9.2 Comparison by Application

Chart on Comparison by Application
Data Table on Comparison by Application

9.3 Film production - Market size and forecast 2025-2030

Chart on Film production - Market size and forecast 2025-2030 ($ million)
Data Table on Film production - Market size and forecast 2025-2030 ($ million)
Chart on Film production - Year-over-year growth 2025-2030 (%)
Data Table on Film production - Year-over-year growth 2025-2030 (%)

9.4 Television series - Market size and forecast 2025-2030

Chart on Television series - Market size and forecast 2025-2030 ($ million)
Data Table on Television series - Market size and forecast 2025-2030 ($ million)
Chart on Television series - Year-over-year growth 2025-2030 (%)
Data Table on Television series - Year-over-year growth 2025-2030 (%)

9.5 Gaming industry - Market size and forecast 2025-2030

Chart on Gaming industry - Market size and forecast 2025-2030 ($ million)
Data Table on Gaming industry - Market size and forecast 2025-2030 ($ million)
Chart on Gaming industry - Year-over-year growth 2025-2030 (%)
Data Table on Gaming industry - Year-over-year growth 2025-2030 (%)

9.6 Advertising - Market size and forecast 2025-2030

Chart on Advertising - Market size and forecast 2025-2030 ($ million)
Data Table on Advertising - Market size and forecast 2025-2030 ($ million)
Chart on Advertising - Year-over-year growth 2025-2030 (%)
Data Table on Advertising - Year-over-year growth 2025-2030 (%)

9.7 Market opportunity by Application

Market opportunity by Application ($ million)
Data Table on Market opportunity by Application ($ million)

10. Market Segmentation by Technology

10.1 Market segments

Chart on Technology - Market share 2025-2030 (%)
Data Table on Technology - Market share 2025-2030 (%)

10.2 Comparison by Technology

Chart on Comparison by Technology
Data Table on Comparison by Technology

10.3 3D modeling - Market size and forecast 2025-2030

Chart on 3D modeling - Market size and forecast 2025-2030 ($ million)
Data Table on 3D modeling - Market size and forecast 2025-2030 ($ million)
Chart on 3D modeling - Year-over-year growth 2025-2030 (%)
Data Table on 3D modeling - Year-over-year growth 2025-2030 (%)

10.4 Compositing - Market size and forecast 2025-2030

Chart on Compositing - Market size and forecast 2025-2030 ($ million)
Data Table on Compositing - Market size and forecast 2025-2030 ($ million)
Chart on Compositing - Year-over-year growth 2025-2030 (%)
Data Table on Compositing - Year-over-year growth 2025-2030 (%)

10.5 Simulation effects - Market size and forecast 2025-2030

Chart on Simulation effects - Market size and forecast 2025-2030 ($ million)
Data Table on Simulation effects - Market size and forecast 2025-2030 ($ million)
Chart on Simulation effects - Year-over-year growth 2025-2030 (%)
Data Table on Simulation effects - Year-over-year growth 2025-2030 (%)

10.6 Motion capture - Market size and forecast 2025-2030

Chart on Motion capture - Market size and forecast 2025-2030 ($ million)
Data Table on Motion capture - Market size and forecast 2025-2030 ($ million)
Chart on Motion capture - Year-over-year growth 2025-2030 (%)
Data Table on Motion capture - Year-over-year growth 2025-2030 (%)

10.7 Market opportunity by Technology

Market opportunity by Technology ($ million)
Data Table on Market opportunity by Technology ($ million)

11. Customer Landscape

11.1 Customer landscape overview

Analysis of price sensitivity, lifecycle, customer purchase basket, adoption rates, and purchase criteria

12. Geographic Landscape

12.1 Geographic segmentation

Chart on Market share by geography 2025-2030 (%)
Data Table on Market share by geography 2025-2030 (%)

12.2 Geographic comparison

Chart on Geographic comparison
Data Table on Geographic comparison

12.3 North America - Market size and forecast 2025-2030

Chart on North America - Market size and forecast 2025-2030 ($ million)
Data Table on North America - Market size and forecast 2025-2030 ($ million)
Chart on North America - Year-over-year growth 2025-2030 (%)
Data Table on North America - Year-over-year growth 2025-2030 (%)
Chart on Regional Comparison - North America
Data Table on Regional Comparison - North America

12.3.1 US - Market size and forecast 2025-2030

Chart on US - Market size and forecast 2025-2030 ($ million)
Data Table on US - Market size and forecast 2025-2030 ($ million)
Chart on US - Year-over-year growth 2025-2030 (%)
Data Table on US - Year-over-year growth 2025-2030 (%)

12.3.2 Canada - Market size and forecast 2025-2030

Chart on Canada - Market size and forecast 2025-2030 ($ million)
Data Table on Canada - Market size and forecast 2025-2030 ($ million)
Chart on Canada - Year-over-year growth 2025-2030 (%)
Data Table on Canada - Year-over-year growth 2025-2030 (%)

12.3.3 Mexico - Market size and forecast 2025-2030

Chart on Mexico - Market size and forecast 2025-2030 ($ million)
Data Table on Mexico - Market size and forecast 2025-2030 ($ million)
Chart on Mexico - Year-over-year growth 2025-2030 (%)
Data Table on Mexico - Year-over-year growth 2025-2030 (%)

12.4 APAC - Market size and forecast 2025-2030

Chart on APAC - Market size and forecast 2025-2030 ($ million)
Data Table on APAC - Market size and forecast 2025-2030 ($ million)
Chart on APAC - Year-over-year growth 2025-2030 (%)
Data Table on APAC - Year-over-year growth 2025-2030 (%)
Chart on Regional Comparison - APAC
Data Table on Regional Comparison - APAC

12.4.1 China - Market size and forecast 2025-2030

Chart on China - Market size and forecast 2025-2030 ($ million)
Data Table on China - Market size and forecast 2025-2030 ($ million)
Chart on China - Year-over-year growth 2025-2030 (%)
Data Table on China - Year-over-year growth 2025-2030 (%)

12.4.2 Japan - Market size and forecast 2025-2030

Chart on Japan - Market size and forecast 2025-2030 ($ million)
Data Table on Japan - Market size and forecast 2025-2030 ($ million)
Chart on Japan - Year-over-year growth 2025-2030 (%)
Data Table on Japan - Year-over-year growth 2025-2030 (%)

12.4.3 India - Market size and forecast 2025-2030

Chart on India - Market size and forecast 2025-2030 ($ million)
Data Table on India - Market size and forecast 2025-2030 ($ million)
Chart on India - Year-over-year growth 2025-2030 (%)
Data Table on India - Year-over-year growth 2025-2030 (%)

12.4.4 South Korea - Market size and forecast 2025-2030

Chart on South Korea - Market size and forecast 2025-2030 ($ million)
Data Table on South Korea - Market size and forecast 2025-2030 ($ million)
Chart on South Korea - Year-over-year growth 2025-2030 (%)
Data Table on South Korea - Year-over-year growth 2025-2030 (%)

12.4.5 Australia - Market size and forecast 2025-2030

Chart on Australia - Market size and forecast 2025-2030 ($ million)
Data Table on Australia - Market size and forecast 2025-2030 ($ million)
Chart on Australia - Year-over-year growth 2025-2030 (%)
Data Table on Australia - Year-over-year growth 2025-2030 (%)

12.4.6 Indonesia - Market size and forecast 2025-2030

Chart on Indonesia - Market size and forecast 2025-2030 ($ million)
Data Table on Indonesia - Market size and forecast 2025-2030 ($ million)
Chart on Indonesia - Year-over-year growth 2025-2030 (%)
Data Table on Indonesia - Year-over-year growth 2025-2030 (%)

12.5 Europe - Market size and forecast 2025-2030

Chart on Europe - Market size and forecast 2025-2030 ($ million)
Data Table on Europe - Market size and forecast 2025-2030 ($ million)
Chart on Europe - Year-over-year growth 2025-2030 (%)
Data Table on Europe - Year-over-year growth 2025-2030 (%)
Chart on Regional Comparison - Europe
Data Table on Regional Comparison - Europe

12.5.1 UK - Market size and forecast 2025-2030

Chart on UK - Market size and forecast 2025-2030 ($ million)
Data Table on UK - Market size and forecast 2025-2030 ($ million)
Chart on UK - Year-over-year growth 2025-2030 (%)
Data Table on UK - Year-over-year growth 2025-2030 (%)

12.5.2 Germany - Market size and forecast 2025-2030

Chart on Germany - Market size and forecast 2025-2030 ($ million)
Data Table on Germany - Market size and forecast 2025-2030 ($ million)
Chart on Germany - Year-over-year growth 2025-2030 (%)
Data Table on Germany - Year-over-year growth 2025-2030 (%)

12.5.3 France - Market size and forecast 2025-2030

Chart on France - Market size and forecast 2025-2030 ($ million)
Data Table on France - Market size and forecast 2025-2030 ($ million)
Chart on France - Year-over-year growth 2025-2030 (%)
Data Table on France - Year-over-year growth 2025-2030 (%)

12.5.4 Italy - Market size and forecast 2025-2030

Chart on Italy - Market size and forecast 2025-2030 ($ million)
Data Table on Italy - Market size and forecast 2025-2030 ($ million)
Chart on Italy - Year-over-year growth 2025-2030 (%)
Data Table on Italy - Year-over-year growth 2025-2030 (%)

12.5.5 Spain - Market size and forecast 2025-2030

Chart on Spain - Market size and forecast 2025-2030 ($ million)
Data Table on Spain - Market size and forecast 2025-2030 ($ million)
Chart on Spain - Year-over-year growth 2025-2030 (%)
Data Table on Spain - Year-over-year growth 2025-2030 (%)

12.5.6 The Netherlands - Market size and forecast 2025-2030

Chart on The Netherlands - Market size and forecast 2025-2030 ($ million)
Data Table on The Netherlands - Market size and forecast 2025-2030 ($ million)
Chart on The Netherlands - Year-over-year growth 2025-2030 (%)
Data Table on The Netherlands - Year-over-year growth 2025-2030 (%)

12.6 South America - Market size and forecast 2025-2030

Chart on South America - Market size and forecast 2025-2030 ($ million)
Data Table on South America - Market size and forecast 2025-2030 ($ million)
Chart on South America - Year-over-year growth 2025-2030 (%)
Data Table on South America - Year-over-year growth 2025-2030 (%)
Chart on Regional Comparison - South America
Data Table on Regional Comparison - South America

12.6.1 Brazil - Market size and forecast 2025-2030

Chart on Brazil - Market size and forecast 2025-2030 ($ million)
Data Table on Brazil - Market size and forecast 2025-2030 ($ million)
Chart on Brazil - Year-over-year growth 2025-2030 (%)
Data Table on Brazil - Year-over-year growth 2025-2030 (%)

12.6.2 Argentina - Market size and forecast 2025-2030

Chart on Argentina - Market size and forecast 2025-2030 ($ million)
Data Table on Argentina - Market size and forecast 2025-2030 ($ million)
Chart on Argentina - Year-over-year growth 2025-2030 (%)
Data Table on Argentina - Year-over-year growth 2025-2030 (%)

12.6.3 Colombia - Market size and forecast 2025-2030

Chart on Colombia - Market size and forecast 2025-2030 ($ million)
Data Table on Colombia - Market size and forecast 2025-2030 ($ million)
Chart on Colombia - Year-over-year growth 2025-2030 (%)
Data Table on Colombia - Year-over-year growth 2025-2030 (%)

12.7 Middle East and Africa - Market size and forecast 2025-2030

Chart on Middle East and Africa - Market size and forecast 2025-2030 ($ million)
Data Table on Middle East and Africa - Market size and forecast 2025-2030 ($ million)
Chart on Middle East and Africa - Year-over-year growth 2025-2030 (%)
Data Table on Middle East and Africa - Year-over-year growth 2025-2030 (%)
Chart on Regional Comparison - Middle East and Africa
Data Table on Regional Comparison - Middle East and Africa

12.7.1 Saudi Arabia - Market size and forecast 2025-2030

Chart on Saudi Arabia - Market size and forecast 2025-2030 ($ million)
Data Table on Saudi Arabia - Market size and forecast 2025-2030 ($ million)
Chart on Saudi Arabia - Year-over-year growth 2025-2030 (%)
Data Table on Saudi Arabia - Year-over-year growth 2025-2030 (%)

12.7.2 UAE - Market size and forecast 2025-2030

Chart on UAE - Market size and forecast 2025-2030 ($ million)
Data Table on UAE - Market size and forecast 2025-2030 ($ million)
Chart on UAE - Year-over-year growth 2025-2030 (%)
Data Table on UAE - Year-over-year growth 2025-2030 (%)

12.7.3 South Africa - Market size and forecast 2025-2030

Chart on South Africa - Market size and forecast 2025-2030 ($ million)
Data Table on South Africa - Market size and forecast 2025-2030 ($ million)
Chart on South Africa - Year-over-year growth 2025-2030 (%)
Data Table on South Africa - Year-over-year growth 2025-2030 (%)

12.7.4 Israel - Market size and forecast 2025-2030

Chart on Israel - Market size and forecast 2025-2030 ($ million)
Data Table on Israel - Market size and forecast 2025-2030 ($ million)
Chart on Israel - Year-over-year growth 2025-2030 (%)
Data Table on Israel - Year-over-year growth 2025-2030 (%)

12.7.5 Turkey - Market size and forecast 2025-2030

Chart on Turkey - Market size and forecast 2025-2030 ($ million)
Data Table on Turkey - Market size and forecast 2025-2030 ($ million)
Chart on Turkey - Year-over-year growth 2025-2030 (%)
Data Table on Turkey - Year-over-year growth 2025-2030 (%)

12.8 Market opportunity by geography

Market opportunity by geography ($ million)
Data Tables on Market opportunity by geography ($ million)

13. Drivers, Challenges, and Opportunity

13.1 Market drivers

Surging demand for high-quality visual content across global streaming platforms
Accelerated integration of AI and machine learning frameworks
Proliferation of immersive technologies and spatial computing applications

13.2 Market challenges

Escalating costs associated with advanced technological infrastructure
Severe shortage of highly skilled professionals and technical talent
Intricate complexities regarding data security and intellectual property

13.3 Impact of drivers and challenges

Impact of drivers and challenges in 2025 and 2030

13.4 Market opportunities

Expansion of cloud-based rendering and distributed remote workflows
Transition toward real-time virtual production and in-camera visual effects
Increasing adoption of digital twin simulations for cross-industry applications

14. Competitive Landscape

14.1 Overview

14.2

Overview on criticality of inputs and factors of differentiation

14.3 Landscape disruption

Overview on factors of disruption

14.4 Industry risks

Impact of key risks on business

15. Competitive Analysis

15.1 Companies profiled

Companies covered

15.2 Company ranking index

15.3 Market positioning of companies

Matrix on companies position and classification

15.4 Animal Logic

Animal Logic - Overview
Animal Logic - Product / Service
Animal Logic - Key offerings
SWOT

15.5 BUF

BUF - Overview
BUF - Product / Service
BUF - Key offerings
SWOT

15.6 Cinesite

Cinesite - Overview
Cinesite - Product / Service
Cinesite - Key offerings
SWOT

15.7 Crafty Apes

Crafty Apes - Overview
Crafty Apes - Product / Service
Crafty Apes - Key offerings
SWOT

15.8 Digital Domain Holdings Ltd.

Digital Domain Holdings Ltd. - Overview
Digital Domain Holdings Ltd. - Product / Service
Digital Domain Holdings Ltd. - Key offerings
SWOT

15.9 DNEG

DNEG - Overview
DNEG - Product / Service
DNEG - Key offerings
SWOT

15.10 Framestore Ltd.

Framestore Ltd. - Overview
Framestore Ltd. - Product / Service
Framestore Ltd. - Key offerings
SWOT

15.11 ILP

ILP - Overview
ILP - Product / Service
ILP - Key offerings
SWOT

15.12 Industrial Light and Magic

Industrial Light and Magic - Overview
Industrial Light and Magic - Product / Service
Industrial Light and Magic - Key offerings
SWOT

15.13 Luma Pictures

Luma Pictures - Overview
Luma Pictures - Product / Service
Luma Pictures - Key offerings
SWOT

15.14 Milk Visual Effects

Milk Visual Effects - Overview
Milk Visual Effects - Product / Service
Milk Visual Effects - Key offerings
SWOT

15.15 Pixomondo

Pixomondo - Overview
Pixomondo - Product / Service
Pixomondo - Key offerings
SWOT

15.16 Rodeo FX Inc.

Rodeo FX Inc. - Overview
Rodeo FX Inc. - Product / Service
Rodeo FX Inc. - Key offerings
SWOT

15.17 Streamland Media Inc.

Streamland Media Inc. - Overview
Streamland Media Inc. - Product / Service
Streamland Media Inc. - Key offerings
SWOT

15.18 Weta Digital Ltd.

Weta Digital Ltd. - Overview
Weta Digital Ltd. - Product / Service
Weta Digital Ltd. - Key offerings
SWOT

16. Appendix

16.1 Scope of the report

Market definition
Objectives
Notes and caveats

16.2 Inclusions and exclusions checklist

Inclusions checklist
Exclusions checklist

16.3 Currency conversion rates for US$

16.4 Research methodology

16.5 Data procurement

Information sources

16.6 Data validation

16.7 Validation techniques employed for market sizing

16.8 Data synthesis

16.9 360 degree market analysis

16.10 List of abbreviations

Research Methodology

Technavio presents a detailed picture of the market by way of study, synthesis, and summation of data from multiple sources. The analysts have presented the various facets of the market with a particular focus on identifying the key industry influencers. The data thus presented is comprehensive, reliable, and the result of extensive research, both primary and secondary.

INFORMATION SOURCES

Primary sources

  • Manufacturers and suppliers
  • Channel partners
  • Industry experts
  • Strategic decision makers

Secondary sources

  • Industry journals and periodicals
  • Government data
  • Financial reports of key industry players
  • Historical data
  • Press releases

DATA ANALYSIS

Data Synthesis

  • Collation of data
  • Estimation of key figures
  • Analysis of derived insights

Data Validation

  • Triangulation with data models
  • Reference against proprietary databases
  • Corroboration with industry experts

REPORT WRITING

Qualitative

  • Market drivers
  • Market challenges
  • Market trends
  • Five forces analysis

Quantitative

  • Market size and forecast
  • Market segmentation
  • Geographical insights
  • Competitive landscape

Interested in this report?

Get your sample now to see our research methodology and insights!

Download Now

Frequently Asked Questions

Digital Effects market growth will increase by USD 175366.3 million during 2026-2030.

The Digital Effects market is expected to grow at a CAGR of 13.3% during 2026-2030.

Digital Effects market is segmented by Type (Animation effects, Visual effects (VFX), Special effects (SFX)) Application (Film production, Television series, Gaming industry, Advertising) Technology (3D modeling, Compositing, Simulation effects, Motion capture)

Animal Logic, BUF, Cinesite, Company 3 Studios Inc, Crafty Apes, Digital Domain Holdings Ltd., DNEG, Eyeline Studios, Framestore Ltd., ILP, Image Engine Design Inc., Industrial Light and Magic, Luma Pictures, Milk Visual Effects, Pixomondo, Rodeo FX Inc., Streamland Media Inc., The Mill Ltd., Weta Digital Ltd., Zoic Studios are a few of the key vendors in the Digital Effects market.

North America will register the highest growth rate of 32.1% among the other regions. Therefore, the Digital Effects market in North America is expected to garner significant business opportunities for the vendors during the forecast period.

US, Canada, Mexico, China, Japan, India, South Korea, Australia, Indonesia, UK, Germany, France, Italy, Spain, The Netherlands, Brazil, Argentina, Colombia, Saudi Arabia, UAE, South Africa, Israel, Turkey

  • Surging demand for high-quality visual content across global streaming platforms is the driving factor this market.

The Digital Effects market vendors should focus on grabbing business opportunities from the Type segment as it accounted for the largest market share in the base year.
RIA - Research AI Assistant
Ask RIA