
Digital Escrow Platforms Market Size and Growth Forecast 2026-2030
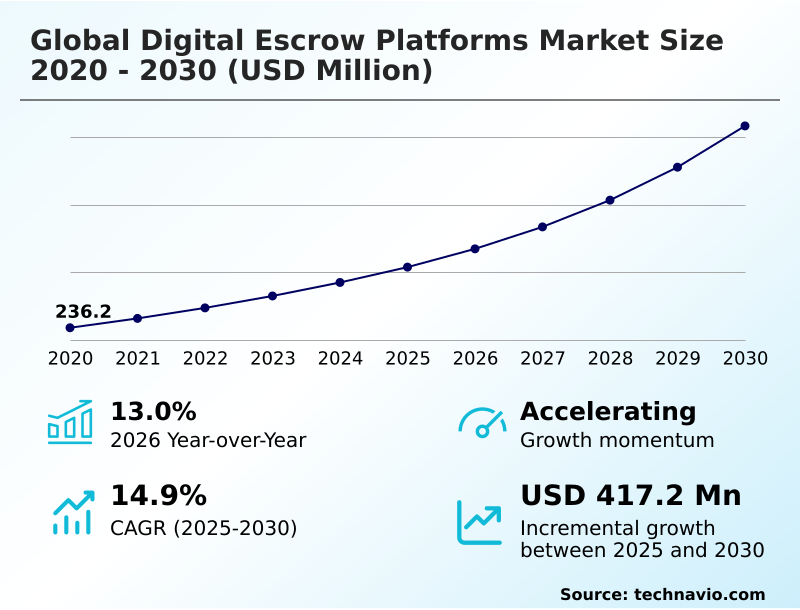
The Digital Escrow Platforms Market size was valued at USD 415.3 million in 2025 growing at a CAGR of 14.9% during the forecast period 2026-2030.
North America accounts for 40.5% of incremental growth during the forecast period. The Traditional escrow segment by Type was valued at USD 138.1 million in 2024, while the Cloud based segment holds the largest revenue share by Deployment.
The market is projected to grow by USD 596.3 million from 2020 to 2030, with USD 417.2 million of the growth expected during the forecast period of 2025 to 2030.
Get Key Insights on Market Forecast (PDF) Request Free Sample
Digital Escrow Platforms Market Overview
The digital escrow platforms market is fundamentally reshaping the architecture of commercial trust, driven by the dual needs of high-value transaction security and operational efficiency in global trade. The market is witnessing a year-over-year growth of 13.0%, reflecting strong adoption. Platforms are moving beyond simple fund holding to incorporate advanced features like automated dispute resolution and milestone-based payments, which are critical for cross-border b2b e-commerce. A key application is real estate closing automation, where digital earnest money deposits and integrated title and settlement services mitigate risks of wire fraud. For instance, a commercial real estate firm adopting an e-closing platform with multi-signature digital wallets for a multi-state portfolio transaction can reduce closing times by days while ensuring compliance with varying state-level know-your-customer protocols. The integration of biometric authentication systems and decentralized identity verification, governed by standards like the EU's eIDAS regulation, further hardens these platforms against sophisticated online payment fraud, making them indispensable for securing intellectual property transfers and digital asset custody.
Drivers, Trends, and Challenges in the Digital Escrow Platforms Market
The market's evolution is marked by a decisive shift away from monolithic solutions toward specialized, API-driven frameworks that address niche industrial requirements. Businesses are increasingly looking to mitigate wire transfer fraud with escrow systems tailored to their specific transactional workflows.
This trend is evident in the development of platforms offering smart contract escrow for digital assets, which provide an immutable and automated method for securing high-value digital trades.
For instance, a global B2B marketplace for industrial parts can leverage an API for integrating escrow payments directly into its platform, providing secure fund holding for B2B marketplaces and automating payouts based on verified shipping data. This approach not only enhances security but also significantly improves cash flow for suppliers.
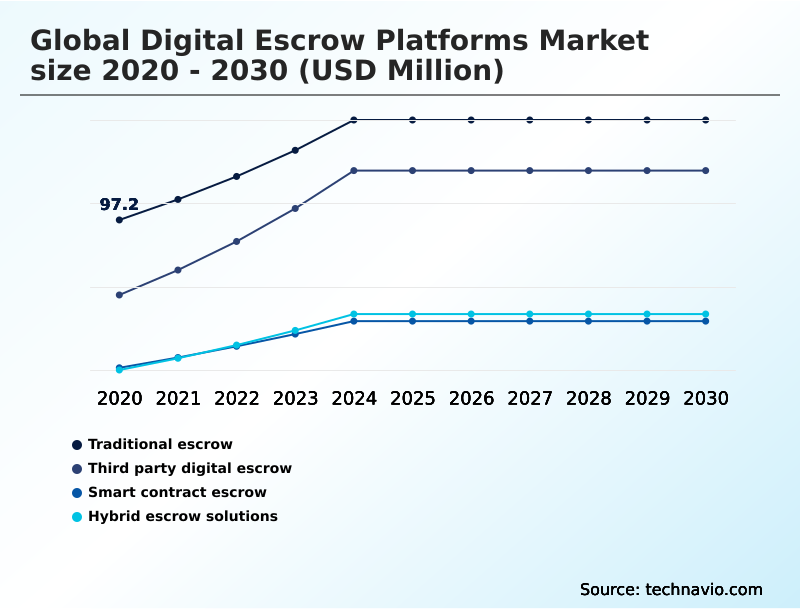
The growth of third-party digital escrow, which expanded from a market value of 66.5 in 2020 to 117.4 in 2024, far outpaces the growth of traditional models, underscoring the demand for agile solutions.
Regulatory frameworks, such as Mexico's Fintech Law of 2018, are further legitimizing these platforms, encouraging their adoption for everything from digital escrow for real estate transactions to compliant escrow for legal settlements, thereby embedding programmable trust into the core of modern digital commerce.
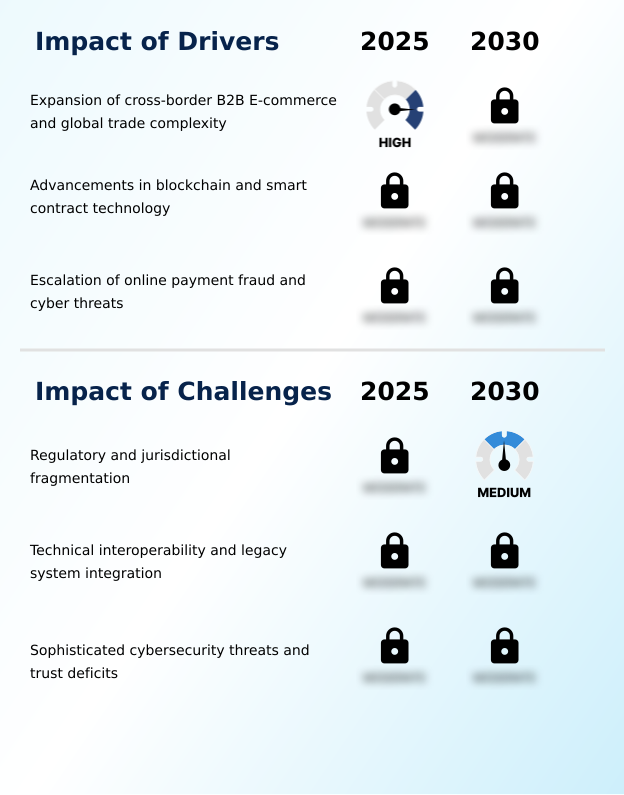
Primary Growth Driver: The expansion of cross-border B2B e-commerce and the increasing complexity of global trade are key drivers for the market.
Market growth is being propelled by several powerful, interconnected drivers.
The rapid expansion of cross-border B2B e-commerce has created an urgent need for reliable mechanisms to mitigate counterparty risk, as traditional payment methods often fail to protect against non-delivery or fraud.
Digital escrow platforms provide the necessary secure fund holding to bridge this trust gap.
Concurrently, the maturation of blockchain technology enables the deployment of smart contract escrow, which automates the entire transaction lifecycle through programmable trust mechanisms, reducing costs and human error. A third critical driver is the escalating sophistication of online payment fraud.
High-profile incidents of wire transfer fraud in real estate and other high-value sectors are compelling businesses and consumers to adopt platforms that offer multi-layered security, including biometric authentication systems and advanced fraud detection algorithms, making security a core value proposition.
Emerging Market Trend: The integration of artificial intelligence for automated dispute resolution is an emerging trend. This approach leverages machine learning to streamline mediation and reduce administrative burdens.
Key trends are reshaping the functional capabilities of digital escrow platforms. The integration of AI is leading to sophisticated automated dispute resolution mechanisms, which analyze transaction data to mediate disagreements without human intervention, significantly lowering operational overhead. Simultaneously, the market is seeing a convergence with decentralized finance through the tokenization of real-world assets.
This allows for the use of smart contract escrow to manage the exchange of asset-backed tokens, a practice gaining ground in real estate and commodity trading. Another significant trend is the development of vertical-specific ecosystems, with platforms tailored for industries like renewable energy, which require complex milestone-based payments tied to verified project outcomes.
This specialization moves beyond generic secure fund holding to offer deeply integrated solutions that understand niche industry risks, such as platforms designed for legal settlement distribution or construction project payment management.
Key Industry Challenge: Regulatory and jurisdictional fragmentation presents a key challenge, affecting the industry's growth trajectory.
Despite strong growth drivers, the digital escrow platforms market faces significant structural challenges. The primary restraint is regulatory and jurisdictional fragmentation; differing anti-money laundering compliance rules and know-your-customer protocols across regions create a complex and costly operational environment for providers. For instance, the EU's digital finance framework imposes specific capital requirements that can be prohibitive for smaller firms.
A second major challenge is technical interoperability. Integrating modern API-driven escrow integration solutions with legacy banking systems, which often lack the necessary APIs for real-time gross settlement integration, leads to processing delays and operational friction. Finally, the threat of sophisticated cybersecurity attacks remains a constant concern.
Protecting against AI-driven phishing and ensuring the security of digital asset custody requires continuous, heavy investment in security infrastructure, which can strain the profitability of emerging players and create a trust deficit among potential users.
Explore Full Market Dynamics Analysis Request Free Sample
Digital Escrow Platforms Market Segmentation
The digital escrow platforms industry research report provides comprehensive data including region-wise segment analysis, with forecasts and analysis for the period 2026-2030, as well as historical data from 2020-2024 for the following segments.
Type Segment Analysis
The traditional escrow segment is estimated to witness significant growth during the forecast period.
Traditional escrow services, foundational to secure asset exchange, are evolving through the adoption of digital interfaces while retaining rigorous manual oversight.
This segment is critical for high-value transactions like corporate mergers and large-scale infrastructure projects where human expertise in legal documentation and asset verification is non-negotiable.
Procurement decision-makers in these sectors prioritize the institutional trust and established legal precedents that characterize these services.
In a move toward modernization, these platforms are integrating cloud-based portals for clients to manage conditions for fund release, blending legacy compliance with digital convenience.
Despite the rise of fully automated alternatives, this segment maintains relevance in conservative sectors not yet prepared for decentralized financial instruments, with a market size of 152.7 million in 2025.
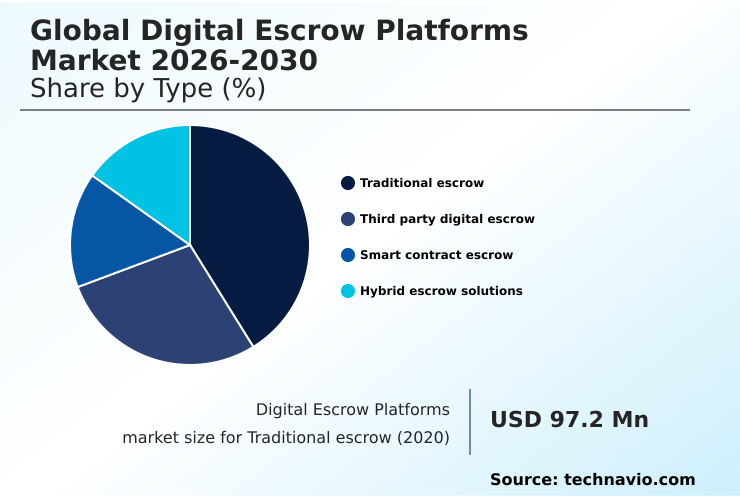
The Traditional escrow segment was valued at USD 138.1 million in 2024 and showed a gradual increase during the forecast period.
Digital Escrow Platforms Market by Region: North America Leads with 40.5% Growth Share
North America is estimated to contribute 40.5% to the growth of the global market during the forecast period.
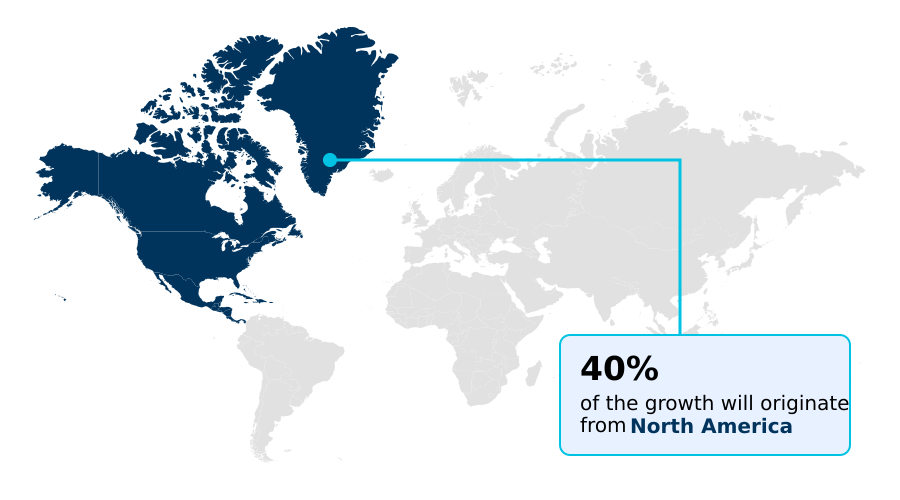
The geographic landscape of the digital escrow platforms market is characterized by distinct regional drivers and adoption patterns, with North America leading, contributing to 40.48% of the market's growth.
This region's dominance is fueled by the high demand for real estate closing automation and secure fund holding in its mature M&A and legal sectors.
In contrast, the APAC region, with a cagr of 16.5%, exhibits the fastest growth, propelled by the explosion of cross-border B2B e-commerce and the adoption of secure payment gateways by a vast number of SMEs.
Europe's market is heavily influenced by regulatory frameworks like the General Data Protection Regulation (GDPR), which places a premium on data sovereignty and anti-money laundering compliance, shaping the development of regulatory technology solutions.
In South America, the focus is on leveraging these platforms for the tokenization of real-world assets, particularly in agriculture and real estate.
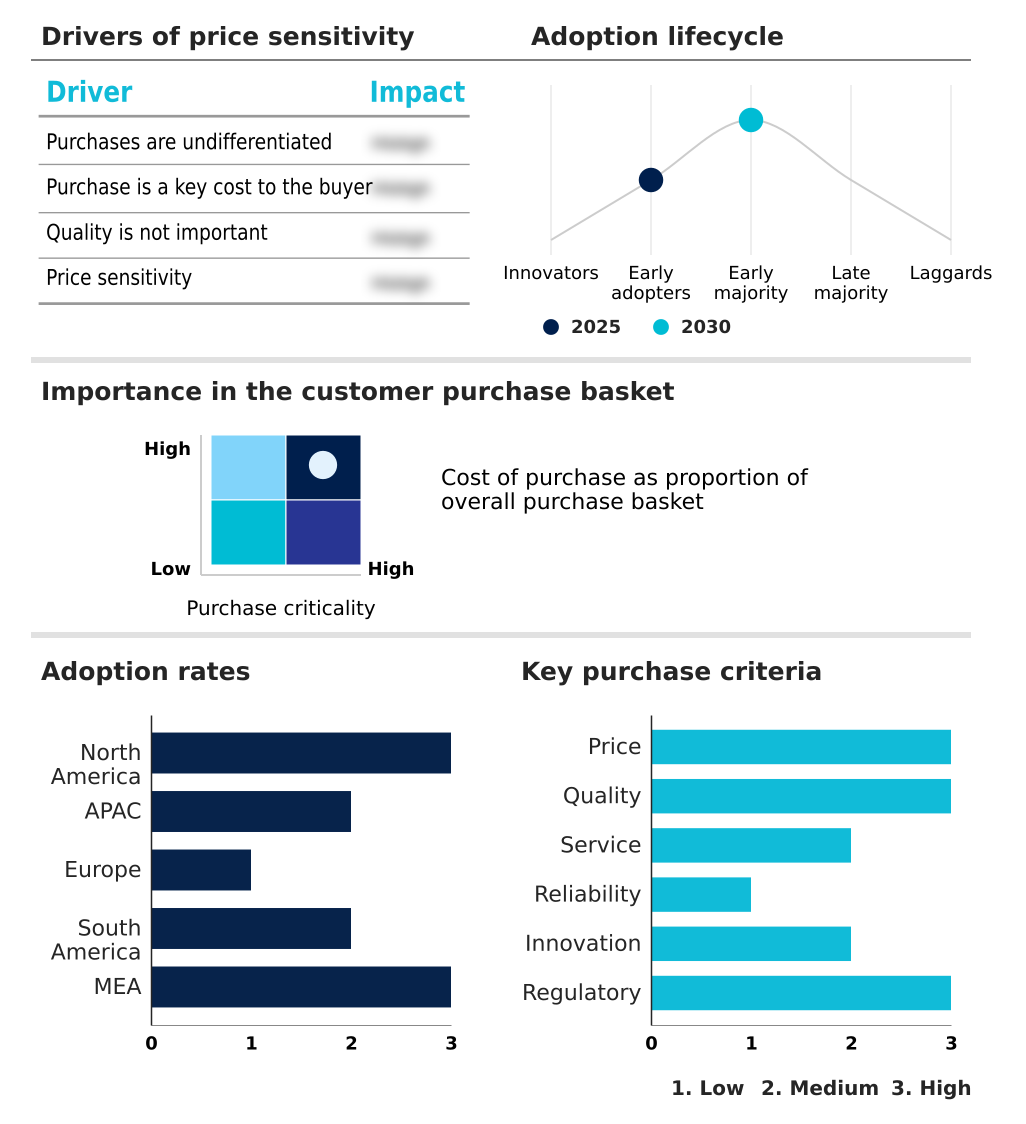
Customer Landscape Analysis for the Digital Escrow Platforms Market
The digital escrow platforms market forecasting report includes the adoption lifecycle of the market, covering from the innovator’s stage to the laggard’s stage. It focuses on adoption rates in different regions based on penetration. Furthermore, the digital escrow platforms market report also includes key purchase criteria and drivers of price sensitivity to help companies evaluate and develop their market growth analysis strategies.
Competitive Landscape of the Digital Escrow Platforms Market
Companies are implementing various strategies, such as strategic alliances, partnerships, mergers and acquisitions, geographical expansion, and product/service launches, to enhance their presence in the digital escrow platforms market industry.
Castler. - Delivering institutional-grade escrow services for complex corporate mergers and acquisitions, leveraging extensive regulatory frameworks to ensure asset security and compliance.
The industry research and growth report includes detailed analyses of the competitive landscape of the market and information about key companies, including:
- Castler.
- Citigroup Inc.
- Codekeeper Inc.
- Decentro Tech Pvt Ltd.
- Earnnest LLC.
- Escrow.com Inc.
- Hudson Technology Systems LLC.
- InnovaSafe Inc.
- JPMorgan Chase and Co.
- Kleros
- Mangopay S.A.
- NCC Group.
- Payoneer Global Inc.
- PRAXIS Technology Escrow LLC.
- Qualia Labs Inc.
- Shieldpay Ltd.
- SRS Acquiom Inc.
- Tazapay PTE. LTD.
- The Escrow Co.
- Transpact
Qualitative and quantitative analysis of companies has been conducted to help clients understand the wider business environment as well as the strengths and weaknesses of key industry players. Data is qualitatively analyzed to categorize companies as pure play, category-focused, industry-focused, and diversified; it is quantitatively analyzed to categorize companies as dominant, leading, strong, tentative, and weak.
Recent Developments in the Digital Escrow Platforms Market
- In March 2025, JPMorgan Chase and Co. introduced a sophisticated digital dashboard within its institutional platform, enhancing transparency for multi-party escrow agreements with real-time compliance milestone monitoring.
- In May 2025, The European Union introduced an updated regulatory framework for digital finance, mandating specific capital reserve requirements for third-party entities that hold funds in digital accounts.
- In April 2025, a major North American automotive manufacturer integrated a digital escrow solution into its global procurement system to manage payments for specialized semiconductor components, securing funds until quality assurance verification.
- In February 2025, a prominent European commercial bank enhanced its legacy escrow department by launching a cloud-based interface, enabling institutional clients to upload inspection certificates to trigger fund releases.
Research Analyst Overview: Digital Escrow Platforms Market
The digital escrow platforms market is undergoing a significant architectural transformation as decentralized finance principles begin to converge with traditional fiduciary services. Boardroom-level decisions are now centered on whether to invest in proprietary blockchain-based arbitration systems or partner with specialized fintechs offering digital asset custody.
This strategic choice is influenced by the need to secure not just currency but also high-value intellectual property transfers and other tokenized assets. The market's overall CAGR of 14.9% is indicative of the strong demand for high-value transaction security.
Platforms offering smart contract escrow are gaining precedence, particularly in jurisdictions like South Korea, where the Virtual Asset User Protection Act mandates stringent measures for crypto-asset exchanges. The focus is on creating ecosystems that support everything from software source code protection to multi-currency payment processing, all while navigating complex know-your-customer protocols.
For enterprises, the critical evaluation involves assessing a platform’s ability to provide automated fund release triggers that are both secure and compliant with evolving international financial regulations.
Dive into Technavio’s robust research methodology, blending expert interviews, extensive data synthesis, and validated models for unparalleled Digital Escrow Platforms Market insights. See full methodology.
| Market Scope | |
|---|---|
| Page number | 296 |
| Base year | 2025 |
| Historic period | 2020-2024 |
| Forecast period | 2026-2030 |
| Growth momentum & CAGR | Accelerate at a CAGR of 14.9% |
| Market growth 2026-2030 | USD 417.2 million |
| Market structure | Fragmented |
| YoY growth 2025-2026(%) | 13.0% |
| Key countries | US, Canada, Mexico, India, China, Australia, Japan, South Korea, Indonesia, UK, Germany, France, The Netherlands, Spain, Italy, Brazil, Argentina, Chile, UAE, Saudi Arabia, South Africa, Israel and Turkey |
| Competitive landscape | Leading Companies, Market Positioning of Companies, Competitive Strategies, and Industry Risks |
Digital Escrow Platforms Market: Key Questions Answered in This Report
-
What is the expected growth of the Digital Escrow Platforms Market between 2026 and 2030?
-
The Digital Escrow Platforms Market is expected to grow by USD 417.2 million during 2026-2030, registering a CAGR of 14.9%. Year-over-year growth in 2026 is estimated at 13.0%%. This acceleration is shaped by expansion of cross-border b2b e-commerce and global trade complexity, which is intensifying demand across multiple end-use verticals covered in the report.
-
-
What segmentation does the market report cover?
-
The report is segmented by Type (Traditional escrow, Third party digital escrow, Smart contract escrow, and Hybrid escrow solutions), Deployment (Cloud based, and On premises), Business Segment (Large enterprises, Small and medium enterprises, and Freelance users) and Geography (North America, APAC, Europe, South America, Middle East and Africa). Among these, the Traditional escrow segment is estimated to witness significant growth during the forecast period, driven by rising adoption across key application areas. Each segment includes detailed qualitative and quantitative analysis, along with historical data from 2020-2024 and forecasts through 2030 with year-over-year growth rates.
-
-
Which regions are analyzed in the report?
-
The report covers North America, APAC, Europe, South America and Middle East and Africa. North America is estimated to contribute 40.5% to market growth during the forecast period. Country-level analysis includes US, Canada, Mexico, India, China, Australia, Japan, South Korea, Indonesia, UK, Germany, France, The Netherlands, Spain, Italy, Brazil, Argentina, Chile, UAE, Saudi Arabia, South Africa, Israel and Turkey, with dedicated market size tables and year-over-year growth for each.
-
-
What are the key growth drivers and market challenges?
-
The primary driver is expansion of cross-border b2b e-commerce and global trade complexity, which is accelerating investment and industry demand. The main challenge is regulatory and jurisdictional fragmentation, creating operational barriers for key market participants. The report quantifies the impact of each driver and challenge across 2026 and 2030 with comparative analysis.
-
-
Who are the major players in the Digital Escrow Platforms Market?
-
Key vendors include Castler., Citigroup Inc., Codekeeper Inc., Decentro Tech Pvt Ltd., Earnnest LLC., Escrow.com Inc., Hudson Technology Systems LLC., InnovaSafe Inc., JPMorgan Chase and Co., Kleros, Mangopay S.A., NCC Group., Payoneer Global Inc., PRAXIS Technology Escrow LLC., Qualia Labs Inc., Shieldpay Ltd., SRS Acquiom Inc., Tazapay PTE. LTD., The Escrow Co. and Transpact. The report provides qualitative and quantitative analysis categorizing companies as dominant, leading, strong, tentative, and weak based on their market positioning. Company profiles include business segment analysis, SWOT assessment, key offerings, and recent strategic developments.
-
Digital Escrow Platforms Market Research Insights
Market dynamics are shaped by the strategic imperatives of mitigating counterparty risk in an increasingly digital and borderless commercial environment. North America is set to capture over 40% of the incremental growth, driven by demand for institutional-grade escrow services in M&A and legal sectors.
Here, platforms offering robust anti-money laundering compliance and integration with existing financial technology infrastructure are gaining preference. The competitive landscape compels providers to innovate, with many embedding programmable trust mechanisms through APIs for seamless digital wallet integration into B2B marketplace payment solutions.
Compliance with frameworks like Europe's Payment Services Directive 2 (PSD2) influences platform architecture, mandating strong customer authentication and secure data sharing. This regulatory pressure, combined with the need for scalable cross-border payment interoperability, defines the strategic focus for vendors navigating the global ecosystem.
We can help! Our analysts can customize this digital escrow platforms market research report to meet your requirements.
 RIA -
RIA - 
