
Decentralized Finance Market Size 2026-2030
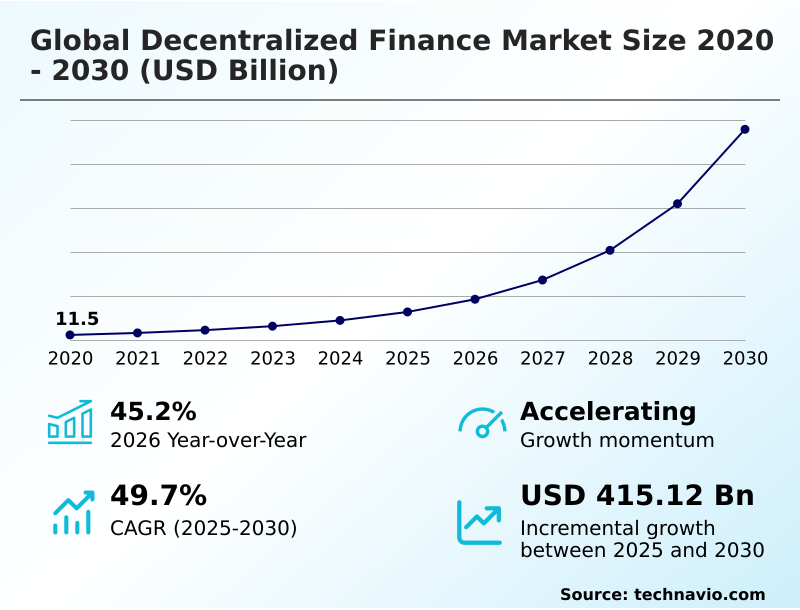
The decentralized finance market size is valued to increase by USD 415.12 billion, at a CAGR of 49.7% from 2025 to 2030. Rising investments in digital assets will drive the decentralized finance market.
Major Market Trends & Insights
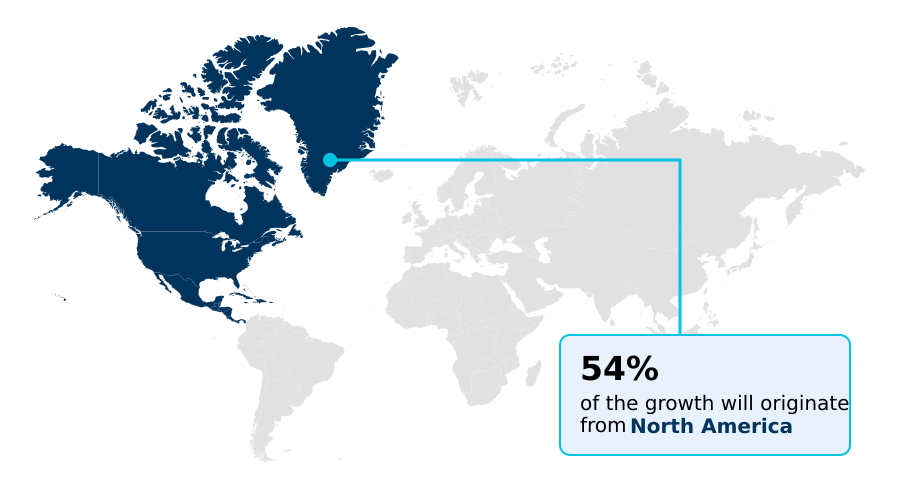
- North America dominated the market and accounted for a 53.9% growth during the forecast period.
- By Application - Data and analytics segment was valued at USD 16.49 billion in 2024
- By Component - Blockchain technology segment accounted for the largest market revenue share in 2024
Market Size & Forecast
- Market Opportunities: USD 467.39 billion
- Market Future Opportunities: USD 415.12 billion
- CAGR from 2025 to 2030 : 49.7%
Market Summary
- The decentralized finance market is undergoing a significant transformation, driven by the demand for transparent and efficient financial systems. This evolution is characterized by the integration of core components like smart contracts and decentralized applications, which eliminate the need for traditional intermediaries.
- Key market drivers include rising investments in digital assets and the ability of protocols to offer enhanced cash flow through immediate settlement, which is particularly beneficial for businesses seeking operational agility.
- A real-world business scenario involves a global logistics company using automated data feeds to trigger instant payments to suppliers upon verified goods arrival, a process enabled by the programmable nature of decentralized systems. However, the industry faces challenges, notably security vulnerabilities in open-source code and the lack of a unified regulatory framework.
- These factors create a dynamic environment where innovation in areas like layer-two scaling solutions and zero-knowledge proofs is critical for building trust and achieving mainstream adoption. As the ecosystem matures, the focus remains on enhancing security, improving user experience, and establishing clear compliance pathways to unlock the full potential of a permissionless global economy.
What will be the Size of the Decentralized Finance Market during the forecast period?
Get Key Insights on Market Forecast (PDF) Get Free Sample
How is the Decentralized Finance Market Segmented?
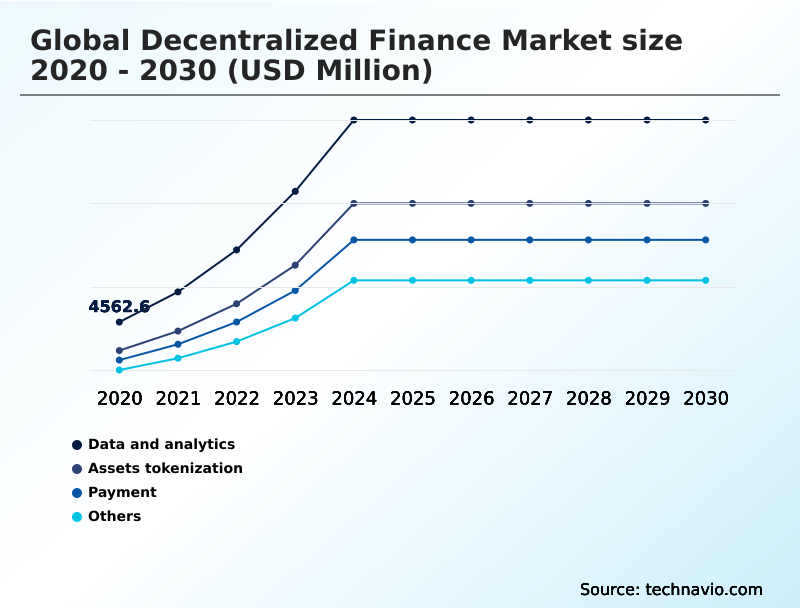
The decentralized finance industry research report provides comprehensive data (region-wise segment analysis), with forecasts and estimates in "USD million" for the period 2026-2030, as well as historical data from 2020-2024 for the following segments.
- Application
- Data and analytics
- Assets tokenization
- Payment
- Others
- Component
- Blockchain technology
- Decentralized application
- Smart contracts
- End-user
- Retail users
- Liquidity providers
- Institutional investors
- Developers
- Regulators and compliance services
- Geography
- North America
- US
- Canada
- Mexico
- Europe
- Germany
- UK
- France
- APAC
- China
- Japan
- India
- South America
- Brazil
- Argentina
- Colombia
- Middle East and Africa
- Saudi Arabia
- UAE
- South Africa
- Rest of World (ROW)
- North America
By Application Insights
The data and analytics segment is estimated to witness significant growth during the forecast period.
The data and analytics segment is foundational to the global decentralized finance market 2026-2030, providing the tools to transform raw on-chain data into actionable insights for decentralized lending protocols.
These platforms are crucial for monitoring liquidity pools and assessing total value locked, which is essential for institutional defi adoption strategy.
By using decentralized ledger technology and advanced peer-to-peer financial transactions, they allow for smarter risk assessment and responsive liquidity provision. The reliance on accurate on-chain data analytics supports market efficiency, especially as institutional-grade custody solutions become more common.
This analytical layer, built on innovations like decentralized indexing protocols, is critical for navigating the ecosystem, where recent analyses have identified cryptographic vulnerabilities across as many as 280 blockchains, highlighting the need for robust decentralized infrastructure.
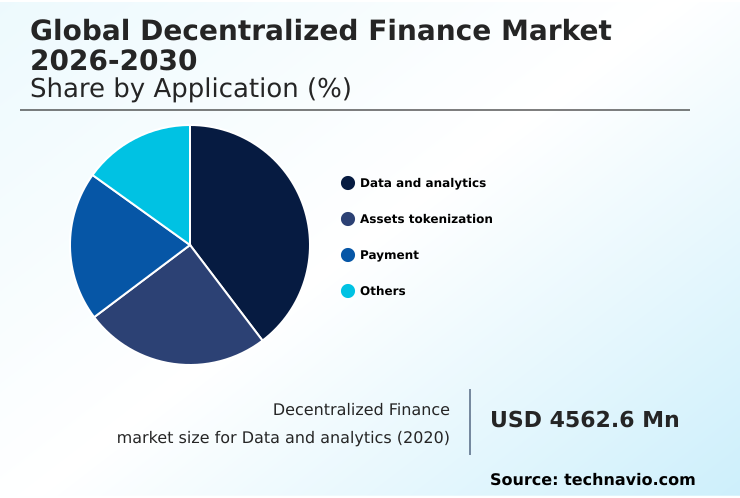
The Data and analytics segment was valued at USD 16.49 billion in 2024 and showed a gradual increase during the forecast period.
Regional Analysis
North America is estimated to contribute 53.9% to the growth of the global market during the forecast period.Technavio’s analysts have elaborately explained the regional trends and drivers that shape the market during the forecast period.
See How Decentralized Finance Market Demand is Rising in North America Get Free Sample
The geographic landscape of the global decentralized finance market 2026-2030 is diverse, with distinct regional drivers and adoption patterns.
North America leads in institutional investment, leveraging its deep capital markets and advanced technological infrastructure, and accounts for over 53% of the market's incremental growth. In this region, peer-to-peer insurance and decentralized derivatives trading are gaining traction.
Conversely, APAC is the fastest-growing region for retail adoption, with a CAGR of 50.4%, fueled by a mobile-first population seeking inclusive financial tools like decentralized identity management. This is enabled by permissionless access to decentralized autonomous organizations.
South America shows high adoption of stablecoin settlement for hedging against inflation, while Europe focuses on creating robust regulatory frameworks to support innovations like flash loan applications.
This global distribution underscores how decentralized finance is being adapted to solve specific economic challenges worldwide.
Market Dynamics
Our researchers analyzed the data with 2025 as the base year, along with the key drivers, trends, and challenges. A holistic analysis of drivers will help companies refine their marketing strategies to gain a competitive advantage.
- Navigating the global decentralized finance market 2026-2030 requires understanding its complex and evolving nature. A core consideration is the decentralized finance vs traditional finance debate, where DeFi's advantages in efficiency and accessibility are weighed against the established trust of CeFi. For participants, a crucial first step is a thorough smart contract security audit process, which is vital for mitigating risks.
- The implementation of layer two scaling for Ethereum has been a game-changer, addressing previous concerns about high transaction fees and network congestion. However, the industry still grapples with cross-chain bridge vulnerability analysis, as exploits in these areas pose systemic risks. The stablecoin mechanism for payments has proven to be a cornerstone for adoption, enabling seamless value transfer.
- Consequently, the institutional defi adoption strategy is maturing, moving from speculation to functional integration. As this occurs, developing robust defi regulation and compliance solutions becomes paramount for sustainable growth. Meanwhile, yield farming strategies for beginners continue to attract retail users, who must also understand the risks of impermanent loss.
- This dynamic environment is pushing developers toward creating more secure and user-friendly platforms, with some new protocols demonstrating transaction finality that is over 100 times faster than earlier iterations.
What are the key market drivers leading to the rise in the adoption of Decentralized Finance Industry?
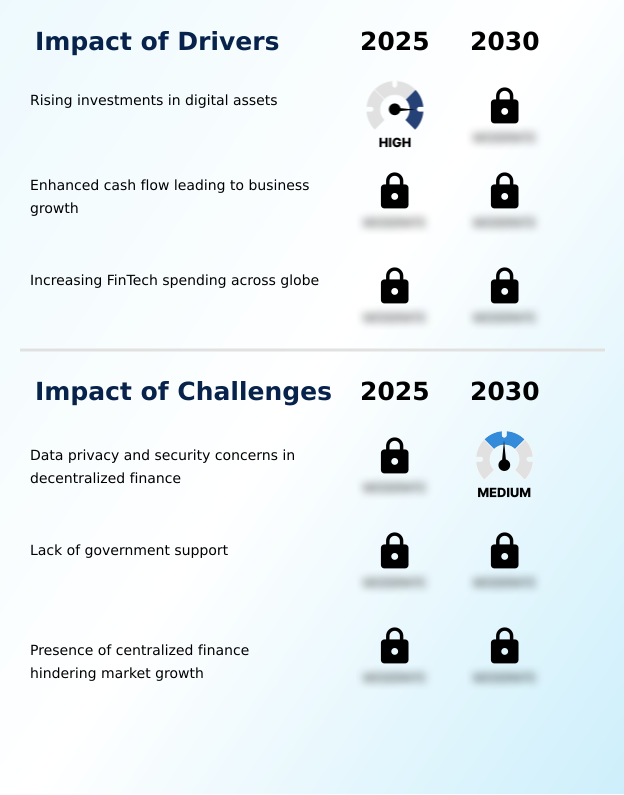
- Rising investments in digital assets are a key driver propelling the growth of the market.
- The global decentralized finance market 2026-2030 is propelled by the increasing institutional capital flowing into digital assets and the tangible efficiencies of decentralized protocols.
- The search for higher yields is driving investment firms to allocate significant capital to governance tokens and decentralized lending, enhancing liquidity. This influx of sophisticated investors fuels demand for decentralized derivatives and structured products.
- For enterprises, the ability of smart contracts to facilitate immediate settlement and 24/7 liquidity accelerates capital movement, improving working capital access and reducing processing times from days to minutes.
- This efficiency is particularly beneficial for small and medium enterprises, which see reduced overhead costs.
- FinTech spending on integrating decentralized ledger technology is also a major driver, with billions being invested to modernize backend systems, improving security and transparency for everyday transactions.
What are the market trends shaping the Decentralized Finance Industry?
- The increasing adoption of advanced technologies is a significant upcoming trend in the decentralized finance market, reshaping its operational landscape.
- Key trends in the global decentralized finance market 2026-2030 are driven by technological convergence and strategic partnerships. The integration of artificial intelligence with zero-knowledge proofs is enhancing the efficiency of permissionless lending and automated yield farming. This advancement enables smarter risk assessment and optimizes collateral ratios, leading to more responsive liquidity provision.
- The migration to layer-two scaling solutions has significantly reduced transaction costs for users by over 90% in some cases, broadening participation. Furthermore, strategic alliances between traditional financial institutions and decentralized protocols are creating hybrid products. These collaborations are essential for the long-term stability of the ecosystem, as evidenced by recent partnerships aimed at streamlining cross-border payments using stablecoins.
- This collaborative approach, combined with innovations in decentralized asset management, is paving the way for mainstream commercial adoption.
What challenges does the Decentralized Finance Industry face during its growth?
- Data privacy and security concerns represent a key challenge affecting the growth of the decentralized finance industry.
- Security vulnerabilities and regulatory ambiguity are primary challenges for the global decentralized finance market 2026-2030. The open-source nature of smart contracts makes them targets for malicious actors, with exploits like flash loan manipulations and re-entrancy attacks leading to the loss of millions of dollars.
- A recent analysis highlighted cryptographic vulnerabilities across 280 blockchains in cross-chain bridges, underscoring persistent security risks that undermine trust and deter institutional adoption of peer-to-peer lending. Concurrently, the lack of a unified regulatory framework creates a legal gray area, preventing many traditional financial institutions from committing capital.
- This inconsistency across jurisdictions stifles the growth of services like programmable dollar liquidity, as compliance becomes a significant hurdle for global operations within decentralized financial systems.
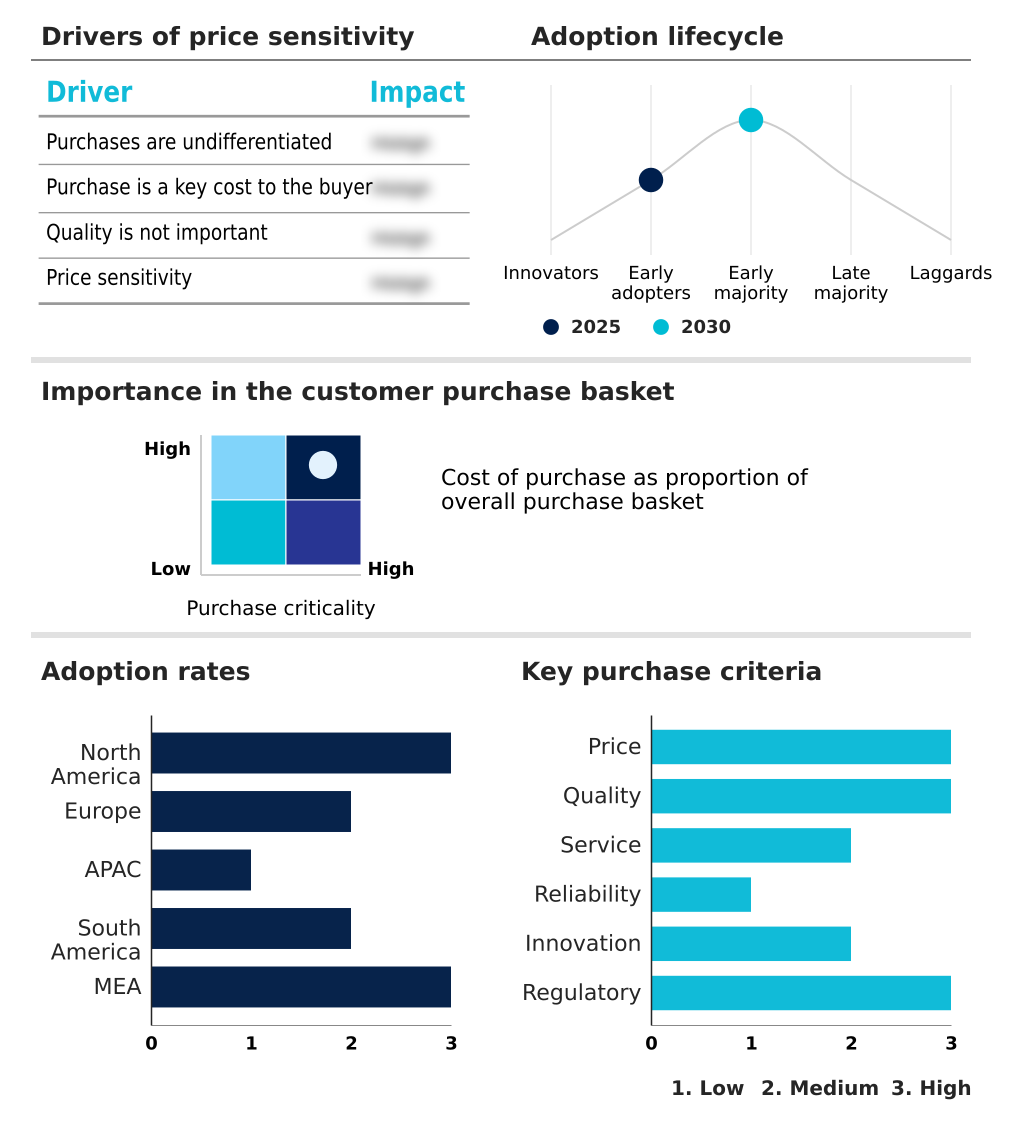
Exclusive Technavio Analysis on Customer Landscape
The decentralized finance market forecasting report includes the adoption lifecycle of the market, covering from the innovator’s stage to the laggard’s stage. It focuses on adoption rates in different regions based on penetration. Furthermore, the decentralized finance market report also includes key purchase criteria and drivers of price sensitivity to help companies evaluate and develop their market growth analysis strategies.
Customer Landscape of Decentralized Finance Industry
Competitive Landscape
Companies are implementing various strategies, such as strategic alliances, decentralized finance market forecast, partnerships, mergers and acquisitions, geographical expansion, and product/service launches, to enhance their presence in the industry.
Alchemy Insights Inc. - Provides core node infrastructure and developer APIs, empowering the creation of scalable decentralized applications and enhancing on-chain financial utility.
The industry research and growth report includes detailed analyses of the competitive landscape of the market and information about key companies, including:
- Alchemy Insights Inc.
- Banxa Holdings Inc.
- Beefy and Co.
- Binance Holdings Ltd.
- BTG Technology Holdings Ltd.
- Coinbase Global Inc.
- Fireblocks
- Ledger SAS
- Maker Ecosystem Holdings Inc.
- Matrixport
- MoonPay USA LLC
- Nexo Inc.
- OKX.COM
- Paxos Trust Company
- Stader.
- Sushi Labs
- Transak Inc.
Qualitative and quantitative analysis of companies has been conducted to help clients understand the wider business environment as well as the strengths and weaknesses of key industry players. Data is qualitatively analyzed to categorize companies as pure play, category-focused, industry-focused, and diversified; it is quantitatively analyzed to categorize companies as dominant, leading, strong, tentative, and weak.
Recent Development and News in Decentralized finance market
- In March, 2025, Halborn published a report identifying new cryptographic vulnerabilities in cross-chain bridges across 280 blockchains, highlighting significant security risks within the decentralized finance market.
- In August, 2025, Mastercard announced a strategic alliance with Zand to streamline cross-border payments using stablecoins, leveraging decentralized infrastructure to reduce remittance time and costs.
- In October, 2025, Franklin Templeton detailed the closing of a new $2 billion investment fund targeting infrastructure projects within the decentralized finance market, focusing on scalable and secure protocols for institutional use.
- In December, 2025, Visa announced a major expansion of its stablecoin settlement program, increasing its dedicated FinTech spending to integrate more deeply with public blockchain networks.
Dive into Technavio’s robust research methodology, blending expert interviews, extensive data synthesis, and validated models for unparalleled Decentralized Finance Market insights. See full methodology.
| Market Scope | |
|---|---|
| Page number | 299 |
| Base year | 2025 |
| Historic period | 2020-2024 |
| Forecast period | 2026-2030 |
| Growth momentum & CAGR | Accelerate at a CAGR of 49.7% |
| Market growth 2026-2030 | USD 415121.1 million |
| Market structure | Fragmented |
| YoY growth 2025-2026(%) | 45.2% |
| Key countries | US, Canada, Mexico, Germany, UK, France, Italy, Spain, The Netherlands, China, Japan, India, South Korea, Australia, Indonesia, Brazil, Argentina, Colombia, Saudi Arabia, UAE, South Africa, Israel and Turkey |
| Competitive landscape | Leading Companies, Market Positioning of Companies, Competitive Strategies, and Industry Risks |
Research Analyst Overview
- The global decentralized finance market 2026-2030 is defined by rapid innovation in its core components, including decentralized applications, automated market making, and smart contract automation. The expansion is driven by the utility of blockchain technology in creating transparent and efficient financial systems. Key offerings such as yield farming, decentralized exchanges, and liquidity pools are attracting both retail and institutional capital.
- The rise of self-custody solutions and on-chain data analytics empowers users with greater control and insight. However, this open environment presents significant security challenges. Boardroom decisions are increasingly focused on allocating substantial budgets toward mitigating risks from oracle failures, re-entrancy attacks, and flash loan manipulations, especially after analyses revealed vulnerabilities across 280 blockchains.
- This strategic focus on security, alongside the development of decentralized insurance and advanced oracle networks, is essential for building the trust required for long-term, sustainable market expansion and the continued evolution of on-chain finance.
What are the Key Data Covered in this Decentralized Finance Market Research and Growth Report?
-
What is the expected growth of the Decentralized Finance Market between 2026 and 2030?
-
USD 415.12 billion, at a CAGR of 49.7%
-
-
What segmentation does the market report cover?
-
The report is segmented by Application (Data and analytics, Assets tokenization, Payment, and Others), Component (Blockchain technology, Decentralized application, and Smart contracts), End-user (Retail users, Liquidity providers, Institutional investors, Developers, and Regulators and compliance services) and Geography (North America, Europe, APAC, South America, Middle East and Africa)
-
-
Which regions are analyzed in the report?
-
North America, Europe, APAC, South America and Middle East and Africa
-
-
What are the key growth drivers and market challenges?
-
Rising investments in digital assets, Data privacy and security concerns in decentralized finance
-
-
Who are the major players in the Decentralized Finance Market?
-
Alchemy Insights Inc., Banxa Holdings Inc., Beefy and Co., Binance Holdings Ltd., BTG Technology Holdings Ltd., Coinbase Global Inc., Fireblocks, Ledger SAS, Maker Ecosystem Holdings Inc., Matrixport, MoonPay USA LLC, Nexo Inc., OKX.COM, Paxos Trust Company, Stader., Sushi Labs and Transak Inc.
-
Market Research Insights
- The decentralized finance market is shaped by dynamic forces that influence adoption rates and operational models. The integration of hybrid financial products, which combine the security of regulated entities with the efficiency of decentralized networks, is a key factor.
- This approach has led to a measurable improvement in capital efficiency, with some protocols facilitating cross-border settlements in minutes compared to the multi-day processing times in traditional finance, representing a greater than 99% reduction in settlement delays. Furthermore, the rise of enterprise-level applications built on scalable blockchains has improved transaction throughput by over 50% for certain use cases.
- As automated cash flow management becomes more prevalent, businesses are gaining unprecedented control over their treasuries. The shift toward real-world asset tokenization is also expanding the market, offering new investment avenues and enhancing liquidity across previously illiquid asset classes.
We can help! Our analysts can customize this decentralized finance market research report to meet your requirements.
 RIA -
RIA - 
