Commercial Real Estate Market Size 2025-2029
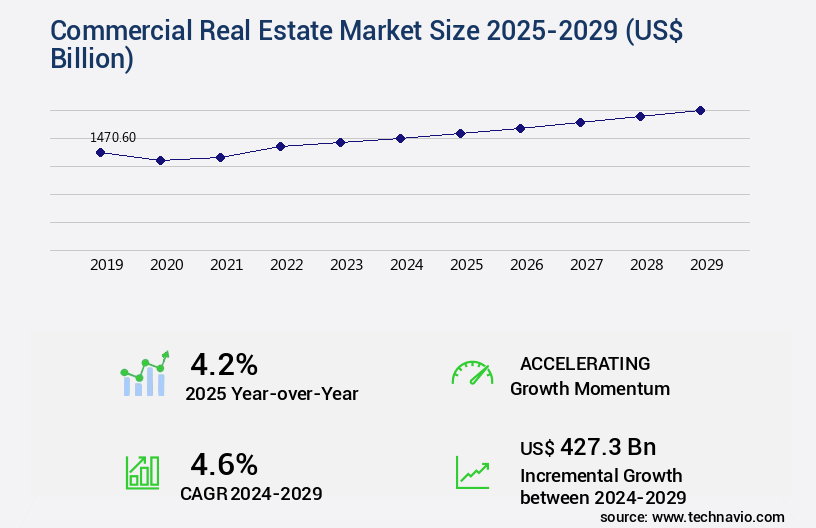
The commercial real estate market size is valued to increase USD 427.3 billion, at a CAGR of 4.6% from 2024 to 2029. Growing commercial sector globally will drive the commercial real estate market.
Major Market Trends & Insights
	- APAC dominated the market and accounted for a 42% growth during the forecast period.
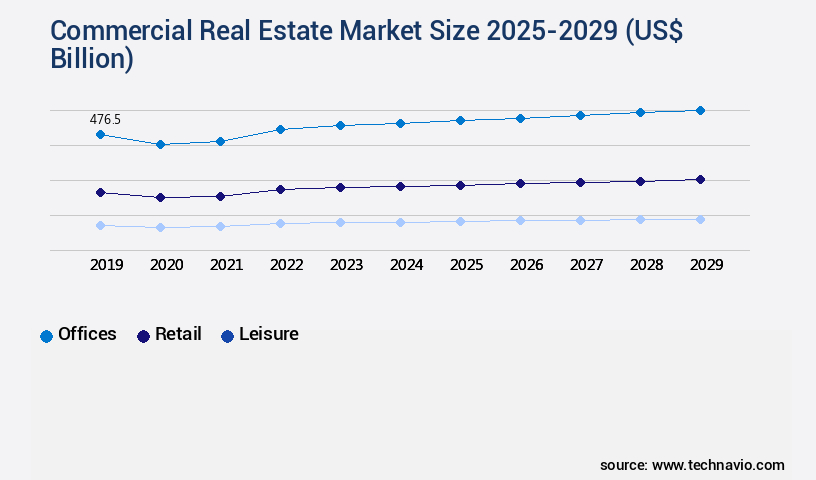
- By End-user - Offices segment was valued at USD 476.50 billion in 2023
- By Channel - Rental segment accounted for the largest market revenue share in 2023
Market Size & Forecast
	- Market Opportunities: USD 43.44 billion
- Market Future Opportunities: USD 427.30 billion
- CAGR : 4.6%
- APAC: Largest market in 2023
Market Summary
	- The market is a dynamic and ever-evolving sector that continues to shape the global business landscape. Core technologies and applications, such as Building Information Modeling (BIM) and Real Estate Information Systems (REIS), are increasingly being adopted to streamline operations and enhance efficiency. According to a recent report, the BIM market in the real estate sector is projected to grow at a steady pace, reaching a market share of 30% by 2025. Service types and product categories, including property management, brokerage, and construction services, are also experiencing significant changes. For instance, the growing trend of remote work and online shopping is driving demand for flexible and adaptable commercial spaces.
- Additionally, regulations and policies are evolving to accommodate these changes, with many governments investing in smart city initiatives and green building standards. Despite these opportunities, the market faces challenges such as economic uncertainty, changing demographics, and increasing competition. However, these challenges also present new opportunities for innovation and growth. For instance, the adoption of proptech solutions and the integration of artificial intelligence and machine learning are transforming the way commercial real estate is bought, sold, and managed. Overall, the market is a complex and dynamic ecosystem that requires constant monitoring and adaptation to stay ahead of the curve.
What will be the Size of the Commercial Real Estate Market during the forecast period?

Get Key Insights on Market Forecast (PDF) Request Free Sample
How is the Commercial Real Estate Market Segmented and what are the key trends of market segmentation?
The commercial real estate industry research report provides comprehensive data (region-wise segment analysis), with forecasts and estimates in "USD billion" for the period 2025-2029, as well as historical data from 2019-2023 for the following segments.
	- End-user
	
		- Offices
- Retail
- Leisure
- Others
 
- Channel
	
	
- Transaction Type
	
		- Commercial Leasing
- Property Sales
- Property Management
 
- Service Type
	
		- Brokerage Services
- Property Development
- Valuation Consulting
- Facilities Management
 
- Geography
	
		- North America
		
		
- Europe
		
		
- Middle East and Africa
		
		
- APAC
		
		
- South America
		
		
- Rest of World (ROW)


By End-user Insights
The offices segment is estimated to witness significant growth during the forecast period.
In the ever-evolving market, the offices segment is experiencing significant growth, driven by shifting work trends and corporate demands. Flexible work arrangements, hybrid models, and technological integration are transforming the need for office space. Businesses prioritize contemporary, adaptable, and technologically advanced workspaces to attract and retain talent. Co-working spaces like Regus and WeWork, which offer flexible office solutions, are gaining popularity. Major corporations, such as Google and Amazon, invest in innovative office designs that foster collaboration and employee satisfaction. According to recent market data, the offices end-user segment is projected to expand by 15% between 2024 and 2028, underscoring the continuous adaptation of workspaces to modern business practices.
Meanwhile, tenant occupancy rates remain a critical concern for commercial property owners. Lease agreement terms, negotiation strategies, and rent collection efficiency are essential factors in maintaining a healthy portfolio. Building lifecycle costs, code compliance, and investment return metrics are other essential considerations for property managers. Environmental impact assessments, construction cost estimating, and property tax appeals are also crucial elements in the market. Property value depreciation, commercial property insurance, and portfolio risk management are essential aspects of property management. Property management software, energy efficiency upgrades, and property tax assessments are key tools for optimizing operations and maximizing returns.
Lease renewal negotiations, tenant screening processes, and capitalization rate calculations are integral parts of the property management process. Property renovation costs, real estate development, vacancy rate trends, and property acquisition strategies are other essential market trends. Market rent analysis, due diligence processes, site selection criteria, and zoning regulations compliance are also crucial factors for investors and developers. The market is a dynamic and complex landscape, with ongoing trends and evolving patterns..

Request Free Sample
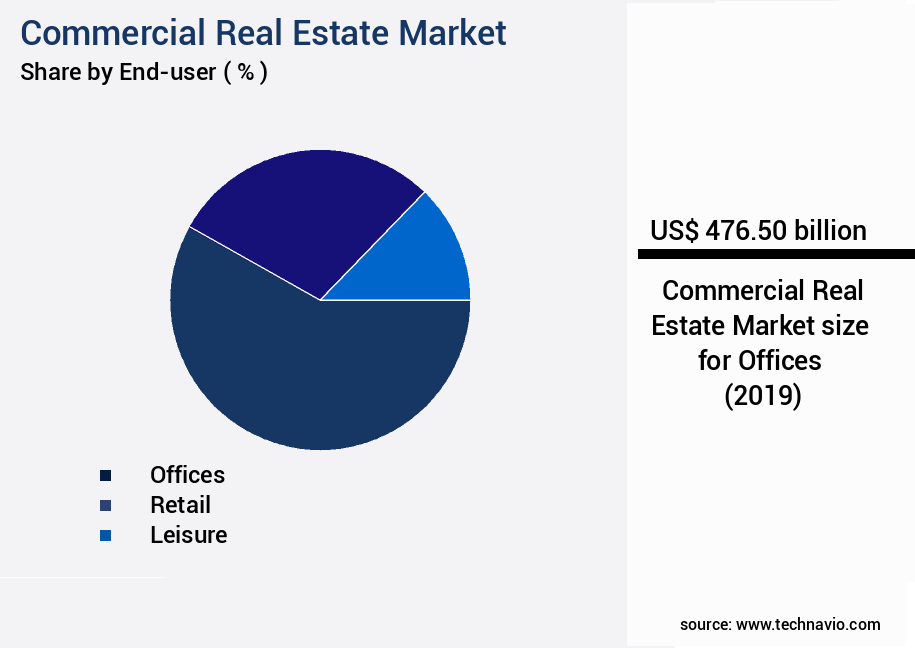
The Offices segment was valued at USD 476.50 billion in 2019 and showed a gradual increase during the forecast period.
Based on available data, the retail segment is anticipated to expand by 11% between 2024 and 2028, while the industrial segment is projected to grow by 12% during the same period. These growth expectations underscore the ongoing transformation of the market and the importance of staying informed about market trends and developments.

Request Free Sample
Regional Analysis
APAC is estimated to contribute 42% to the growth of the global market during the forecast period. Technavio's analysts have elaborately explained the regional trends and drivers that shape the market during the forecast period.

See How Commercial Real Estate Market Demand is Rising in APAC Request Free Sample
The market in APAC is experiencing significant growth, particularly in the industrial sector, driving the demand for office spaces in countries like China, Japan, India, South Korea, and Singapore. Rapid development is underway in various APAC nations, with India seeing substantial growth in its commercial construction sector. Emerging economies, including Vietnam, are also witnessing expansion. International real estate development presents opportunities for growth in countries like India, as evidenced by the MoU signed between the Jammu and Kashmir administrations and the Government of Dubai in October 2021, focusing on projects such as industrial parks, IT towers, and hospitals.
The industrial sector's growth and international development contribute to the ongoing evolution of the market in APAC.
Market Dynamics
Our researchers analyzed the data with 2024 as the base year, along with the key drivers, trends, and challenges. A holistic analysis of drivers will help companies refine their marketing strategies to gain a competitive advantage.
The market is a dynamic and complex ecosystem that encompasses various aspects, including building materials sustainability, property development feasibility studies, and managing commercial property risk. Sustainability is increasingly becoming a key factor in the industry, with impactful practices in this area reducing both environmental footprint and long-term operational costs. Commercial property insurance claims and effective lease negotiations are crucial elements in the market, requiring strategies to improve tenant retention and optimize space planning in office buildings. Property development feasibility studies and conducting property due diligence are essential steps in managing commercial property risk and implementing effective property maintenance programs.
Understanding commercial property taxes and improving energy efficiency in buildings are significant factors influencing property value. Sustainable building practices offer numerous benefits, such as reduced utility costs, enhanced tenant satisfaction, and improved environmental performance. Measuring tenant satisfaction and analyzing property investment returns are vital components of optimizing property portfolio performance. Managing expenses in commercial buildings and implementing robust rent collection systems are essential for ensuring financial success. Assessing risks in commercial real estate and optimizing property portfolio performance are ongoing challenges for investors and property managers. Notably, more than 70% of new property developments focus on energy-efficient designs, demonstrating a significant shift towards sustainable practices.
This trend not only benefits the environment but also offers cost savings and improved tenant satisfaction. By adhering to these strategies, commercial real estate stakeholders can effectively navigate the market's complexities and capitalize on its opportunities.

What are the key market drivers leading to the rise in the adoption of Commercial Real Estate Industry?
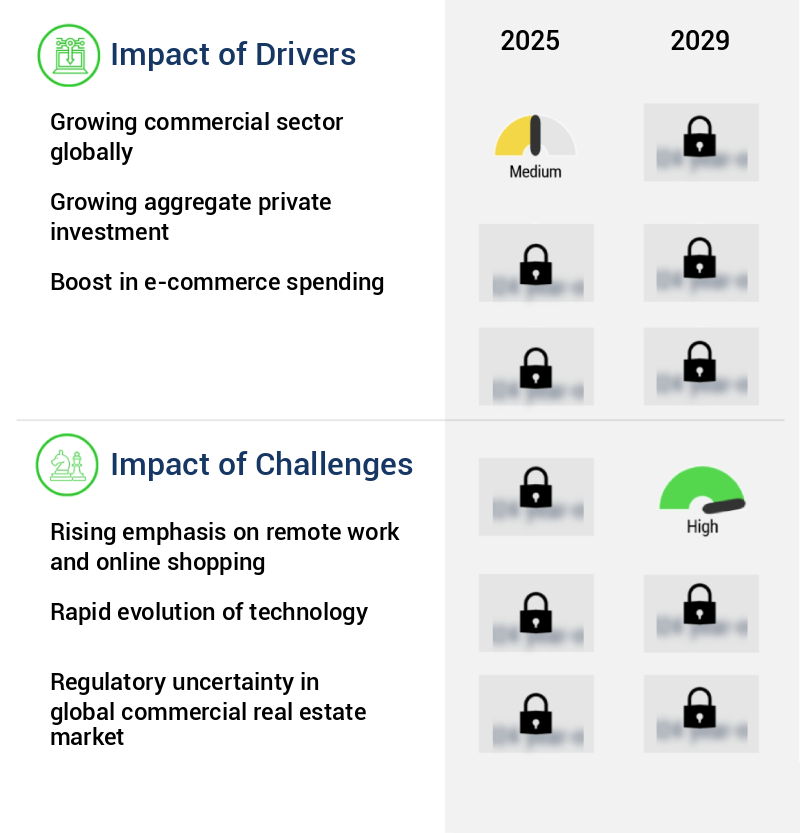
	- The global commercial sector's expansion serves as the primary catalyst for market growth. 
	- The commercial construction industry is experiencing a significant surge in growth, driven by the increasing number of commercial buildings under development worldwide. This trend is fueled by industrialization and urbanization in emerging economies like China, Thailand, Malaysia, and Indonesia. The Middle East has also seen a notable increase in spending on the construction of commercial spaces, institutional buildings, manufacturing plants, and public works. Foreign investment in commercial construction has significantly grown in countries like India, where major US, European, and Japanese companies view it as a promising market. The construction of offices, warehouses, and malls is on the rise, reflecting the ongoing evolution of business landscapes and consumer preferences.
- According to recent studies, the global commercial construction industry is expected to show substantial expansion during the forecast period. The growth is attributed to various factors, including the increasing demand for modern workspaces, the rise of e-commerce, and the ongoing trend of urbanization. In contrast, traditional construction methods are being replaced by innovative solutions that offer improved efficiency, sustainability, and cost savings. For instance, the adoption of Building Information Modeling (BIM) technology is gaining momentum, enabling architects, engineers, and construction professionals to collaborate more effectively and design more complex structures. Additionally, the use of prefabricated materials and modular construction techniques is becoming increasingly popular due to their speed, cost savings, and reduced environmental impact.
- In conclusion, the commercial construction industry is undergoing continuous transformation, driven by various factors such as urbanization, industrialization, and technological advancements. The ongoing trend of e-commerce and the increasing demand for modern workspaces are also contributing to the industry's growth.
What are the market trends shaping the Commercial Real Estate Industry?
	- Marketing initiatives are increasingly becoming more common in the business world. This trend signifies a significant focus on promoting products and services to expand customer bases.
	- In the dynamic market, companies employ integrated marketing communication strategies to sell their products effectively. They utilize various channels, including newspapers, magazines, social media, and TV advertisements, to reach potential customers. Companies initiate their campaigns with TV advertisements, followed by a comprehensive marketing effort that encompasses Internet pre-roll, social media, blogging, and interactive websites. This multi-pronged approach enhances brand authenticity and recognition, piquing consumer interest. Social media plays a pivotal role in this strategy, with visual content being a significant factor in customer engagement and the cultivation of online brand communities.
- For instance, companies use Instagram to exhibit ideas for utilizing their products in educational and recreational settings. The integration of marketing communication channels not only broadens reach but also fosters a cohesive brand narrative.
What challenges does the Commercial Real Estate Industry face during its growth?
	- The increasing prioritization of remote work and e-commerce is posing a significant challenge to the expansion of various industries. 
	- The shift towards digital commerce and remote work has significantly influenced the market. Traditional retail spaces and office buildings are experiencing a decline in demand due to the rise of online shopping and the increasing popularity of remote work. According to recent studies, e-commerce sales in the US are projected to account for over 17% of total retail sales by 2025, up from 14% in 2020. Simultaneously, the number of remote workers in the US is expected to reach 36.2 million by 2025, a 16% increase from 2019.
- These trends are leading businesses to reevaluate their real estate needs, with a growing preference for flexible, technology-enabled workspaces. This shift poses a challenge to traditional commercial real estate models, particularly those focused on office and retail spaces. However, it also presents opportunities for innovation and adaptation in the market.
Exclusive Customer Landscape
The commercial real estate market forecasting report includes the adoption lifecycle of the market, covering from the innovator's stage to the laggard's stage. It focuses on adoption rates in different regions based on penetration. Furthermore, the commercial real estate market report also includes key purchase criteria and drivers of price sensitivity to help companies evaluate and develop their market growth analysis strategies.

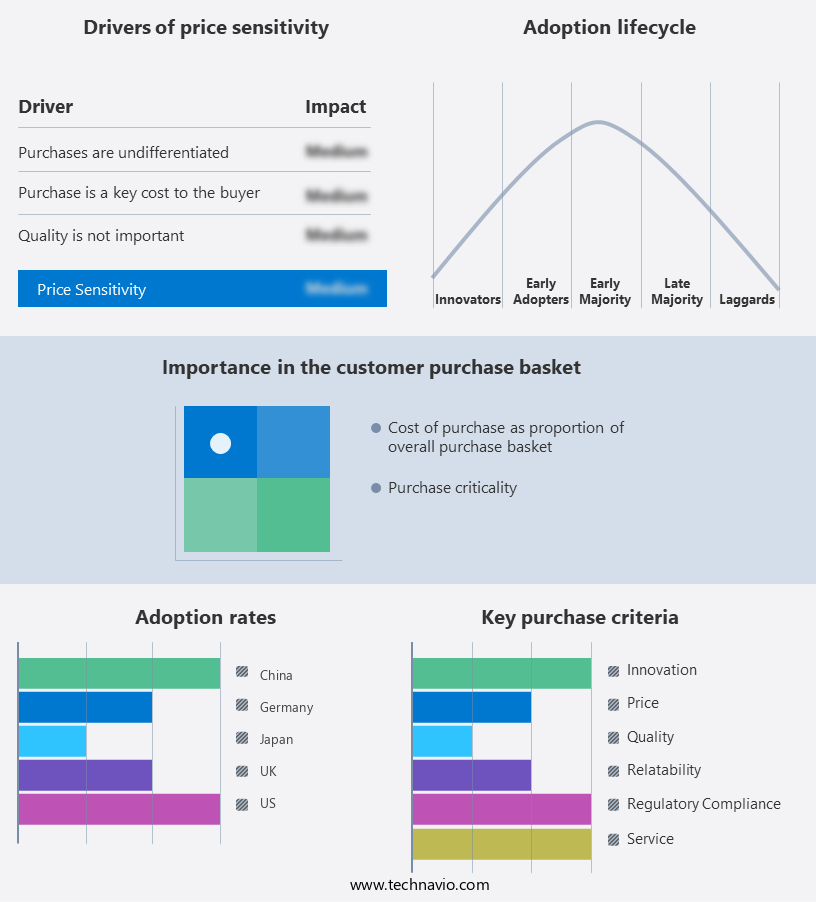
 Customer Landscape of Commercial Real Estate Industry
Competitive Landscape & Market Insights
Companies are implementing various strategies, such as strategic alliances, commercial real estate market forecast, partnerships, mergers and acquisitions, geographical expansion, and product/service launches, to enhance their presence in the industry.
American Tower Corp. - This company specializes in comprehensive evaluations of commercial real estate, focusing on assessing space plans, inspecting building systems, structures, adherence to codes, and facility conditions.
The industry research and growth report includes detailed analyses of the competitive landscape of the market and information about key companies, including:
	- American Tower Corp.
- Boston Properties Inc.
- Brookfield Asset Management Inc.
- CBRE Group Inc.
- China Resources Land Limited
- Coldwell Banker
- Colliers International
- DLF Ltd.
- Equinix Inc.
- Keller Williams Realty Inc.
- Link Asset Management Ltd.
- M&G Real Estate
- Onni Contracting Ltd.
- Prologis Inc.
- RE/MAX LLC
- Segro plc
- Simon Property Group L.P.
- Sotheby's International Realty Affiliates LLC
- Wanda Group
- Welltower Inc.
Qualitative and quantitative analysis of companies has been conducted to help clients understand the wider business environment as well as the strengths and weaknesses of key industry players. Data is qualitatively analyzed to categorize companies as pure play, category-focused, industry-focused, and diversified; it is quantitatively analyzed to categorize companies as dominant, leading, strong, tentative, and weak.
Recent Development and News in Commercial Real Estate Market
	- In January 2024, CBRE Group, a leading global commercial real estate services and investment firm, announced the acquisition of REAL Solutions, a technology-driven real estate consulting and analytics firm. This strategic move aimed to strengthen CBRE's technology capabilities and enhance its service offerings to clients (CBRE press release).
- In March 2024, Brookfield Properties, a leading commercial real estate company, secured a USD 1.5 billion equity investment from Blackstone Group for its flagship office property, Manhattan's Brookfield Place. This significant investment underscores the continued demand for prime commercial real estate assets (Bloomberg).
- In April 2025, the European Union passed the Sustainable Finance Disclosure Regulation, mandating large financial institutions to disclose the carbon footprint of their investments, including commercial real estate. This regulatory initiative is expected to accelerate the adoption of green buildings and sustainable real estate practices (European Parliament press release).
- In May 2025, JLL Spark, the venture capital arm of JLL, led a USD 50 million Series C funding round in VTS, a commercial real estate technology company. This investment will support VTS's continued growth and expansion of its leasing and asset management platform (VTS press release).
Dive into Technavio's robust research methodology, blending expert interviews, extensive data synthesis, and validated models for unparalleled Commercial Real Estate Market insights. See full methodology.
	
		
			| Market Scope | 
		
			| Report Coverage | Details | 
		
			| Page number | 205 | 
		
			| Base year | 2024 | 
		
			| Historic period | 2019-2023 | 
		
			| Forecast period | 2025-2029 | 
		
			| Growth momentum & CAGR | Accelerate at a CAGR of 4.6% | 
		
			| Market growth 2025-2029 | USD 427.3 billion | 
		
			| Market structure | Fragmented | 
		
			| YoY growth 2024-2025(%) | 4.2 | 
		
			| Key countries | US, Canada, Germany, UK, Italy, France, China, India, Japan, Brazil, Egypt, UAE, Oman, Argentina, KSA, UAE, Brazil, and Rest of World (ROW) | 
		
			| Competitive landscape | Leading Companies, Market Positioning of Companies, Competitive Strategies, and Industry Risks | 
	
Request Free Sample
Research Analyst Overview
	- In the dynamic and intricate world of commercial real estate, various elements intertwine to shape market activities and evolving patterns. Tenant occupancy rates, a critical indicator, fluctuate based on economic conditions and property location, impacting building lifecycle costs and investment return metrics. Lease agreement terms, including length and renewal options, significantly influence lease negotiation strategies and rent collection efficiency. Building code compliance is a constant concern, with ongoing assessments and upgrades necessary to maintain property value and safety. Environmental impact assessments and energy efficiency upgrades have gained prominence, driving construction cost estimating and property tax assessments.
- Property value depreciation, influenced by market rent analysis and due diligence processes, necessitates effective portfolio risk management and property tax appeals. Commercial property insurance, property management software, and property maintenance schedules are essential components of successful property ownership. Capitalization rate calculations and property renovation costs are vital factors in real estate development, while property acquisition strategies and site selection criteria shape the competitive landscape. Vacancy rate trends and lease renewal negotiations are key aspects of property management, with tenant screening processes and building lifecycle cost considerations playing significant roles. Property valuation models and investment return metrics are continually refined to maximize profitability and minimize risk.
- In this ever-evolving market, understanding the interplay between these elements is crucial for informed decision-making and long-term success.
What are the Key Data Covered in this Commercial Real Estate Market Research and Growth Report?
	- 
	What is the expected growth of the Commercial Real Estate Market between 2025 and 2029? 
- 
	What segmentation does the market report cover? 
		- 
		The report segmented by End-user (Offices, Retail, Leisure, and Others), Channel (Rental, Lease, and Sales), Geography (APAC, North America, Europe, South America, and Middle East and Africa), Transaction Type (Commercial Leasing, Property Sales, and Property Management), and Service Type (Brokerage Services, Property Development, Valuation Consulting, and Facilities Management) 
 
- 
	Which regions are analyzed in the report? 
		- 
		APAC, North America, Europe, South America, and Middle East and Africa 
 
- 
	What are the key growth drivers and market challenges? 
- 
	Who are the major players in the Commercial Real Estate Market? 
		- 
		Key Companies American Tower Corp., Boston Properties Inc., Brookfield Asset Management Inc., CBRE Group Inc., China Resources Land Limited, Coldwell Banker, Colliers International, DLF Ltd., Equinix Inc., Keller Williams Realty Inc., Link Asset Management Ltd., M&G Real Estate, Onni Contracting Ltd., Prologis Inc., RE/MAX LLC, Segro plc, Simon Property Group L.P., Sotheby's International Realty Affiliates LLC, Wanda Group, and Welltower Inc. 
 
Market Research Insights
	- The markets continue to evolve, with key components shaping investment strategies and operational efficiencies. Two significant areas of focus include building maintenance protocols and investment portfolio diversification. According to industry data, annual building maintenance costs can account for up to 3% of a property's value, emphasizing the importance of effective management. In contrast, a well-diversified investment portfolio can reduce risk by spreading assets across various sectors and property types. For instance, a portfolio with a 30% allocation to office space, 40% to industrial, and 30% to retail can help mitigate market volatility. By integrating advanced building security systems, lease administration, tenant satisfaction surveys, and property tax appeals, property owners can optimize occupancy costs, improve tenant retention, and enhance property value.
- Additionally, investment property analysis, construction project management, energy consumption tracking, and property tax rates play crucial roles in maximizing returns. Capital budgeting, risk assessment methodology, property debt financing, and space planning optimization are also essential components in the evolving commercial real estate landscape.
We can help! Our analysts can customize this commercial real estate market research report to meet your requirements. 
Get in touch
                        
          
            1 Executive Summary
- 1.1 Market overview- Executive Summary - Chart on Market Overview
- Executive Summary - Data Table on Market Overview
- Executive Summary - Chart on Global Market Characteristics
- Executive Summary - Chart on Market by Geography
- Executive Summary - Chart on Market Segmentation by End-user
- Executive Summary - Chart on Market Segmentation by Channel
- Executive Summary - Chart on Incremental Growth
- Executive Summary - Data Table on Incremental Growth
- Executive Summary - Chart on Company Market Positioning
 
2 Technavio Analysis
- 2.1 Analysis of price sensitivity, lifecycle, customer purchase basket, adoption rates, and purchase criteria- Analysis of price sensitivity, lifecycle, customer purchase basket, adoption rates, and purchase criteria
 
- 2.2 Criticality of inputs and Factors of differentiation- Overview on criticality of inputs and factors of differentiation
 
- 2.3 Factors of disruption- Overview on factors of disruption
 
- 2.4 Impact of drivers and challenges- Impact of drivers and challenges in 2024 and 2029
 
3 Market Landscape
- 3.1 Market ecosystem- Parent Market
- Data Table on - Parent Market
 
- 3.2 Market characteristics- Market characteristics analysis
 
4 Market Sizing
- 4.1 Market definition- Offerings of companies included in the market definition
 
- 4.2 Market segment analysis
- 4.4 Market outlook: Forecast for 2024-2029- Chart on Global - Market size and forecast 2024-2029 ($ billion)
- Data Table on Global - Market size and forecast 2024-2029 ($ billion)
- Chart on Global Market: Year-over-year growth 2024-2029 (%)
- Data Table on Global Market: Year-over-year growth 2024-2029 (%)
 
5 Historic Market Size
- 5.1 Global Commercial Real Estate Market 2019 - 2023- Historic Market Size - Data Table on Global Commercial Real Estate Market 2019 - 2023 ($ billion)
 
- 5.2 End-user segment analysis 2019 - 2023- Historic Market Size - End-user Segment 2019 - 2023 ($ billion)
 
- 5.3 Channel segment analysis 2019 - 2023- Historic Market Size - Channel Segment 2019 - 2023 ($ billion)
 
- 5.4 Geography segment analysis 2019 - 2023- Historic Market Size - Geography Segment 2019 - 2023 ($ billion)
 
- 5.5 Country segment analysis 2019 - 2023- Historic Market Size - Country Segment 2019 - 2023 ($ billion)
 
6 Qualitative Analysis
- 6.1 The AI impact on Global Commercial Real Estate Market
7 Five Forces Analysis
- 7.1 Five forces summary- Five forces analysis - Comparison between 2024 and 2029
 
- 7.2 Bargaining power of buyers- Bargaining power of buyers - Impact of key factors 2024 and 2029
 
- 7.3 Bargaining power of suppliers- Bargaining power of suppliers - Impact of key factors in 2024 and 2029
 
- 7.4 Threat of new entrants- Threat of new entrants - Impact of key factors in 2024 and 2029
 
- 7.5 Threat of substitutes- Threat of substitutes - Impact of key factors in 2024 and 2029
 
- 7.6 Threat of rivalry- Threat of rivalry - Impact of key factors in 2024 and 2029
 
- 7.7 Market condition- Chart on Market condition - Five forces 2024 and 2029
 
8 Market Segmentation by End-user
- 8.1 Market segments- Chart on End-user - Market share (2024-2029) (%)
- Data Table on End-user - Market share (2024-2029) (%)
 
- 8.2 Comparison by End-user- Chart on Comparison by End-user
- Data Table on Comparison by End-user
 
- 8.3 Offices - Market size and forecast (2024-2029)- Chart on Offices - Market size and forecast (2024-2029) ($ billion)
- Data Table on Offices - Market size and forecast (2024-2029) ($ billion)
- Chart on Offices - Year-over-year growth (2024-2029) (%)
- Data Table on Offices - Year-over-year growth (2024-2029) (%)
 
- 8.4 Retail - Market size and forecast (2024-2029)- Chart on Retail - Market size and forecast (2024-2029) ($ billion)
- Data Table on Retail - Market size and forecast (2024-2029) ($ billion)
- Chart on Retail - Year-over-year growth (2024-2029) (%)
- Data Table on Retail - Year-over-year growth (2024-2029) (%)
 
- 8.5 Leisure - Market size and forecast (2024-2029)- Chart on Leisure - Market size and forecast (2024-2029) ($ billion)
- Data Table on Leisure - Market size and forecast (2024-2029) ($ billion)
- Chart on Leisure - Year-over-year growth (2024-2029) (%)
- Data Table on Leisure - Year-over-year growth (2024-2029) (%)
 
- 8.6 Others - Market size and forecast (2024-2029)- Chart on Others - Market size and forecast (2024-2029) ($ billion)
- Data Table on Others - Market size and forecast (2024-2029) ($ billion)
- Chart on Others - Year-over-year growth (2024-2029) (%)
- Data Table on Others - Year-over-year growth (2024-2029) (%)
 
- 8.7 Market opportunity by End-user- Market opportunity by End-user ($ billion)
- Data Table on Market opportunity by End-user ($ billion)
 
9 Market Segmentation by Channel
- 9.1 Market segments- Chart on Channel - Market share (2024-2029) (%)
- Data Table on Channel - Market share (2024-2029) (%)
 
- 9.2 Comparison by Channel- Chart on Comparison by Channel
- Data Table on Comparison by Channel
 
- 9.3 Rental - Market size and forecast (2024-2029)- Chart on Rental - Market size and forecast (2024-2029) ($ billion)
- Data Table on Rental - Market size and forecast (2024-2029) ($ billion)
- Chart on Rental - Year-over-year growth (2024-2029) (%)
- Data Table on Rental - Year-over-year growth (2024-2029) (%)
 
- 9.4 Lease - Market size and forecast (2024-2029)- Chart on Lease - Market size and forecast (2024-2029) ($ billion)
- Data Table on Lease - Market size and forecast (2024-2029) ($ billion)
- Chart on Lease - Year-over-year growth (2024-2029) (%)
- Data Table on Lease - Year-over-year growth (2024-2029) (%)
 
- 9.5 Sales - Market size and forecast (2024-2029)- Chart on Sales - Market size and forecast (2024-2029) ($ billion)
- Data Table on Sales - Market size and forecast (2024-2029) ($ billion)
- Chart on Sales - Year-over-year growth (2024-2029) (%)
- Data Table on Sales - Year-over-year growth (2024-2029) (%)
 
- 9.6 Market opportunity by Channel- Market opportunity by Channel ($ billion)
- Data Table on Market opportunity by Channel ($ billion)
 
10 Market Segmentation by Transaction Type
- 10.1 Market segments- Chart on Transaction Type - Market share (2024-2029) (%)
- Data Table on Transaction Type - Market share (2024-2029) (%)
 
- 10.2 Comparison by Transaction Type- Chart on Comparison by Transaction Type
- Data Table on Comparison by Transaction Type
 
- 10.3 Commercial Leasing - Market size and forecast (2024-2029)- Chart on Commercial Leasing - Market size and forecast (2024-2029) ($ billion)
- Data Table on Commercial Leasing - Market size and forecast (2024-2029) ($ billion)
- Chart on Commercial Leasing - Year-over-year growth (2024-2029) (%)
- Data Table on Commercial Leasing - Year-over-year growth (2024-2029) (%)
 
- 10.4 Property Sales - Market size and forecast (2024-2029)- Chart on Property Sales - Market size and forecast (2024-2029) ($ billion)
- Data Table on Property Sales - Market size and forecast (2024-2029) ($ billion)
- Chart on Property Sales - Year-over-year growth (2024-2029) (%)
- Data Table on Property Sales - Year-over-year growth (2024-2029) (%)
 
- 10.5 Property Management - Market size and forecast (2024-2029)- Chart on Property Management - Market size and forecast (2024-2029) ($ billion)
- Data Table on Property Management - Market size and forecast (2024-2029) ($ billion)
- Chart on Property Management - Year-over-year growth (2024-2029) (%)
- Data Table on Property Management - Year-over-year growth (2024-2029) (%)
 
- 10.6 Market opportunity by Transaction Type- Market opportunity by Transaction Type ($ billion)
- Data Table on Market opportunity by Transaction Type ($ billion)
 
11 Market Segmentation by Service Type
- 11.1 Market segments- Chart on Service Type - Market share (2024-2029) (%)
- Data Table on Service Type - Market share (2024-2029) (%)
 
- 11.2 Comparison by Service Type- Chart on Comparison by Service Type
- Data Table on Comparison by Service Type
 
- 11.3 Brokerage Services - Market size and forecast (2024-2029)- Chart on Brokerage Services - Market size and forecast (2024-2029) ($ billion)
- Data Table on Brokerage Services - Market size and forecast (2024-2029) ($ billion)
- Chart on Brokerage Services - Year-over-year growth (2024-2029) (%)
- Data Table on Brokerage Services - Year-over-year growth (2024-2029) (%)
 
- 11.4 Property Development - Market size and forecast (2024-2029)- Chart on Property Development - Market size and forecast (2024-2029) ($ billion)
- Data Table on Property Development - Market size and forecast (2024-2029) ($ billion)
- Chart on Property Development - Year-over-year growth (2024-2029) (%)
- Data Table on Property Development - Year-over-year growth (2024-2029) (%)
 
- 11.5 Valuation Consulting - Market size and forecast (2024-2029)- Chart on Valuation Consulting - Market size and forecast (2024-2029) ($ billion)
- Data Table on Valuation Consulting - Market size and forecast (2024-2029) ($ billion)
- Chart on Valuation Consulting - Year-over-year growth (2024-2029) (%)
- Data Table on Valuation Consulting - Year-over-year growth (2024-2029) (%)
 
- 11.6 Facilities Management - Market size and forecast (2024-2029)- Chart on Facilities Management - Market size and forecast (2024-2029) ($ billion)
- Data Table on Facilities Management - Market size and forecast (2024-2029) ($ billion)
- Chart on Facilities Management - Year-over-year growth (2024-2029) (%)
- Data Table on Facilities Management - Year-over-year growth (2024-2029) (%)
 
- 11.7 Market opportunity by Service Type- Market opportunity by Service Type ($ billion)
- Data Table on Market opportunity by Service Type ($ billion)
 
12 Customer Landscape
- 12.1 Customer landscape overview- Analysis of price sensitivity, lifecycle, customer purchase basket, adoption rates, and purchase criteria
 
13 Geographic Landscape
- 13.1 Geographic segmentation- Chart on Market share by geography 2024-2029 (%)
- Data Table on Market share by geography 2024-2029 (%)
 
- 13.2 Geographic comparison- Chart on Geographic comparison
- Data Table on Geographic comparison
 
- 13.3 APAC - Market size and forecast 2024-2029- Chart on APAC - Market size and forecast 2024-2029 ($ billion)
- Data Table on APAC - Market size and forecast 2024-2029 ($ billion)
- Chart on APAC - Year-over-year growth 2024-2029 (%)
- Data Table on APAC - Year-over-year growth 2024-2029 (%)
 
- 13.4 North America - Market size and forecast 2024-2029- Chart on North America - Market size and forecast 2024-2029 ($ billion)
- Data Table on North America - Market size and forecast 2024-2029 ($ billion)
- Chart on North America - Year-over-year growth 2024-2029 (%)
- Data Table on North America - Year-over-year growth 2024-2029 (%)
 
- 13.5 Europe - Market size and forecast 2024-2029- Chart on Europe - Market size and forecast 2024-2029 ($ billion)
- Data Table on Europe - Market size and forecast 2024-2029 ($ billion)
- Chart on Europe - Year-over-year growth 2024-2029 (%)
- Data Table on Europe - Year-over-year growth 2024-2029 (%)
 
- 13.6 South America - Market size and forecast 2024-2029- Chart on South America - Market size and forecast 2024-2029 ($ billion)
- Data Table on South America - Market size and forecast 2024-2029 ($ billion)
- Chart on South America - Year-over-year growth 2024-2029 (%)
- Data Table on South America - Year-over-year growth 2024-2029 (%)
 
- 13.7 Middle East and Africa - Market size and forecast 2024-2029- Chart on Middle East and Africa - Market size and forecast 2024-2029 ($ billion)
- Data Table on Middle East and Africa - Market size and forecast 2024-2029 ($ billion)
- Chart on Middle East and Africa - Year-over-year growth 2024-2029 (%)
- Data Table on Middle East and Africa - Year-over-year growth 2024-2029 (%)
 
- 13.8 Japan - Market size and forecast 2024-2029- Chart on Japan - Market size and forecast 2024-2029 ($ billion)
- Data Table on Japan - Market size and forecast 2024-2029 ($ billion)
- Chart on Japan - Year-over-year growth 2024-2029 (%)
- Data Table on Japan - Year-over-year growth 2024-2029 (%)
 
- 13.9 US - Market size and forecast 2024-2029- Chart on US - Market size and forecast 2024-2029 ($ billion)
- Data Table on US - Market size and forecast 2024-2029 ($ billion)
- Chart on US - Year-over-year growth 2024-2029 (%)
- Data Table on US - Year-over-year growth 2024-2029 (%)
 
- 13.10 China - Market size and forecast 2024-2029- Chart on China - Market size and forecast 2024-2029 ($ billion)
- Data Table on China - Market size and forecast 2024-2029 ($ billion)
- Chart on China - Year-over-year growth 2024-2029 (%)
- Data Table on China - Year-over-year growth 2024-2029 (%)
 
- 13.11 India - Market size and forecast 2024-2029- Chart on India - Market size and forecast 2024-2029 ($ billion)
- Data Table on India - Market size and forecast 2024-2029 ($ billion)
- Chart on India - Year-over-year growth 2024-2029 (%)
- Data Table on India - Year-over-year growth 2024-2029 (%)
 
- 13.12 Germany - Market size and forecast 2024-2029- Chart on Germany - Market size and forecast 2024-2029 ($ billion)
- Data Table on Germany - Market size and forecast 2024-2029 ($ billion)
- Chart on Germany - Year-over-year growth 2024-2029 (%)
- Data Table on Germany - Year-over-year growth 2024-2029 (%)
 
- 13.13 UK - Market size and forecast 2024-2029- Chart on UK - Market size and forecast 2024-2029 ($ billion)
- Data Table on UK - Market size and forecast 2024-2029 ($ billion)
- Chart on UK - Year-over-year growth 2024-2029 (%)
- Data Table on UK - Year-over-year growth 2024-2029 (%)
 
- 13.14 Canada - Market size and forecast 2024-2029- Chart on Canada - Market size and forecast 2024-2029 ($ billion)
- Data Table on Canada - Market size and forecast 2024-2029 ($ billion)
- Chart on Canada - Year-over-year growth 2024-2029 (%)
- Data Table on Canada - Year-over-year growth 2024-2029 (%)
 
- 13.15 France - Market size and forecast 2024-2029- Chart on France - Market size and forecast 2024-2029 ($ billion)
- Data Table on France - Market size and forecast 2024-2029 ($ billion)
- Chart on France - Year-over-year growth 2024-2029 (%)
- Data Table on France - Year-over-year growth 2024-2029 (%)
 
- 13.16 Italy - Market size and forecast 2024-2029- Chart on Italy - Market size and forecast 2024-2029 ($ billion)
- Data Table on Italy - Market size and forecast 2024-2029 ($ billion)
- Chart on Italy - Year-over-year growth 2024-2029 (%)
- Data Table on Italy - Year-over-year growth 2024-2029 (%)
 
- 13.17 Brazil - Market size and forecast 2024-2029- Chart on Brazil - Market size and forecast 2024-2029 ($ billion)
- Data Table on Brazil - Market size and forecast 2024-2029 ($ billion)
- Chart on Brazil - Year-over-year growth 2024-2029 (%)
- Data Table on Brazil - Year-over-year growth 2024-2029 (%)
 
- 13.18 Market opportunity by geography- Market opportunity by geography ($ billion)
- Data Tables on Market opportunity by geography ($ billion)
 
- 13.19 Egypt - Market size and forecast (2024-2029)- Chart on Egypt - Market size and forecast (2024-2029) ($ billion)
- Data Table on Egypt - Market size and forecast (2024-2029) ($ billion)
- Chart on Egypt - Year-over-year growth (2024-2029) (%)
- Data Table on Egypt - Year-over-year growth (2024-2029) (%)
 
- 13.20 UAE - Market size and forecast (2024-2029)- Chart on UAE - Market size and forecast (2024-2029) ($ billion)
- Data Table on UAE - Market size and forecast (2024-2029) ($ billion)
- Chart on UAE - Year-over-year growth (2024-2029) (%)
- Data Table on UAE - Year-over-year growth (2024-2029) (%)
 
- 13.21 Oman - Market size and forecast (2024-2029)- Chart on Oman - Market size and forecast (2024-2029) ($ billion)
- Data Table on Oman - Market size and forecast (2024-2029) ($ billion)
- Chart on Oman - Year-over-year growth (2024-2029) (%)
- Data Table on Oman - Year-over-year growth (2024-2029) (%)
 
- 13.22 Argentina - Market size and forecast (2024-2029)- Chart on Argentina - Market size and forecast (2024-2029) ($ billion)
- Data Table on Argentina - Market size and forecast (2024-2029) ($ billion)
- Chart on Argentina - Year-over-year growth (2024-2029) (%)
- Data Table on Argentina - Year-over-year growth (2024-2029) (%)
 
- 13.23 KSA - Market size and forecast (2024-2029)- Chart on KSA - Market size and forecast (2024-2029) ($ billion)
- Data Table on KSA - Market size and forecast (2024-2029) ($ billion)
- Chart on KSA - Year-over-year growth (2024-2029) (%)
- Data Table on KSA - Year-over-year growth (2024-2029) (%)
 
- 13.24 Rest of World (ROW) - Market size and forecast (2024-2029)- Chart on Rest of World (ROW) - Market size and forecast (2024-2029) ($ billion)
- Data Table on Rest of World (ROW) - Market size and forecast (2024-2029) ($ billion)
- Chart on Rest of World (ROW) - Year-over-year growth (2024-2029) (%)
- Data Table on Rest of World (ROW) - Year-over-year growth (2024-2029) (%)
 
14 Drivers, Challenges, and Opportunity/Restraints
- 14.3 Impact of drivers and challenges- Impact of drivers and challenges in 2024 and 2029
 
- 14.4 Market opportunities/restraints
15 Competitive Landscape
- 15.2 Competitive Landscape- Overview on criticality of inputs and factors of differentiation
 
- 15.3 Landscape disruption- Overview on factors of disruption
 
- 15.4 Industry risks- Impact of key risks on business
 
16 Competitive Analysis
- 16.2 Market positioning of companies- Matrix on companies position and classification
 
- 16.3 American Tower Corp.- American Tower Corp. - Overview
- American Tower Corp. - Product / Service
- American Tower Corp. - Key offerings
 
- 16.4 Boston Properties Inc.- Boston Properties Inc. - Overview
- Boston Properties Inc. - Product / Service
- Boston Properties Inc. - Key offerings
 
- 16.5 Brookfield Asset Management Inc.- Brookfield Asset Management Inc. - Overview
- Brookfield Asset Management Inc. - Product / Service
- Brookfield Asset Management Inc. - Key offerings
 
- 16.6 CBRE Group Inc.- CBRE Group Inc. - Overview
- CBRE Group Inc. - Product / Service
- CBRE Group Inc. - Key offerings
 
- 16.7 China Resources Land Limited- China Resources Land Limited - Overview
- China Resources Land Limited - Product / Service
- China Resources Land Limited - Key offerings
 
- 16.8 Coldwell Banker- Coldwell Banker - Overview
- Coldwell Banker - Product / Service
- Coldwell Banker - Key offerings
 
- 16.9 Colliers International- Colliers International - Overview
- Colliers International - Product / Service
- Colliers International - Key offerings
 
- 16.10 DLF Ltd.- DLF Ltd. - Overview
- DLF Ltd. - Product / Service
- DLF Ltd. - Key offerings
 
- 16.11 Equinix Inc.- Equinix Inc. - Overview
- Equinix Inc. - Product / Service
- Equinix Inc. - Key offerings
 
- 16.12 Keller Williams Realty Inc.- Keller Williams Realty Inc. - Overview
- Keller Williams Realty Inc. - Product / Service
- Keller Williams Realty Inc. - Key offerings
 
- 16.13 Link Asset Management Ltd.- Link Asset Management Ltd. - Overview
- Link Asset Management Ltd. - Product / Service
- Link Asset Management Ltd. - Key offerings
 
- 16.14 M&G Real Estate- M&G Real Estate - Overview
- M&G Real Estate - Product / Service
- M&G Real Estate - Key offerings
 
- 16.15 Onni Contracting Ltd.- Onni Contracting Ltd. - Overview
- Onni Contracting Ltd. - Product / Service
- Onni Contracting Ltd. - Key offerings
 
- 16.16 Prologis Inc.- Prologis Inc. - Overview
- Prologis Inc. - Product / Service
- Prologis Inc. - Key offerings
 
- 16.17 RE/MAX LLC- RE/MAX LLC - Overview
- RE/MAX LLC - Product / Service
- RE/MAX LLC - Key offerings
 
- 16.18 Segro plc- Segro plc - Overview
- Segro plc - Product / Service
- Segro plc - Key offerings
 
- 16.19 Simon Property Group L.P.- Simon Property Group L.P. - Overview
- Simon Property Group L.P. - Product / Service
- Simon Property Group L.P. - Key offerings
 
- 16.20 Sotheby’s International Realty Affiliates LLC- Sotheby’s International Realty Affiliates LLC - Overview
- Sotheby’s International Realty Affiliates LLC - Product / Service
- Sotheby’s International Realty Affiliates LLC - Key offerings
 
- 16.21 Wanda Group- Wanda Group - Overview
- Wanda Group - Product / Service
- Wanda Group - Key offerings
 
- 16.22 Welltower Inc.- Welltower Inc. - Overview
- Welltower Inc. - Product / Service
- Welltower Inc. - Key offerings
 
- 16.23 Atlas Technical Consultants- Atlas Technical Consultants - Overview
- Atlas Technical Consultants - Product / Service
- Atlas Technical Consultants - Key offerings
 
- 16.24 Boston Commercial Properties Inc.- Boston Commercial Properties Inc. - Overview
- Boston Commercial Properties Inc. - Product / Service
- Boston Commercial Properties Inc. - Key offerings
 
- 16.25 Brookfield Business Partners LP- Brookfield Business Partners LP - Overview
- Brookfield Business Partners LP - Product / Service
- Brookfield Business Partners LP - Key offerings
 
- 16.26 CBRE Group Inc.- CBRE Group Inc. - Overview
- CBRE Group Inc. - Product / Service
- CBRE Group Inc. - Key offerings
 
- 16.27 Dalian Wanda Group- Dalian Wanda Group - Overview
- Dalian Wanda Group - Product / Service
- Dalian Wanda Group - Key offerings
 
- 16.28 DLF Ltd.- DLF Ltd. - Overview
- DLF Ltd. - Product / Service
- DLF Ltd. - Key offerings
 
- 16.29 Keller Williams Realty Inc.- Keller Williams Realty Inc. - Overview
- Keller Williams Realty Inc. - Product / Service
- Keller Williams Realty Inc. - Key offerings
 
- 16.30 Lee and Associates Licensing and Administration Co. LP- Lee and Associates Licensing and Administration Co. LP - Overview
- Lee and Associates Licensing and Administration Co. LP - Product / Service
- Lee and Associates Licensing and Administration Co. LP - Key offerings
 
- 16.31 Link Asset Management Ltd.- Link Asset Management Ltd. - Overview
- Link Asset Management Ltd. - Product / Service
- Link Asset Management Ltd. - Key offerings
 
- 16.32 Marcus and Millichap Real Estate Investment Services Inc.- Marcus and Millichap Real Estate Investment Services Inc. - Overview
- Marcus and Millichap Real Estate Investment Services Inc. - Product / Service
- Marcus and Millichap Real Estate Investment Services Inc. - Key offerings
 
- 16.33 MaxWell Realty Canada- MaxWell Realty Canada - Overview
- MaxWell Realty Canada - Product / Service
- MaxWell Realty Canada - Key offerings
 
- 16.34 NAI Global- NAI Global - Overview
- NAI Global - Product / Service
- NAI Global - Key offerings
 
- 16.35 Nakheel PJSC- Nakheel PJSC - Overview
- Nakheel PJSC - Product / Service
- Nakheel PJSC - Key offerings
 
- 16.36 Onni Contracting Ltd.- Onni Contracting Ltd. - Overview
- Onni Contracting Ltd. - Product / Service
- Onni Contracting Ltd. - Key offerings
 
- 16.37 Prologis Inc.- Prologis Inc. - Overview
- Prologis Inc. - Product / Service
- Prologis Inc. - Key offerings
 
- 16.38 RAK PROPERTIES- RAK PROPERTIES - Overview
- RAK PROPERTIES - Product / Service
- RAK PROPERTIES - Key offerings
 
- 16.39 Segro Plc- Segro Plc - Overview
- Segro Plc - Product / Service
- Segro Plc - Key offerings
 
- 16.40 Shannon Waltchack- Shannon Waltchack - Overview
- Shannon Waltchack - Product / Service
- Shannon Waltchack - Key offerings
 
- 16.41 TCN Worldwide- TCN Worldwide - Overview
- TCN Worldwide - Product / Service
- TCN Worldwide - Key offerings
 
- 16.42 WeWork Inc- WeWork Inc - Overview
- WeWork Inc - Product / Service
- WeWork Inc - Key offerings
 
17 Appendix
- 17.2 Inclusions and exclusions checklist- Inclusions checklist
- Exclusions checklist
 
- 17.3 Currency conversion rates for US$- Currency conversion rates for US$
 
- 17.4 Research methodology
- 17.7 Validation techniques employed for market sizing- Validation techniques employed for market sizing
 
- 17.9 360 degree market analysis- 360 degree market analysis
 
- 17.10 List of abbreviations