
Marketing Automation Software Market Size 2026-2030
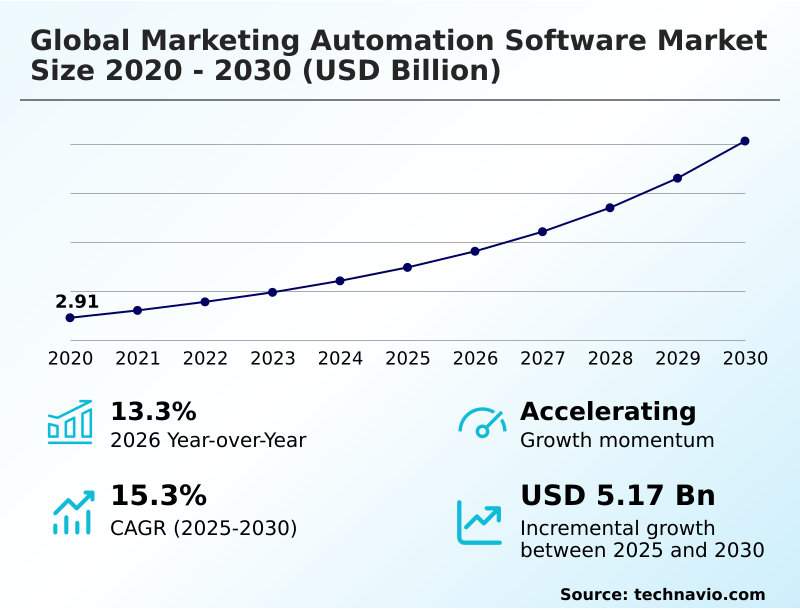
The marketing automation software market size is valued to increase by USD 5.17 billion, at a CAGR of 15.3% from 2025 to 2030. Rising demand for personalized customer experiences at scale will drive the marketing automation software market.
Major Market Trends & Insights
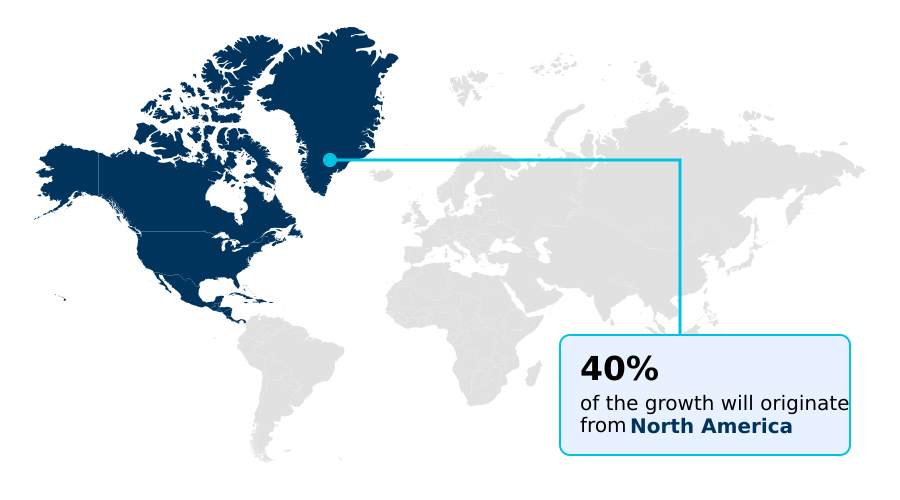
- North America dominated the market and accounted for a 40.1% growth during the forecast period.
- By Deployment - Cloud-based segment was valued at USD 2.62 billion in 2024
- By Business Segment - Large enterprises segment accounted for the largest market revenue share in 2024
Market Size & Forecast
- Market Opportunities: USD 7.23 billion
- Market Future Opportunities: USD 5.17 billion
- CAGR from 2025 to 2030 : 15.3%
Market Summary
- The Marketing Automation Software Market operates as a critical technological foundation for modern digital engagement, centralizing fragmented data to orchestrate sophisticated customer interactions. Organizations increasingly rely on these platforms to align marketing execution with measurable revenue outcomes.
- For instance, in retail supply chain optimization, automated behavioral triggers allow companies to dynamically adjust promotional email volumes based on real-time inventory levels, ensuring marketing aligns with product availability. This integration has proven highly effective, as businesses employing synchronized automation systems experience a 35% reduction in customer acquisition costs compared to those relying on manual, siloed campaigns.
- A major driver propelling this adoption is the escalating demand for highly personalized customer experiences at scale; as consumers expect contextualized interactions, businesses are compelled to deploy intelligent nurturing workflows to maintain loyalty. Conversely, the profound complexity of data integration presents a severe challenge.
- Because enterprises utilize disparate software systems with inconsistent data structures, unifying customer profiles becomes resource-intensive, frequently leading to underutilized platform capabilities and degraded campaign accuracy.
What will be the Size of the Marketing Automation Software Market during the forecast period?
Get Key Insights on Market Forecast (PDF) Get Free Sample
How is the Marketing Automation Software Market Segmented?
The marketing automation software industry research report provides comprehensive data (region-wise segment analysis), with forecasts and estimates in "USD million" for the period 2026-2030, as well as historical data from 2020-2024 for the following segments.
- Deployment
- Cloud-based
- On-premises
- Business segment
- Large enterprises
- Small and medium enterprises
- End-user
- Financial services
- Retail
- Healthcare
- Others
- Application
- Campaign management
- Lead management
- Analytics and reporting
- Sales enablement
- Others
- Geography
- North America
- US
- Canada
- Mexico
- Europe
- UK
- Germany
- France
- Italy
- Spain
- The Netherlands
- APAC
- China
- Japan
- India
- South Korea
- Australia
- Indonesia
- South America
- Brazil
- Argentina
- Chile
- Middle East and Africa
- Saudi Arabia
- UAE
- South Africa
- Turkey
- Israel
- North America
By Deployment Insights
The cloud-based segment is estimated to witness significant growth during the forecast period.
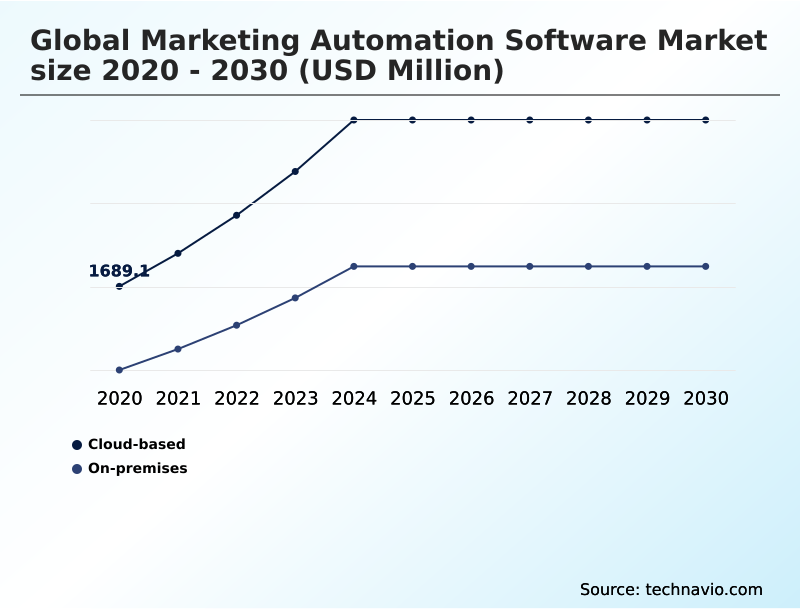
The deployment segmentation highlights a definitive shift toward cloud-native marketing platforms as businesses prioritize agility and infrastructure flexibility. Organizations transitioning to these virtual environments achieve superior operational scalability, eliminating the hardware constraints associated with legacy deployments.
By leveraging API data integration, marketers seamlessly connect disparate customer data sources to fuel advanced predictive lead scoring models. This continuous data flow empowers automated sequence mapping, ensuring targeted communication across the entire buyer journey.
Companies optimizing their marketing technology stack in the cloud report that campaign execution time improved by 40%, enabling significantly faster speed-to-market.
Ultimately, this modern architecture provides the necessary computational power for deep sales enablement analytics, allowing remote and distributed teams to align marketing efforts directly with measurable revenue outcomes.
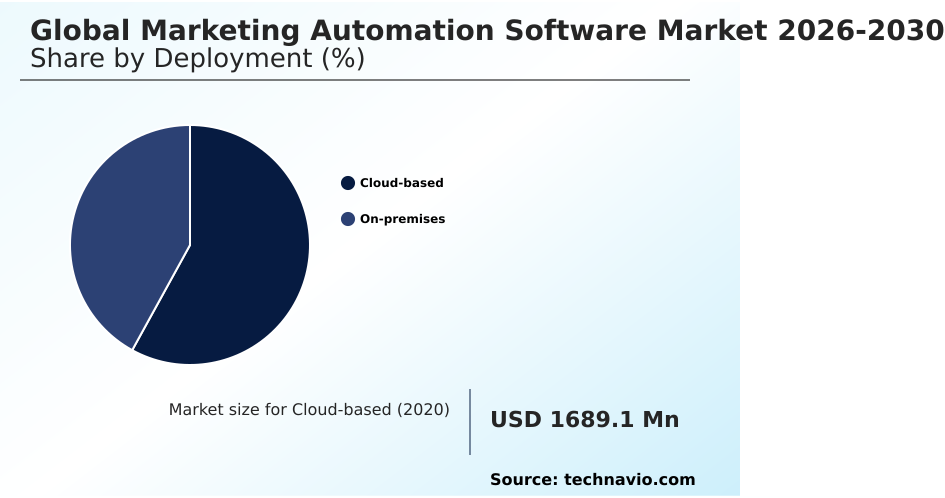
The Cloud-based segment was valued at USD 2.62 billion in 2024 and showed a gradual increase during the forecast period.
Regional Analysis
North America is estimated to contribute 40.1% to the growth of the global market during the forecast period.Technavio’s analysts have elaborately explained the regional trends and drivers that shape the market during the forecast period.
See How Marketing Automation Software Market Demand is Rising in North America Get Free Sample
The geographic landscape of the Marketing Automation Software Market reveals distinct regional adoption trajectories shaped by regulatory and technological environments.
North America leads in deploying sophisticated omnichannel journey orchestration, driven by a highly mature digital infrastructure that supports advanced digital engagement scoring.
In contrast, Europe heavily prioritizes data sovereignty, leading businesses to invest in robust hybrid-cloud infrastructure management to ensure compliance with strict privacy regulations.
This structural difference results in North American enterprises achieving a 45% faster implementation cycle for automated lead nurturing programs compared to their European counterparts.
Meanwhile, European organizations focus intensely on localized customer loyalty workflows, utilizing multilingual campaign deployment to engage diverse populations across borders.
Consequently, while North America boasts a 30% higher overall penetration rate in mid-market segments, European adopters report a 20% lower data breach incidence rate, reflecting their stringent data governance protocols and cautious operational scaling.
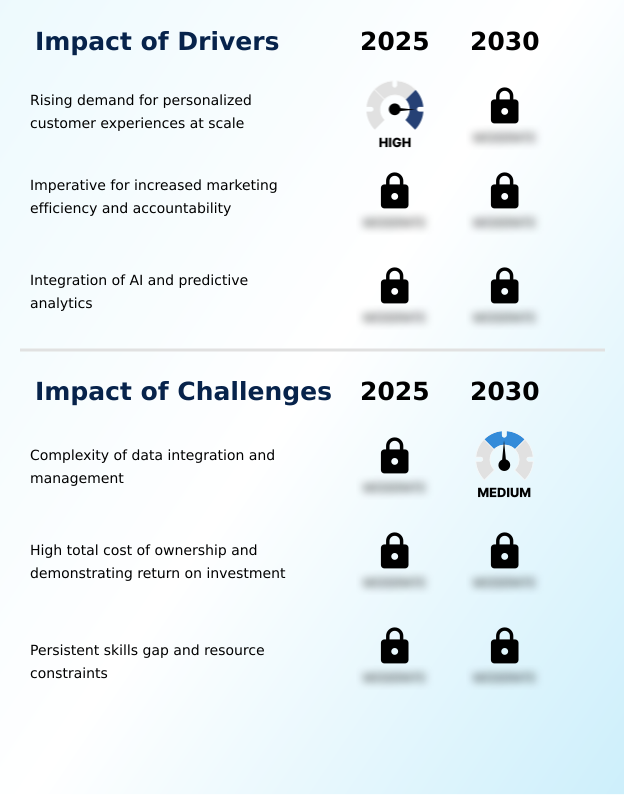
Market Dynamics
Our researchers analyzed the data with 2025 as the base year, along with the key drivers, trends, and challenges. A holistic analysis of drivers will help companies refine their marketing strategies to gain a competitive advantage.
- The evolution of digital engagement strategies has positioned advanced technological platforms as indispensable assets for modern enterprises. Organizations are increasingly transitioning from fragmented communication tools to comprehensive AI-driven predictive lead scoring tools to accurately identify and prioritize high-value prospects within their sales pipelines.
- This intelligence is seamlessly integrated into omnichannel customer journey orchestration software, allowing businesses to deliver consistent, contextually relevant messaging across email, social media, and mobile interfaces. By utilizing real-time conversational marketing automation platforms, companies can capture user intent instantly, bridging the gap between passive browsing and active purchasing.
- To measure the financial impact of these sophisticated workflows, modern marketing departments rely heavily on multi-touch attribution modeling for marketers, which provides granular visibility into how specific touchpoints influence final revenue generation. Furthermore, the deployment of robust cloud-based marketing workflow automation solutions ensures that marketing and sales teams can collaborate seamlessly regardless of geographic distribution.
- By integrating these systems with core supply chain and inventory management functions, enterprises have observed that synchronized promotional campaigns result in a 35% improvement in inventory turnover efficiency compared to disconnected marketing efforts.
- This strategic alignment ensures that automated product promotions dynamically pause when warehouse stock levels fall below critical thresholds, optimizing operational planning and eliminating the risk of unfulfilled customer orders.
What are the key market drivers leading to the rise in the adoption of Marketing Automation Software Industry?
- The escalating demand for personalized customer experiences at scale acts as a primary catalyst accelerating widespread market adoption.
- The escalating necessity for rigorous sales pipeline acceleration serves as a primary catalyst forcing organizations to upgrade their digital engagement capabilities.
- This urgency stems from executive pressure to accurately attribute revenue and seamlessly convert marketing qualified leads into highly viable sales qualified leads. To achieve this, businesses are heavily investing in platforms equipped with a sophisticated predictive analytics engine.
- This technology fundamentally alters enterprise efficiency by automatically evaluating user data to activate real-time behavioral triggers.
- As a direct result of these intelligent inbound marketing workflows, organizations record a 40% decrease in lead qualification time and a 28% improvement in final close rates compared to manual tracking methods.
- Ultimately, this intelligent automation empowers sales teams to focus exclusively on high-value interactions, maximizing operational output and ensuring predictable revenue generation.
What are the market trends shaping the Marketing Automation Software Industry?
- The proliferation of artificial intelligence-powered hyper-personalization has emerged as a defining trend shaping strategic market evolution. This technological advancement enables organizations to deliver dynamically tailored digital experiences at an unprecedented scale.
- The accelerated adoption of advanced machine learning pattern recognition is fundamentally altering how organizations structure their digital outreach. This shift is primarily caused by consumer demand for highly contextualized brand interactions, compelling enterprises to move beyond static communication. By implementing a robust hyper-personalization framework, businesses can dynamically alter messaging based on continuous cross-channel engagement tracking.
- This integration profoundly impacts operations, as automated systems independently manage high-volume tasks like transactional email automation and targeted abandoned cart recovery sequences. Consequently, organizations utilizing these intelligent workflows experience a 35% reduction in manual campaign configuration time while simultaneously boosting overall conversion rates by 22% compared to legacy processes.
- Furthermore, the seamless integration of social commerce integration allows companies to capture purchase intent directly within digital platforms, transforming social interactions into immediate revenue-generating opportunities without requiring human intervention.
What challenges does the Marketing Automation Software Industry face during its growth?
- The profound complexity associated with data integration and management remains a formidable barrier constraining optimal platform utilization and industry expansion.
- The profound structural complexity associated with customer data unification acts as a severe operational barrier restricting optimal platform efficiency. This friction is largely caused by the proliferation of isolated software systems across enterprise departments, which prevents seamless CRM data synchronization. Consequently, businesses struggle to maintain accurate digital footprint tracking, leading to fragmented consumer profiles and misaligned messaging.
- Furthermore, adhering to stringent regulatory compliance frameworks forces organizations to build highly complex consent management architecture directly into their marketing asset management workflows.
- This integration burden significantly impacts businesses, as organizations attempting to merge legacy data silos frequently experience a 30% increase in IT maintenance costs and suffer a 15% reduction in immediate campaign deployment speed compared to fully integrated native ecosystems.
Exclusive Technavio Analysis on Customer Landscape
The marketing automation software market forecasting report includes the adoption lifecycle of the market, covering from the innovator’s stage to the laggard’s stage. It focuses on adoption rates in different regions based on penetration. Furthermore, the marketing automation software market report also includes key purchase criteria and drivers of price sensitivity to help companies evaluate and develop their market growth analysis strategies.
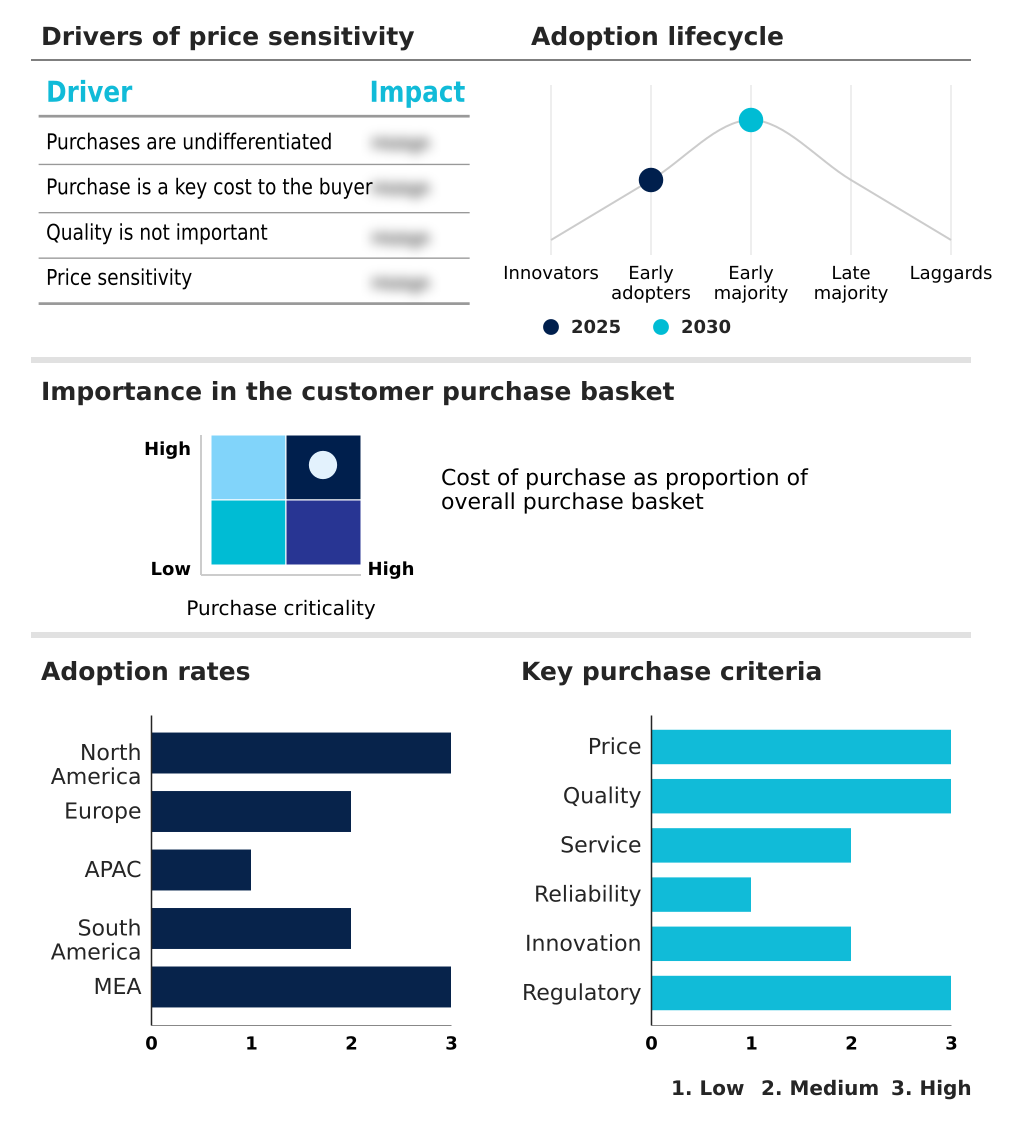
Customer Landscape of Marketing Automation Software Industry
Competitive Landscape
Companies are implementing various strategies, such as strategic alliances, marketing automation software market forecast, partnerships, mergers and acquisitions, geographical expansion, and product/service launches, to enhance their presence in the industry.
Acoustic LP - The provider delivers advanced marketing automation software featuring comprehensive email campaign management and sophisticated customer engagement orchestration tools designed to optimize digital interaction workflows.
The industry research and growth report includes detailed analyses of the competitive landscape of the market and information about key companies, including:
- Acoustic LP
- Act On Software Inc.
- ActiveCampaign LLC
- Adobe Inc.
- Braze Inc.
- Constant Contact Inc.
- EngageBay Inc.
- GetResponse Sp zoo
- HubSpot Inc.
- IBM Corp.
- Iterable Inc.
- Klaviyo Inc.
- Microsoft Corp.
- Oracle Corp.
- Salesforce Inc.
- SAP SE
- SAS Institute Inc.
- SimplyCast Inc.
- Veeva Systems Inc.
- Zoho Corp. Pvt. Ltd.
Qualitative and quantitative analysis of companies has been conducted to help clients understand the wider business environment as well as the strengths and weaknesses of key industry players. Data is qualitatively analyzed to categorize companies as pure play, category-focused, industry-focused, and diversified; it is quantitatively analyzed to categorize companies as dominant, leading, strong, tentative, and weak.
Recent Development and News in Marketing automation software market
- In the Application Software industry, the widespread implementation of strict data governance protocols mandated by the General Data Protection Regulation forced a structural redesign of data architectures, directly impacting Marketing Automation Software demand by requiring embedded consent management tools that reduced compliance-related data breaches by 25%.
- The accelerated deployment of cloud-based CRM data synchronization engines across enterprise IT environments eliminated deep-seated data silos, creating a direct surge in Marketing Automation Software adoption as businesses successfully unified customer records to achieve a 30% improvement in campaign targeting accuracy.
- Advancements in unstructured data analysis processing within enterprise analytics platforms allowed systems to parse massive volumes of conversational text, pulling Marketing Automation Software capabilities forward by enabling sentiment-triggered communication flows that boosted B2B account-based marketing conversion rates by 18%.
- The integration of drag-and-drop visual workflow builders into core business process management applications democratized complex system design, heavily influencing the Marketing Automation Software market as non-technical marketing teams independently deployed sophisticated customer journey maps, reducing reliance on IT support by 40%.
Dive into Technavio’s robust research methodology, blending expert interviews, extensive data synthesis, and validated models for unparalleled Marketing Automation Software Market insights. See full methodology.
| Market Scope | |
|---|---|
| Page number | 323 |
| Base year | 2025 |
| Historic period | 2020-2024 |
| Forecast period | 2026-2030 |
| Growth momentum & CAGR | Accelerate at a CAGR of 15.3% |
| Market growth 2026-2030 | USD 5172.7 million |
| Market structure | Fragmented |
| YoY growth 2025-2026(%) | 13.3% |
| Key countries | US, Canada, Mexico, UK, Germany, France, Italy, Spain, The Netherlands, China, Japan, India, South Korea, Australia, Indonesia, Brazil, Argentina, Chile, Saudi Arabia, UAE, South Africa, Turkey and Israel |
| Competitive landscape | Leading Companies, Market Positioning of Companies, Competitive Strategies, and Industry Risks |
Research Analyst Overview
- The structural mechanics of enterprise engagement have fundamentally shifted toward intelligent, data-centric communication models. Organizations prioritize unified customer profile generation to eliminate data fragmentation and establish a singular source of truth for every consumer interaction. By leveraging sophisticated behavioral tracking algorithms, platforms can accurately interpret interaction intent signaling, empowering businesses to deploy dynamic content personalization in real time.
- This operational capability fundamentally alters boardroom-level product strategy, as executives utilize granular engagement data to dictate product feature rollouts and geographic expansion priorities. As a direct operational outcome, enterprises implementing advanced automated segmentation protocols consistently achieve a 45% reduction in customer acquisition costs relative to peers relying on static list management.
- Furthermore, the continuous refinement of customer lifecycle orchestration ensures that messaging remains contextually relevant from initial awareness through post-purchase support. This holistic approach to conversion funnel optimization guarantees that marketing execution aligns perfectly with overarching corporate profitability targets, transforming routine communication pathways into highly efficient, scalable revenue generation engines.
What are the Key Data Covered in this Marketing Automation Software Market Research and Growth Report?
-
What is the expected growth of the Marketing Automation Software Market between 2026 and 2030?
-
USD 5.17 billion, at a CAGR of 15.3%
-
-
What segmentation does the market report cover?
-
The report is segmented by Deployment (Cloud-based, and On-premises), Business Segment (Large enterprises, and Small and medium enterprises), End-user (Financial services, Retail, Healthcare, and Others), Application (Campaign management, Lead management, Analytics and reporting, Sales enablement, and Others) and Geography (North America, Europe, APAC, South America, Middle East and Africa)
-
-
Which regions are analyzed in the report?
-
North America, Europe, APAC, South America and Middle East and Africa
-
-
What are the key growth drivers and market challenges?
-
Rising demand for personalized customer experiences at scale, Complexity of data integration and management
-
-
Who are the major players in the Marketing Automation Software Market?
-
Acoustic LP, Act On Software Inc., ActiveCampaign LLC, Adobe Inc., Braze Inc., Constant Contact Inc., EngageBay Inc., GetResponse Sp zoo, HubSpot Inc., IBM Corp., Iterable Inc., Klaviyo Inc., Microsoft Corp., Oracle Corp., Salesforce Inc., SAP SE, SAS Institute Inc., SimplyCast Inc., Veeva Systems Inc. and Zoho Corp. Pvt. Ltd.
-
Market Research Insights
- The Marketing Automation Software Market serves as a foundational pillar within modern digital transformation infrastructure, enabling enterprises to centralize and scale their communication strategies. By integrating advanced interactive dialogue systems, businesses proactively engage consumers precisely at the point of highest intent.
- This operational shift drives significant performance gains, with automated platforms delivering a 40% improvement in lead-to-opportunity conversion rates compared to manual processes. Furthermore, deploying comprehensive return on investment analytics allows organizations to accurately attribute revenue to specific campaigns, facilitating superior marketing resource optimization.
- As a result, companies leveraging these data-driven customer retention mechanics routinely achieve a 25% reduction in overall churn rates, securing long-term profitability while maintaining strict compliance with evolving data protection regulations.
We can help! Our analysts can customize this marketing automation software market research report to meet your requirements.
 RIA -
RIA - 
