
Digital Transformation In Retail Sector Market Size 2026-2030
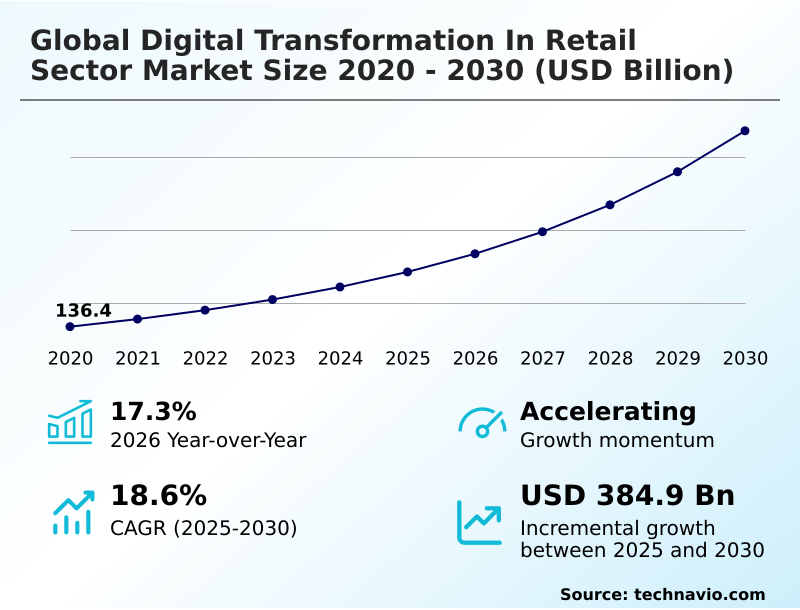
The Digital Transformation In Retail Sector Market size was valued at USD 285.6 billion in 2025, growing at a CAGR of 18.6% during the forecast period 2026-2030.
Major Market Trends & Insights
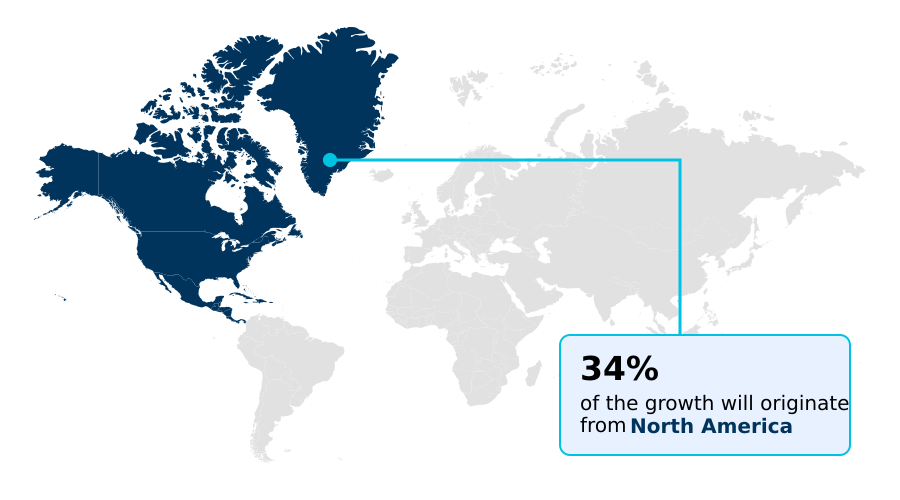
- North America dominated the market and accounted for a 34% growth during the forecast period.
- By Technology - IoT segment was valued at USD 62.1 billion in 2024
- By Product - Consumer electronics segment accounted for the largest market revenue share in 2024
Market Size & Forecast
- Historic Market Opportunities 2020-2024: USD 534.1 billion
- Market Future Opportunities 2025-2030: USD 384.9 billion
- CAGR from 2025 to 2030 : 18.6%
Market Summary
- The digital transformation in retail sector market is characterized by a strategic pivot toward intelligent automation and data-driven customer engagement. The market's growth momentum is accelerating, with year-over-year growth increasing from 15.5% to over 16% in consecutive periods, indicating intensifying investment.
- For instance, a retailer might implement an AI-powered supply chain platform that analyzes real-time sales and external data, improving demand forecast accuracy by more than 20% compared to traditional methods. This shift is driven by the imperative to meet evolving consumer demands for hyper-personalization.
- However, progress is constrained by significant challenges, notably the complexity and high cost of integrating modern digital solutions with entrenched legacy IT systems, which can hinder the creation of a truly unified omnichannel experience.
What will be the Size of the Digital Transformation In Retail Sector Market during the forecast period?
Get Key Insights on Market Forecast (PDF) Request Free Sample
How is the Digital Transformation In Retail Sector Market Segmented?
The digital transformation in retail sector industry research report provides comprehensive data (region-wise segment analysis), with forecasts and analysis for the period 2026-2030, as well as historical data from 2020-2024 for the following segments.
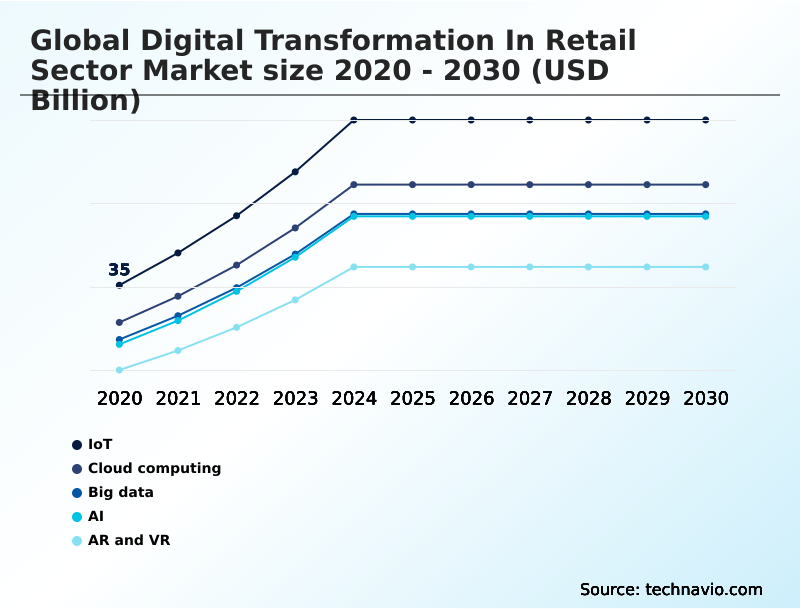
- Technology
- IoT
- Cloud computing
- Big data
- AI
- AR and VR
- Product
- Consumer electronics
- Media and entertainment
- Apparel
- Food and beverage
- Others
- Application
- Omnichannel retailing
- Customer personalization and CRM
- Supply chain and inventory management
- Geography
- North America
- US
- Canada
- Mexico
- Europe
- Germany
- UK
- France
- APAC
- China
- India
- Japan
- Middle East and Africa
- UAE
- Saudi Arabia
- South Africa
- South America
- Brazil
- Argentina
- Colombia
- Rest of World (ROW)
- North America
How is the Digital Transformation In Retail Sector Market Segmented by Technology?
The iot segment is estimated to witness significant growth during the forecast period.
The global digital transformation in retail sector market is segmented by technology, where cloud computing infrastructure holds a 25.3% share, and by product.
Utilizing big data analytics allows for dynamic pricing models that can improve margins by 5% compared to static pricing. In the product segment, consumer electronics leads, driven by demand for connected devices.
Technologies like blockchain for transparency are gaining traction for sustainable retail operations, addressing consumer demand for ethical sourcing.
Solutions for inventory management and customer relationship management are critical across all segments, often enhanced by AI-powered chatbots to improve service efficiency and personalize interactions.
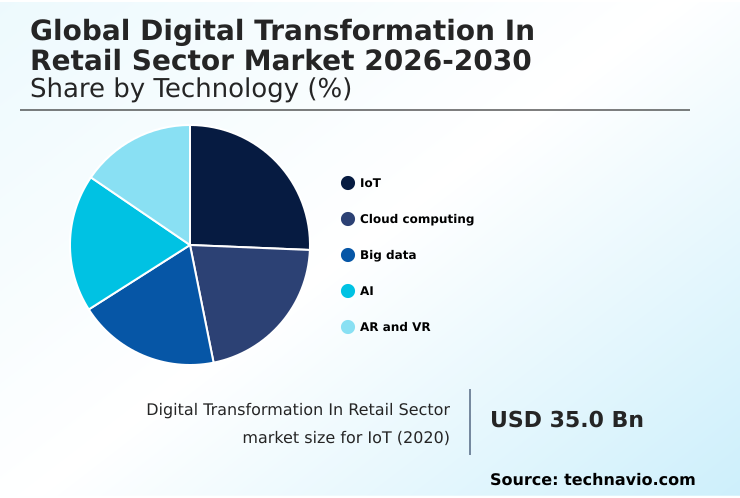
The IoT segment was valued at USD 62.1 billion in 2024 and showed a gradual increase during the forecast period.
How demand for the Digital Transformation In Retail Sector market is rising in the leading region?
North America is estimated to contribute 34% to the growth of the global market during the forecast period.Technavio’s analysts have elaborately explained the regional trends and drivers that shape the market during the forecast period.
See How Digital Transformation In Retail Sector Market demand is rising in North America Request Free Sample
The global digital transformation in retail sector market shows significant regional disparities, with North America leading in market maturity and accounting for 34% of the incremental growth opportunity, substantially higher than APAC's 25%.
This dominance is driven by the US, where deep investments in supply chain automation and omnichannel strategies are standard.
In contrast, the APAC market, led by China and India, is characterized by a mobile-first consumer base and the rapid adoption of social commerce integration and super-apps.
While North American retailers focus on optimizing existing infrastructure with edge computing in retail and real-time analytics dashboards, APAC retailers are leapfrogging legacy systems, resulting in different technology adoption curves.
For example, the use of computer vision for automated checkout has a 15% higher adoption rate in select Asian metropolitan areas compared to North American counterparts, reflecting different consumer behaviors and infrastructure.
What are the key Drivers, Trends, and Challenges in the Digital Transformation In Retail Sector Market?
Our researchers analyzed the data with 2025 as the base year, along with the key drivers, trends, and challenges. A holistic analysis of drivers will help companies refine their marketing strategies to gain a competitive advantage.
- Successfully navigating the digital transformation in retail requires a deep understanding of several strategic pillars. For leadership, clarifying the benefits of AI in retail supply chain is the first step, as it directly leads to measurable improvements in efficiency and cost reduction, with automated systems reducing fulfillment errors by up to 30% compared to manual processes.
- However, knowing how to implement omnichannel retail strategy is the central challenge. This involves more than just technology; it is a fundamental shift in business process and culture. Organizations often face significant challenges of integrating legacy retail systems, where technical debt can stall progress and inflate project costs.
- A key differentiator lies in using AR for in-store customer engagement, which transforms the physical store into an interactive, experience-driven space and can increase dwell time by over 15%. Ultimately, the role of big data in customer personalization is paramount, enabling the tailored experiences that build loyalty.
- The impact of IoT on retail operations further ties this together, providing the real-time data needed for smart inventory management and responsive in-store environments, creating a truly connected ecosystem.
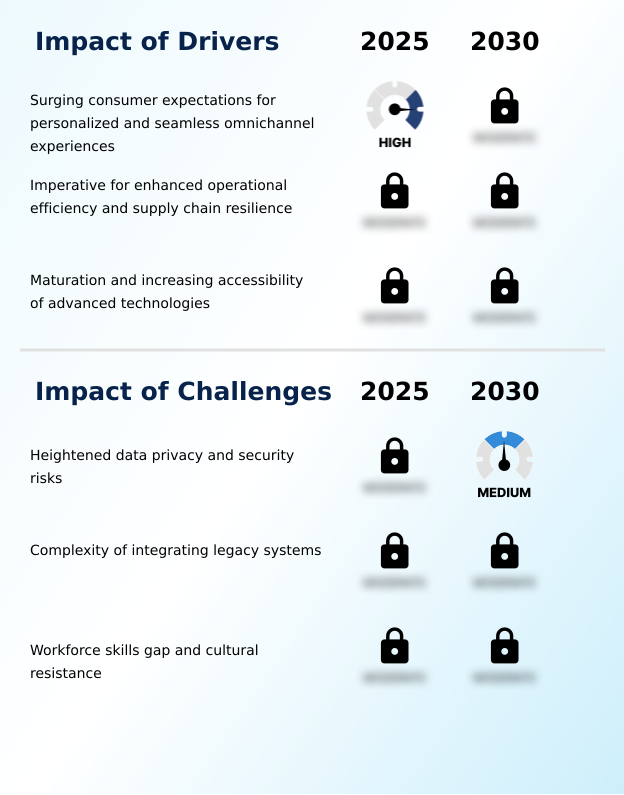
What are the key market drivers leading to the rise in the adoption of Digital Transformation In Retail Sector Industry?
- Surging consumer expectations for personalized, context-aware, and seamless omnichannel experiences across all retail touchpoints is the primary driver compelling widespread investment in transformative digital technologies.
- Surging consumer expectations for hyper-personalized and frictionless experiences are a primary driver for the digital transformation in retail sector market. Modern shoppers demand a unified customer journey mapping, where interactions across mobile, web, and physical stores are seamlessly connected.
- This forces retailers to adopt an omnichannel retailing approach, supported by technologies like predictive inventory management and efficient click-and-collect services, which can increase foot traffic by over 20%.
- The intense pressure to improve operational efficiency and build resilient supply chains is another critical driver. Utilizing AI for demand forecasting and supply chain optimization allows retailers to reduce stockouts by up to 15%.
- This pursuit of a lean, agile operation, enabled by a comprehensive supply chain visibility platform, is essential for survival in a market with thin profit margins and increasing volatility.
What are the market trends shaping the Digital Transformation In Retail Sector Industry?
- The adoption of fully integrated phygital ecosystems is a significant trend, merging physical and digital environments to create a continuous, interactive customer journey. This evolution reimagines brick-and-mortar stores as experiential, data-rich hubs.
- A dominant trend shaping the digital transformation in retail is the rise of the phygital retail strategy, which creates a seamless, continuous journey between online and offline channels. This move toward experiential retail concepts is transforming physical stores into digitally-augmented hubs where technologies like AR/VR integration enable virtual try-on technology, which can reduce product returns by up to 30%.
- Concurrently, the deployment of agentic AI is revolutionizing both operations and customer service. These autonomous systems can manage complex supply chain logistics or act as hyper-personalized shoppers, moving beyond simple task automation.
- Another key trend is technology-driven transparency, where digital product passports are used for ethical sourcing verification, meeting growing consumer demand for sustainable practices and creating a new layer of brand trust.
What challenges does the Digital Transformation In Retail Sector Industry face during its growth?
- Heightened data privacy and security risks are a primary challenge, as the expanded collection of customer data to fuel personalization makes retail operations more vulnerable to cyberattacks and complex regulatory compliance.
- A primary challenge hindering the digital transformation in retail is the complexity of legacy system integration. Many retailers operate on outdated platforms, making it difficult to implement a modern customer data platform or achieve a frictionless shopping experience, often leading to project delays of over two quarters. These integration issues create significant operational hurdles.
- Furthermore, escalating data privacy compliance requirements and cybersecurity framework vulnerabilities present a formidable restraint. As retailers collect more granular data to power personalization, they must implement robust data governance policies to prevent breaches, which can erode customer trust by more than 50%. This high-stakes environment diverts significant resources from innovation.
- Compounding these issues is the widespread workforce upskilling gap, where employees lack the necessary training to effectively utilize new digital tools, limiting the ROI on technology investments.
Exclusive Technavio Analysis on Customer Landscape
The digital transformation in retail sector market forecasting report includes the adoption lifecycle of the market, covering from the innovator’s stage to the laggard’s stage. It focuses on adoption rates in different regions based on penetration. Furthermore, the digital transformation in retail sector market report also includes key purchase criteria and drivers of price sensitivity to help companies evaluate and develop their market growth analysis strategies.
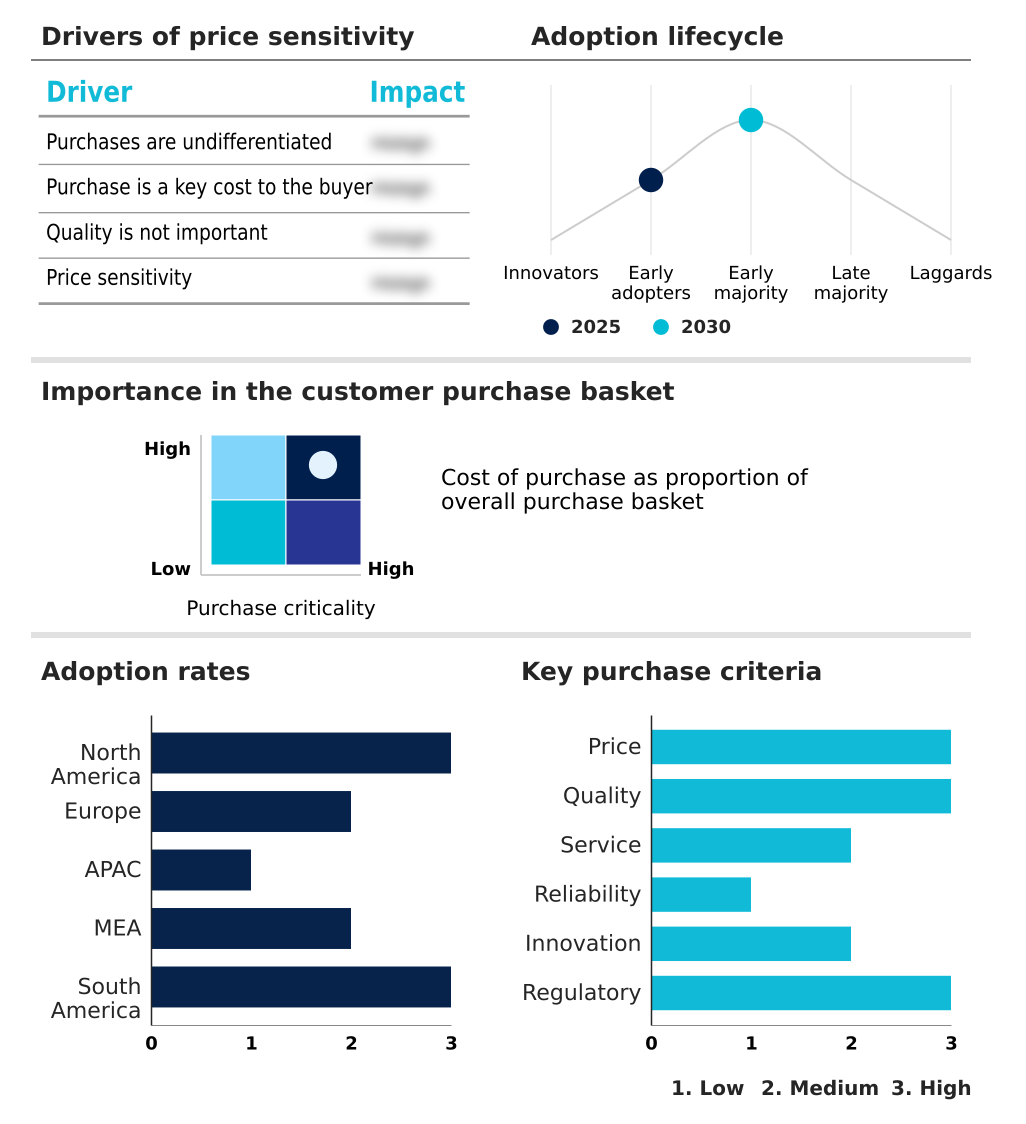
Customer Landscape of Digital Transformation In Retail Sector Industry
Competitive Landscape
Companies are implementing various strategies, such as strategic alliances, digital transformation in retail sector market forecast, partnerships, mergers and acquisitions, geographical expansion, and product/service launches, to enhance their presence in the industry.
Adobe Inc. - Key offerings include scalable e-commerce platforms and integrated ERP solutions with AI-driven analytics, enabling unified commerce operations and optimized supply chain management for retail clients.
The industry research and growth report includes detailed analyses of the competitive landscape of the market and information about key companies, including:
- Adobe Inc.
- Adyen NV
- Aptos LLC
- Blue Yonder Group Inc.
- Diebold Nixdorf Incorp.
- Fujitsu Ltd.
- Johnson Controls International
- Lightspeed Commerce Inc.
- Manhattan Associates Inc.
- NCR Payment Solutions LLC
- Oracle Corp.
- Salesforce Inc.
- SAP SE
- Shopify Inc.
- Symphony Innovation LLC
- Toshiba Global Commerce Solution
- Trax Technology Solutions Pte.
- VusionGroup
- Zebra Technologies Corp.
Qualitative and quantitative analysis of companies has been conducted to help clients understand the wider business environment as well as the strengths and weaknesses of key industry players. Data is qualitatively analyzed to categorize companies as pure play, category-focused, industry-focused, and diversified; it is quantitatively analyzed to categorize companies as dominant, leading, strong, tentative, and weak.
Market Intelligence Radar: High-Impact Developments & Growth Signals
- In the IT Consulting and Other Services industry, increasing enterprise investments in upgrading legacy IT infrastructure are driving demand for cloud migration and systems integration, which is critical for retailers implementing a phygital retail strategy and unifying their customer data platform.
- The widespread adoption of advanced technologies, especially AI and big data analytics, necessitates specialized consulting to deploy complex systems like a hyper-personalization engine or predictive inventory management tools, directly impacting the digital transformation in retail sector market.
- A shift toward Agile and DevOps methodologies is enabling faster development and deployment of retail applications, allowing for quicker implementation of features like click-and-collect services and improving the overall mobile commerce optimization.
- Heightened cybersecurity concerns and evolving data governance policies, such as GDPR, are fueling demand for security consulting services to protect sensitive consumer information and ensure data privacy compliance for retailers managing large-scale digital operations.
Dive into Technavio’s robust research methodology, blending expert interviews, extensive data synthesis, and validated models for unparalleled Digital Transformation In Retail Sector Market insights. See full methodology.
| Market Scope | |
|---|---|
| Page number | 318 |
| Base year | 2025 |
| Historic period | 2020-2024 |
| Forecast period | 2026-2030 |
| Growth momentum & CAGR | Accelerate at a CAGR of 18.6% |
| Market growth 2026-2030 | USD 384.9 billion |
| Market structure | Fragmented |
| YoY growth 2025-2026(%) | 17.3% |
| Key countries | US, Canada, Mexico, Germany, UK, France, Spain, Italy, The Netherlands, China, India, Japan, South Korea, Australia, Indonesia, UAE, Saudi Arabia, South Africa, Israel, Turkey, Brazil, Argentina and Colombia |
| Competitive landscape | Leading Companies, Market Positioning of Companies, Competitive Strategies, and Industry Risks |
Research Analyst Overview
- The digital transformation in retail sector market ecosystem is a complex interplay of technology providers, solution integrators, and end-users. Technology giants supply the core cloud computing infrastructure and AI algorithms, which account for over 40% of the foundational technology spend.
- Solution providers then build specialized platforms for inventory management, point-of-sale systems, and customer relationship management, integrating these tools into cohesive retail operating systems. Retailers, as the end-users, adopt these digital solutions to enhance operational efficiency, with IoT sensor networks improving inventory accuracy by up to 99%.
- The value chain is heavily influenced by data, as big data analytics derived from customer interactions informs everything from supply chain optimization to personalized marketing campaigns, creating a feedback loop that drives continuous innovation and competitive differentiation.
What are the Key Data Covered in this Digital Transformation In Retail Sector Market Research and Growth Report?
-
What is the expected growth of the Digital Transformation In Retail Sector Market between 2026 and 2030?
-
The Digital Transformation In Retail Sector Market is expected to grow by USD 384.9 billion during 2026-2030, registering a CAGR of 18.6%. Year-over-year growth in 2026 is estimated at 17.3%%. This acceleration is shaped by surging consumer expectations for personalized and seamless omnichannel experiences, which is intensifying demand across multiple end-use verticals covered in the report.
-
-
What segmentation does the market report cover?
-
The report is segmented by Technology (IoT, Cloud computing, Big data, AI, and AR and VR), Product (Consumer electronics, Media and entertainment, Apparel, Food and beverage, and Others), Application (Omnichannel retailing, Customer personalization and CRM, and Supply chain and inventory management) and Geography (North America, Europe, APAC, Middle East and Africa, South America). Among these, the IoT segment is estimated to witness significant growth during the forecast period, driven by rising adoption across key application areas. Each segment includes detailed qualitative and quantitative analysis, along with historical data from 2020-2024 and forecasts through 2030 with year-over-year growth rates.
-
-
Which regions are analyzed in the report?
-
The report covers North America, Europe, APAC, Middle East and Africa and South America. North America is estimated to contribute 34% to market growth during the forecast period. Country-level analysis includes US, Canada, Mexico, Germany, UK, France, Spain, Italy, The Netherlands, China, India, Japan, South Korea, Australia, Indonesia, UAE, Saudi Arabia, South Africa, Israel, Turkey, Brazil, Argentina and Colombia, with dedicated market size tables and year-over-year growth for each.
-
-
What are the key growth drivers and market challenges?
-
The primary driver is surging consumer expectations for personalized and seamless omnichannel experiences, which is accelerating investment and industry demand. The main challenge is heightened data privacy and security risks, creating operational barriers for key market participants. The report quantifies the impact of each driver and challenge across 2026 and 2030 with comparative analysis.
-
-
Who are the major players in the Digital Transformation In Retail Sector Market?
-
Key vendors include Adobe Inc., Adyen NV, Aptos LLC, Blue Yonder Group Inc., Diebold Nixdorf Incorp., Fujitsu Ltd., Johnson Controls International, Lightspeed Commerce Inc., Manhattan Associates Inc., NCR Payment Solutions LLC, Oracle Corp., Salesforce Inc., SAP SE, Shopify Inc., Symphony Innovation LLC, Toshiba Global Commerce Solution, Trax Technology Solutions Pte., VusionGroup and Zebra Technologies Corp.. The report provides qualitative and quantitative analysis categorizing companies as dominant, leading, strong, tentative, and weak based on their market positioning. Company profiles include business segment analysis, SWOT assessment, key offerings, and recent strategic developments.
-
Market Research Insights
- The competitive landscape for digital transformation in retail is defined by intense innovation, with large vendors growing their market share by 17.3% annually through strategic maneuvers. Key players such as Salesforce Inc. and Adobe Inc. are expanding their AI-driven analytics platforms, while e-commerce specialists like Shopify Inc. introduce tools that democratize advanced technology for smaller merchants.
- A pivotal industry action includes acquisitions that bolster merchandising and cloud analytics capabilities, aiming to improve retail client transformation outcomes by over 15%. This focus on integrated solutions addresses the critical need for a unified view of the customer across all touchpoints.
- However, vendors must navigate the persistent challenge of ensuring their sophisticated platforms can seamlessly integrate with the diverse and often outdated legacy systems common in the retail sector.
We can help! Our analysts can customize this digital transformation in retail sector market research report to meet your requirements.
 RIA -
RIA - 
