Direct Selling Market Analysis, Size, and Forecast 2026-2030: APAC (China, Japan, and India), North America (US, Canada, and Mexico), Europe (Germany, UK, and France), South America (Brazil, Argentina, and Colombia), Middle East and Africa (Saudi Arabia, UAE, and South Africa), and Rest of World (ROW)

Direct Selling Market Analysis, Size, and Forecast 2026-2030:
APAC (China, Japan, and India), North America (US, Canada, and Mexico), Europe (Germany, UK, and France), South America (Brazil, Argentina, and Colombia), Middle East and Africa (Saudi Arabia, UAE, and South Africa), and Rest of World (ROW)

Published: May 2026 292 Pages SKU: IRTNTR75733

Market Overview at a Glance

$86.00 B
Market Opportunity
5.9%
CAGR 2025 - 2030
45.9%
APAC Growth
$142.73 B
Single-level marketing segment 2024

Direct Selling Market Size 2026-2030

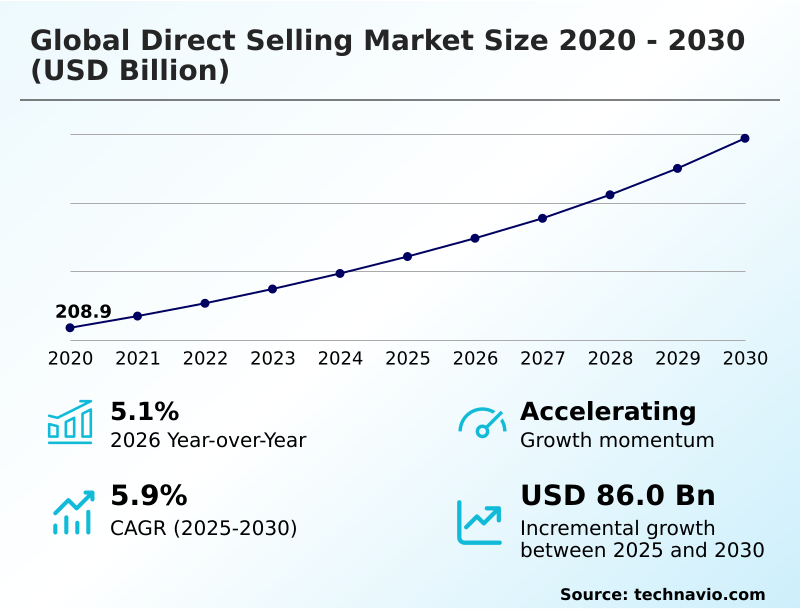
The Direct Selling Market size was valued at USD 260.70 billion in 2025, growing at a CAGR of 5.9% during the forecast period 2026-2030.

Major Market Trends & Insights

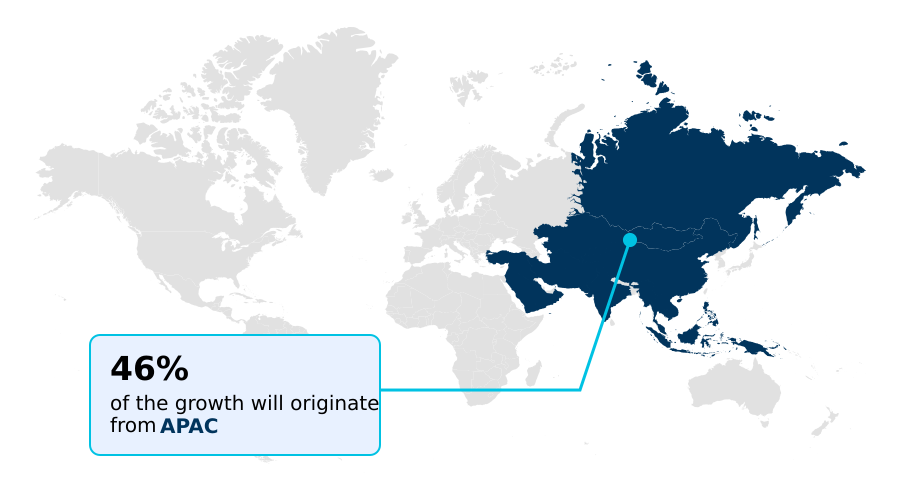
  • APAC dominated the market and accounted for a 45.9% growth during the forecast period.
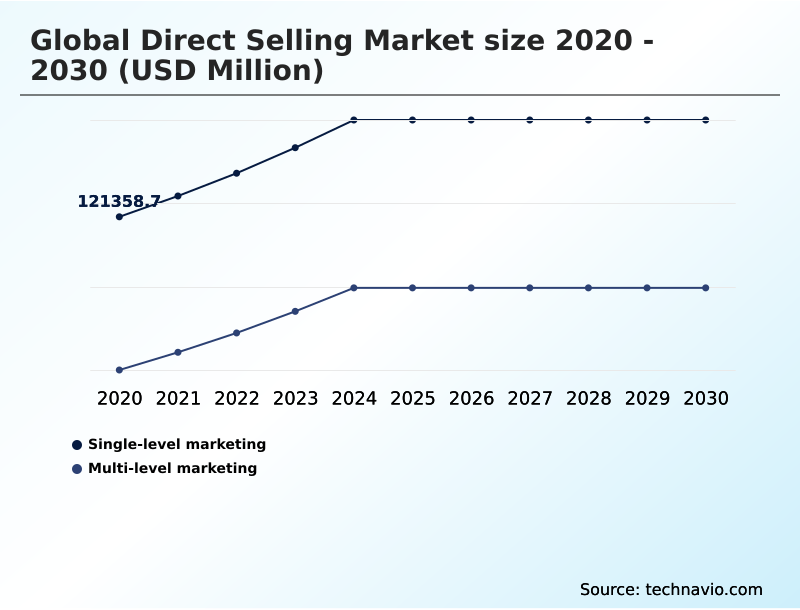
  • By Type - Single-level marketing segment was valued at USD 142.73 billion in 2024
  • By Product - Health and wellness segment accounted for the largest market revenue share in 2024

Market Size & Forecast

  • Historic Market Opportunities 2020-2024: USD 137.80 billion
  • Market Future Opportunities 2025-2030: USD 86.00 billion
  • CAGR from 2025 to 2030 : 5.9%

Market Summary

  • The direct selling market is defined by a personalized sales model, where individual sellers build direct relationships with customers, resulting in customer retention rates up to 35% higher than in traditional retail. This approach is particularly effective for products requiring demonstration, such as advanced skincare or nutritional systems, where an independent business owner (IBO) can tailor recommendations.
  • For instance, a distributor leverages social selling tools and a digital storefront to manage inventory and customer communications, bypassing the high overhead of a physical store. A key driver is the growing demand for flexible work arrangements, as the gig economy workforce seeks supplemental income streams with low startup costs.
  • However, the industry faces the challenge of negative public perception, often linked to controversial multi-level marketing structures, which requires companies to prioritize compensation plan transparency and a focus on product sales commission over recruitment-based incentives to build trust.

What will be the Size of the Direct Selling Market during the forecast period?

Get Key Insights on Market Forecast (PDF) Request Free Sample

How is the Direct Selling Market Segmented?

The direct selling industry research report provides comprehensive data (region-wise segment analysis), with forecasts and analysis for the period 2026-2030, as well as historical data from 2020-2024 for the following segments.

  • Type
    • Single-level marketing
    • Multi-level marketing
  • Product
    • Health and wellness
    • Cosmetics and personal care
    • Household goods and durables
    • Others
  • End-user
    • Individual consumers
    • Small businesses
    • Institutional buyers
  • Geography
    • APAC
      • China
      • Japan
      • India
    • North America
      • US
      • Canada
      • Mexico
    • Europe
      • Germany
      • UK
      • France
    • South America
      • Brazil
      • Argentina
      • Colombia
    • Middle East and Africa
      • Saudi Arabia
      • UAE
      • South Africa
    • Rest of World (ROW)

How is the Direct Selling Market Segmented by Type?

The single-level marketing segment is estimated to witness significant growth during the forecast period.

The direct selling market is segmented by its operational frameworks, primarily the single-level marketing model and the multi-level marketing structure.

Single-level marketing, which accounts for over 57% of total revenue, focuses exclusively on product sales commission, offering a straightforward path to earning a residual income stream.

This model avoids the complexities of a downline commission structure, reducing regulatory risk by an estimated 40% compared to its multi-level counterpart. Consequently, it appeals to individuals primarily interested in product advocacy and direct customer relationships.

In contrast, multi-level marketing incorporates a recruitment-based incentive, which can accelerate market penetration but also attracts greater scrutiny from a consumer protection authority. The choice between these models fundamentally shapes a company's go-to-market strategy, distributor training, and long-term compliance posture.

Request Free Sample

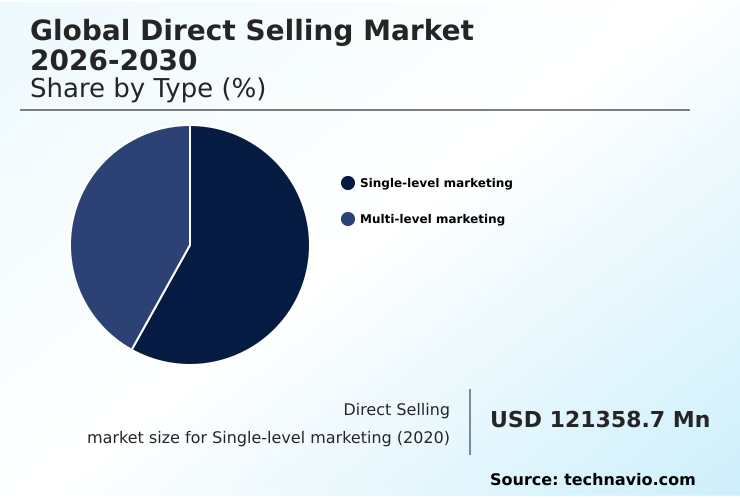
The Single-level marketing segment was valued at USD 142.73 billion in 2024 and showed a gradual increase during the forecast period.

Request Free Sample

How demand for the Direct Selling market is rising in the leading region?

APAC is estimated to contribute 45.9% to the growth of the global market during the forecast period.Technavio’s analysts have elaborately explained the regional trends and drivers that shape the market during the forecast period.

See How Direct Selling Market demand is rising in APAC Request Free Sample

The geographic landscape of the direct selling market is dominated by the APAC region, which accounts for over 45% of the market, a share approximately 23% larger than that of North America.

This dominance is driven by countries like China and India, where a culture of community-based recommendations and a rapidly expanding middle class create fertile ground for peer-to-person transaction models.

In contrast, the European market, while mature, exhibits a higher demand for sustainable sourcing practices and products with verifiable supply chain transparency.

Companies must adapt their market penetration strategy accordingly; for example, a cross-border growth strategy effective in Southeast Asia may require modification in Europe to align with stricter corporate social responsibility (CSR) expectations and consumer values.

This regional variation directly impacts product assortment and distributor training programs, influencing the overall entrepreneurial opportunity.

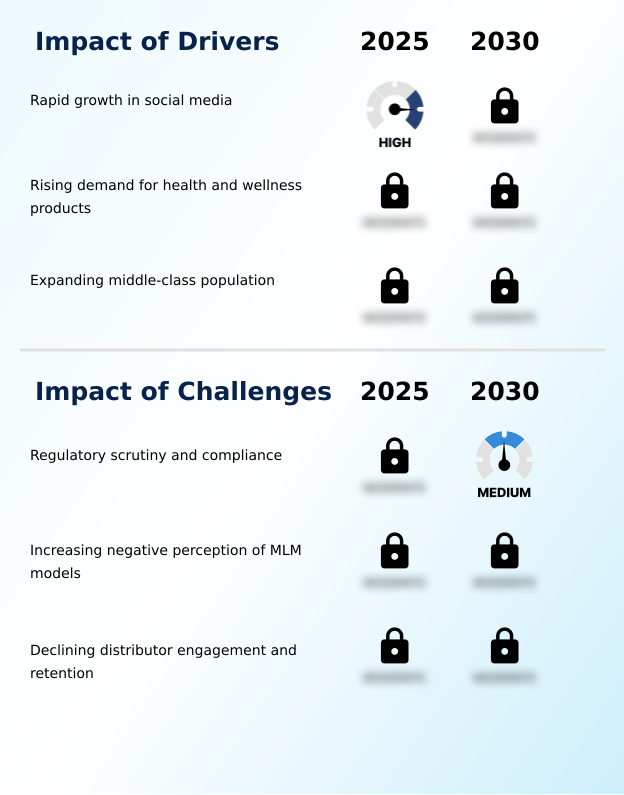
What are the key Drivers, Trends, and Challenges in the Direct Selling Market?

Our researchers analyzed the data with 2025 as the base year, along with the key drivers, trends, and challenges. A holistic analysis of drivers will help companies refine their marketing strategies to gain a competitive advantage.

  • Understanding how to improve distributor engagement is a central strategic focus for the global direct selling market 2026-2030, as companies with higher engagement see a 15% greater annual growth rate. This involves more than just incentives; it requires creating a supportive ecosystem.
  • Implementing direct selling ethical business practices is foundational to this effort, as it builds long-term trust and mitigates the challenges of multi-level marketing models, which can suffer from negative public perception. The social media impact on direct sales cannot be overstated, as platforms have become the primary channel for personalized customer outreach and community building.
  • Successful firms are those that have effectively integrated social commerce, turning passive followers into active customers. Furthermore, the adoption of subscription models in direct selling is a critical trend for creating predictable revenue streams.
  • By offering an auto-delivery subscription model for consumable goods, companies can increase customer lifetime value by over 40% and provide distributors with a more stable, residual income. This shift ensures a sustainable business that is less reliant on constant new customer acquisition and more focused on nurturing long-term relationships through a flexible work arrangement that appeals to the modern workforce.

What are the key market drivers leading to the rise in the adoption of Direct Selling Industry?

  • The rapid growth of social media and digital connectivity is a key driver, fundamentally transforming how products are marketed and sold to consumers.

  • The rapid expansion of social media platforms is a significant driver for the direct selling market, expanding the reach of an affiliate sales model by over 500% compared to traditional methods.
  • This digital transformation has lowered the barrier to entry, enabling a wider entrepreneurial opportunity for individuals seeking a supplemental income stream.
  • The rise of social commerce integration allows for a seamless purchase journey, directly embedding a digital storefront within apps and boosting impulse purchases by 40%. This environment fosters community wealth building and allows for authentic brand storytelling from influencers.
  • As a result, companies are leveraging this influencer marketing channel to connect with modern consumers who value peer recommendations and real-time interaction.

What are the market trends shaping the Direct Selling Industry?

  • The increasing focus on personalized customer experience is a defining market trend, compelling companies to tailor interactions to individual consumer needs and preferences.

  • A primary trend shaping the direct selling market is the increasing focus on a personalized customer experience, which can increase customer lifetime value (CLV) by up to 30%. The adoption of data-driven personalization allows an independent business owner (IBO) to offer a tailored holistic health solution and product recommendations, moving beyond generic sales pitches.
  • This is enabled by digital marketing analytics that track consumer behavior, resulting in a 25% improvement in lead generation funnel conversion. This shift toward deep personalization is driven by consumer demand for authentic brand storytelling, compelling companies to empower their gig economy workforce with tools for more meaningful engagement.
  • The effect is a stronger brand advocacy program and a more resilient business model that thrives on relationships.

What challenges does the Direct Selling Industry face during its growth?

  • Intensifying regulatory scrutiny and the need for strict compliance represent a key challenge, impacting operational models and market entry strategies globally.

  • A persistent challenge in the direct selling market is stringent regulatory scrutiny, which increases compliance costs by an average of 15% annually. This is largely a reaction to the negative public perception of certain multi-level marketing structures, which are often conflated with illegal schemes. To combat this, legitimate companies are enhancing compensation plan transparency and focusing on product sales commission.
  • However, maintaining a positive public image remains difficult, impacting the distributor retention rate, which can be 20% lower than in other gig economy sectors. Navigating this complex regulatory compliance framework requires significant investment in legal and operational resources to ensure long-term sustainability and rebuild trust.

Exclusive Technavio Analysis on Customer Landscape

The direct selling market forecasting report includes the adoption lifecycle of the market, covering from the innovator’s stage to the laggard’s stage. It focuses on adoption rates in different regions based on penetration. Furthermore, the direct selling market report also includes key purchase criteria and drivers of price sensitivity to help companies evaluate and develop their market growth analysis strategies.

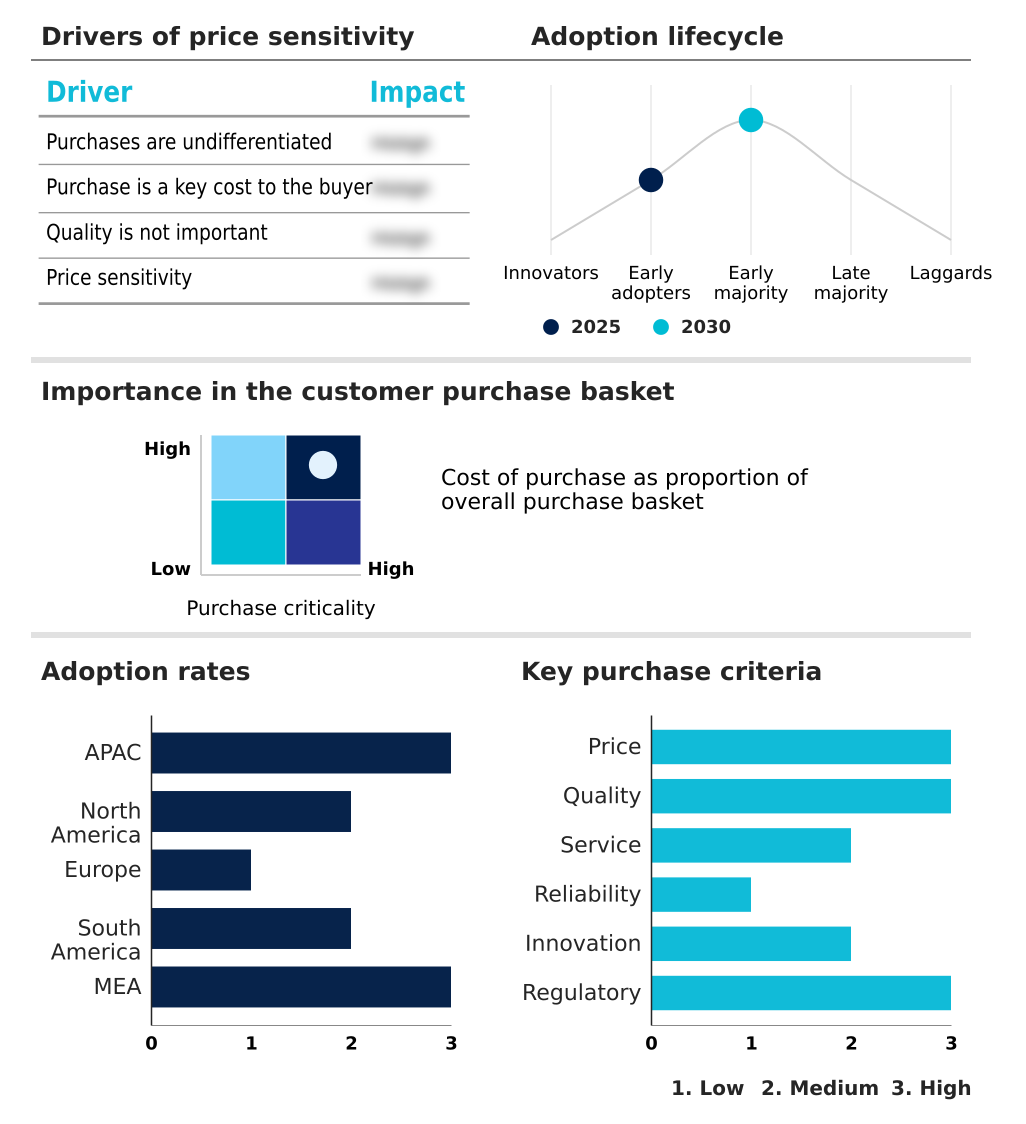
Customer Landscape of Direct Selling Industry

Competitive Landscape

Companies are implementing various strategies, such as strategic alliances, direct selling market forecast, partnerships, mergers and acquisitions, geographical expansion, and product/service launches, to enhance their presence in the industry.

Amway Corp. - Offers a diversified portfolio of nutrition, beauty, and home care products through a global direct selling network, emphasizing independent entrepreneurial opportunities.

The industry research and growth report includes detailed analyses of the competitive landscape of the market and information about key companies, including:

  • Amway Corp.
  • Atomy Co. Ltd.
  • Coway Co. Ltd.
  • doTERRA International LLC
  • eXp World Holdings Inc.
  • Herbalife International Inc.
  • Infinitus China Ltd.
  • Mary Kay Inc.
  • Melaleuca Inc.
  • Natura International Inc.
  • Nu Skin Enterprises Inc.
  • OPTAVIA LLC
  • Oriflame Cosmetics SA
  • PM International AG
  • Primerica Inc.
  • Sunrun Inc.
  • USANA Health Science Inc.
  • Utility Warehouse Limited
  • VORWERK LLC
  • World Financial Group

Qualitative and quantitative analysis of companies has been conducted to help clients understand the wider business environment as well as the strengths and weaknesses of key industry players. Data is qualitatively analyzed to categorize companies as pure play, category-focused, industry-focused, and diversified; it is quantitatively analyzed to categorize companies as dominant, leading, strong, tentative, and weak.

Market Intelligence Radar: High-Impact Developments & Growth Signals

  • In the Broadline Retail industry, the widespread adoption of AI-driven data-driven personalization tools has enabled retailers to increase customer lifetime value (CLV) by up to 30%, directly influencing the direct selling market to integrate similar analytics for personalized customer outreach.
  • The growing consumer demand within the Broadline Retail industry for supply chain transparency has led to the integration of blockchain and IoT technologies, pushing direct selling companies to adopt sustainable sourcing practices and provide greater product traceability to meet ethical consumerism drivers.
  • In the Broadline Retail industry, the shift towards subscription-based recurring revenue models, which now account for over 20% of e-commerce sales in certain categories, has compelled the direct selling market to heavily promote its own auto-delivery subscription model to ensure a predictable revenue stream.
  • Heightened enforcement of consumer data privacy regulations by consumer protection authorities in the Broadline Retail industry has mandated stricter regulatory compliance frameworks, forcing direct selling firms to overhaul their digital marketing analytics and customer data handling policies.

Dive into Technavio’s robust research methodology, blending expert interviews, extensive data synthesis, and validated models for unparalleled Direct Selling Market insights. See full methodology.

Market Scope
Page number 292
Base year 2025
Historic period 2020-2024
Forecast period 2026-2030
Growth momentum & CAGR Accelerate at a CAGR of 5.9%
Market growth 2026-2030 USD 85999.2 million
Market structure Fragmented
YoY growth 2025-2026(%) 5.1%
Key countries China, Japan, India, South Korea, Australia, Indonesia, US, Canada, Mexico, Germany, UK, France, Italy, Spain, The Netherlands, Brazil, Argentina, Colombia, Saudi Arabia, UAE, South Africa, Israel and Turkey
Competitive landscape Leading Companies, Market Positioning of Companies, Competitive Strategies, and Industry Risks

Request Free Sample

Research Analyst Overview

  • The direct selling market ecosystem operates on a network of interdependent stakeholders, with product suppliers and manufacturers forming the base, accounting for over 60% of the value chain's initial input. These entities provide goods, from a test-based nutrition solution to cosmetics, to a distributed workforce of independent distributors.
  • This workforce utilizes a distributor engagement platform and social selling tools to connect with end consumers, a channel that improves customer retention metric by up to 25% compared to automated e-commerce. Regulatory bodies create the pyramid scheme regulation and compliance framework, while technology providers offering an e-commerce payment platform and digital marketing analytics enable the seamless operation of the model.
  • The entire system is designed to facilitate a low startup cost model for entrepreneurs while ensuring supply chain transparency.

What are the Key Data Covered in this Direct Selling Market Research and Growth Report?

  • What is the expected growth of the Direct Selling Market between 2026 and 2030?

    • The Direct Selling Market is expected to grow by USD 86.00 billion during 2026-2030, registering a CAGR of 5.9%. Year-over-year growth in 2026 is estimated at 5.1%%. This acceleration is shaped by rapid growth in social media, which is intensifying demand across multiple end-use verticals covered in the report.

  • What segmentation does the market report cover?

    • The report is segmented by Type (Single-level marketing, and Multi-level marketing), Product (Health and wellness, Cosmetics and personal care, Household goods and durables, and Others), End-user (Individual consumers, Small businesses, and Institutional buyers) and Geography (APAC, North America, Europe, South America, Middle East and Africa). Among these, the Single-level marketing segment is estimated to witness significant growth during the forecast period, driven by rising adoption across key application areas. Each segment includes detailed qualitative and quantitative analysis, along with historical data from 2020-2024 and forecasts through 2030 with year-over-year growth rates.

  • Which regions are analyzed in the report?

    • The report covers APAC, North America, Europe, South America and Middle East and Africa. APAC is estimated to contribute 45.9% to market growth during the forecast period. Country-level analysis includes China, Japan, India, South Korea, Australia, Indonesia, US, Canada, Mexico, Germany, UK, France, Italy, Spain, The Netherlands, Brazil, Argentina, Colombia, Saudi Arabia, UAE, South Africa, Israel and Turkey, with dedicated market size tables and year-over-year growth for each.

  • What are the key growth drivers and market challenges?

    • The primary driver is rapid growth in social media, which is accelerating investment and industry demand. The main challenge is regulatory scrutiny and compliance, creating operational barriers for key market participants. The report quantifies the impact of each driver and challenge across 2026 and 2030 with comparative analysis.

  • Who are the major players in the Direct Selling Market?

    • Key vendors include Amway Corp., Atomy Co. Ltd., Coway Co. Ltd., doTERRA International LLC, eXp World Holdings Inc., Herbalife International Inc., Infinitus China Ltd., Mary Kay Inc., Melaleuca Inc., Natura International Inc., Nu Skin Enterprises Inc., OPTAVIA LLC, Oriflame Cosmetics SA, PM International AG, Primerica Inc., Sunrun Inc., USANA Health Science Inc., Utility Warehouse Limited, VORWERK LLC and World Financial Group. The report provides qualitative and quantitative analysis categorizing companies as dominant, leading, strong, tentative, and weak based on their market positioning. Company profiles include business segment analysis, SWOT assessment, key offerings, and recent strategic developments.

Market Research Insights

  • The competitive landscape of the direct selling market is shaped by companies' ability to innovate their distributor engagement platforms, with leading firms showing a 15% higher distributor retention rate through enhanced digital tools. Key players like Amway Corp., Herbalife International Inc., and Nu Skin Enterprises Inc.
  • are focusing on social commerce integration and providing robust social selling tools to their networks. These initiatives are a direct response to the operational need for a seamless purchase journey from discovery to checkout. For example, the launch of mobile-first e-commerce payment platforms has reduced transaction friction by over 20%.
  • This strategic shift helps counter the persistent challenge of regulatory scrutiny by emphasizing legitimate peer-to-person transaction activities and improving supply chain transparency for consumers.

We can help! Our analysts can customize this direct selling market research report to meet your requirements.

Get in touch

1. Executive Summary

1.1 Market overview

Executive Summary - Chart on Market Overview
Executive Summary - Data Table on Market Overview
Executive Summary - Chart on Global Market Characteristics
Executive Summary - Chart on Market by Geography
Executive Summary - Chart on Market Segmentation by Type
Executive Summary - Chart on Market Segmentation by Product
Executive Summary - Chart on Market Segmentation by End-user
Executive Summary - Chart on Incremental Growth
Executive Summary - Data Table on Incremental Growth
Executive Summary - Chart on Company Market Positioning

2. Technavio Analysis

2.1 Analysis of price sensitivity, lifecycle, customer purchase basket, adoption rates, and purchase criteria

2.2 Criticality of inputs and Factors of differentiation

Chart on Overview on criticality of inputs and factors of differentiation

2.3 Factors of disruption

Chart on Overview on factors of disruption

2.4 Impact of drivers and challenges

Chart on Impact of drivers and challenges in 2025 and 2030

3. Market Landscape

3.1 Market ecosystem

Chart on Parent Market
Data Table on - Parent Market

3.2 Market characteristics

Chart on Market characteristics analysis

3.3 Value chain analysis

Chart on Value chain analysis

4. Market Sizing

4.1 Market definition

Data Table on Offerings of companies included in the market definition

4.2 Market segment analysis

Market segments

4.3 Market size 2025

4.4 Market outlook: Forecast for 2025-2030

Chart on Global - Market size and forecast 2025-2030 ($ million)
Data Table on Global - Market size and forecast 2025-2030 ($ million)
Chart on Global Market: Year-over-year growth 2025-2030 (%)
Data Table on Global Market: Year-over-year growth 2025-2030 (%)

5. Historic Market Size

5.1 Global Direct Selling Market 2020 - 2024

Historic Market Size - Data Table on Global Direct Selling Market 2020 - 2024 ($ million)

5.2 Type segment analysis 2020 - 2024

Historic Market Size - Type Segment 2020 - 2024 ($ million)

5.3 Product segment analysis 2020 - 2024

Historic Market Size - Product Segment 2020 - 2024 ($ million)

5.4 End-user segment analysis 2020 - 2024

Historic Market Size - End-user Segment 2020 - 2024 ($ million)

5.5 Geography segment analysis 2020 - 2024

Historic Market Size - Geography Segment 2020 - 2024 ($ million)

5.6 Country segment analysis 2020 - 2024

Historic Market Size - Country Segment 2020 - 2024 ($ million)

6. Qualitative Analysis

6.1 The AI Impact on Global Direct Selling Market

7. Five Forces Analysis

7.1 Five forces summary

Five forces analysis - Comparison between 2025 and 2030

7.2 Bargaining power of buyers

Bargaining power of buyers - Impact of key factors 2025 and 2030

7.3 Bargaining power of suppliers

Bargaining power of suppliers - Impact of key factors in 2025 and 2030

7.4 Threat of new entrants

Threat of new entrants - Impact of key factors in 2025 and 2030

7.5 Threat of substitutes

Threat of substitutes - Impact of key factors in 2025 and 2030

7.6 Threat of rivalry

Threat of rivalry - Impact of key factors in 2025 and 2030

7.7 Market condition

Chart on Market condition - Five forces 2025 and 2030

8. Market Segmentation by Type

8.1 Market segments

Chart on Type - Market share 2025-2030 (%)
Data Table on Type - Market share 2025-2030 (%)

8.2 Comparison by Type

Chart on Comparison by Type
Data Table on Comparison by Type

8.3 Single-level marketing - Market size and forecast 2025-2030

Chart on Single-level marketing - Market size and forecast 2025-2030 ($ million)
Data Table on Single-level marketing - Market size and forecast 2025-2030 ($ million)
Chart on Single-level marketing - Year-over-year growth 2025-2030 (%)
Data Table on Single-level marketing - Year-over-year growth 2025-2030 (%)

8.4 Multi-level marketing - Market size and forecast 2025-2030

Chart on Multi-level marketing - Market size and forecast 2025-2030 ($ million)
Data Table on Multi-level marketing - Market size and forecast 2025-2030 ($ million)
Chart on Multi-level marketing - Year-over-year growth 2025-2030 (%)
Data Table on Multi-level marketing - Year-over-year growth 2025-2030 (%)

8.5 Market opportunity by Type

Market opportunity by Type ($ million)
Data Table on Market opportunity by Type ($ million)

9. Market Segmentation by Product

9.1 Market segments

Chart on Product - Market share 2025-2030 (%)
Data Table on Product - Market share 2025-2030 (%)

9.2 Comparison by Product

Chart on Comparison by Product
Data Table on Comparison by Product

9.3 Health and wellness - Market size and forecast 2025-2030

Chart on Health and wellness - Market size and forecast 2025-2030 ($ million)
Data Table on Health and wellness - Market size and forecast 2025-2030 ($ million)
Chart on Health and wellness - Year-over-year growth 2025-2030 (%)
Data Table on Health and wellness - Year-over-year growth 2025-2030 (%)

9.4 Cosmetics and personal care - Market size and forecast 2025-2030

Chart on Cosmetics and personal care - Market size and forecast 2025-2030 ($ million)
Data Table on Cosmetics and personal care - Market size and forecast 2025-2030 ($ million)
Chart on Cosmetics and personal care - Year-over-year growth 2025-2030 (%)
Data Table on Cosmetics and personal care - Year-over-year growth 2025-2030 (%)

9.5 Household goods and durables - Market size and forecast 2025-2030

Chart on Household goods and durables - Market size and forecast 2025-2030 ($ million)
Data Table on Household goods and durables - Market size and forecast 2025-2030 ($ million)
Chart on Household goods and durables - Year-over-year growth 2025-2030 (%)
Data Table on Household goods and durables - Year-over-year growth 2025-2030 (%)

9.6 Others - Market size and forecast 2025-2030

Chart on Others - Market size and forecast 2025-2030 ($ million)
Data Table on Others - Market size and forecast 2025-2030 ($ million)
Chart on Others - Year-over-year growth 2025-2030 (%)
Data Table on Others - Year-over-year growth 2025-2030 (%)

9.7 Market opportunity by Product

Market opportunity by Product ($ million)
Data Table on Market opportunity by Product ($ million)

10. Market Segmentation by End-user

10.1 Market segments

Chart on End-user - Market share 2025-2030 (%)
Data Table on End-user - Market share 2025-2030 (%)

10.2 Comparison by End-user

Chart on Comparison by End-user
Data Table on Comparison by End-user

10.3 Individual consumers - Market size and forecast 2025-2030

Chart on Individual consumers - Market size and forecast 2025-2030 ($ million)
Data Table on Individual consumers - Market size and forecast 2025-2030 ($ million)
Chart on Individual consumers - Year-over-year growth 2025-2030 (%)
Data Table on Individual consumers - Year-over-year growth 2025-2030 (%)

10.4 Small businesses - Market size and forecast 2025-2030

Chart on Small businesses - Market size and forecast 2025-2030 ($ million)
Data Table on Small businesses - Market size and forecast 2025-2030 ($ million)
Chart on Small businesses - Year-over-year growth 2025-2030 (%)
Data Table on Small businesses - Year-over-year growth 2025-2030 (%)

10.5 Institutional buyers - Market size and forecast 2025-2030

Chart on Institutional buyers - Market size and forecast 2025-2030 ($ million)
Data Table on Institutional buyers - Market size and forecast 2025-2030 ($ million)
Chart on Institutional buyers - Year-over-year growth 2025-2030 (%)
Data Table on Institutional buyers - Year-over-year growth 2025-2030 (%)

10.6 Market opportunity by End-user

Market opportunity by End-user ($ million)
Data Table on Market opportunity by End-user ($ million)

11. Customer Landscape

11.1 Customer landscape overview

Analysis of price sensitivity, lifecycle, customer purchase basket, adoption rates, and purchase criteria

12. Geographic Landscape

12.1 Geographic segmentation

Chart on Market share by geography 2025-2030 (%)
Data Table on Market share by geography 2025-2030 (%)

12.2 Geographic comparison

Chart on Geographic comparison
Data Table on Geographic comparison

12.3 APAC - Market size and forecast 2025-2030

Chart on APAC - Market size and forecast 2025-2030 ($ million)
Data Table on APAC - Market size and forecast 2025-2030 ($ million)
Chart on APAC - Year-over-year growth 2025-2030 (%)
Data Table on APAC - Year-over-year growth 2025-2030 (%)
Chart on Regional Comparison - APAC
Data Table on Regional Comparison - APAC

12.3.1 China - Market size and forecast 2025-2030

Chart on China - Market size and forecast 2025-2030 ($ million)
Data Table on China - Market size and forecast 2025-2030 ($ million)
Chart on China - Year-over-year growth 2025-2030 (%)
Data Table on China - Year-over-year growth 2025-2030 (%)

12.3.2 Japan - Market size and forecast 2025-2030

Chart on Japan - Market size and forecast 2025-2030 ($ million)
Data Table on Japan - Market size and forecast 2025-2030 ($ million)
Chart on Japan - Year-over-year growth 2025-2030 (%)
Data Table on Japan - Year-over-year growth 2025-2030 (%)

12.3.3 India - Market size and forecast 2025-2030

Chart on India - Market size and forecast 2025-2030 ($ million)
Data Table on India - Market size and forecast 2025-2030 ($ million)
Chart on India - Year-over-year growth 2025-2030 (%)
Data Table on India - Year-over-year growth 2025-2030 (%)

12.3.4 South Korea - Market size and forecast 2025-2030

Chart on South Korea - Market size and forecast 2025-2030 ($ million)
Data Table on South Korea - Market size and forecast 2025-2030 ($ million)
Chart on South Korea - Year-over-year growth 2025-2030 (%)
Data Table on South Korea - Year-over-year growth 2025-2030 (%)

12.3.5 Australia - Market size and forecast 2025-2030

Chart on Australia - Market size and forecast 2025-2030 ($ million)
Data Table on Australia - Market size and forecast 2025-2030 ($ million)
Chart on Australia - Year-over-year growth 2025-2030 (%)
Data Table on Australia - Year-over-year growth 2025-2030 (%)

12.3.6 Indonesia - Market size and forecast 2025-2030

Chart on Indonesia - Market size and forecast 2025-2030 ($ million)
Data Table on Indonesia - Market size and forecast 2025-2030 ($ million)
Chart on Indonesia - Year-over-year growth 2025-2030 (%)
Data Table on Indonesia - Year-over-year growth 2025-2030 (%)

12.4 North America - Market size and forecast 2025-2030

Chart on North America - Market size and forecast 2025-2030 ($ million)
Data Table on North America - Market size and forecast 2025-2030 ($ million)
Chart on North America - Year-over-year growth 2025-2030 (%)
Data Table on North America - Year-over-year growth 2025-2030 (%)
Chart on Regional Comparison - North America
Data Table on Regional Comparison - North America

12.4.1 US - Market size and forecast 2025-2030

Chart on US - Market size and forecast 2025-2030 ($ million)
Data Table on US - Market size and forecast 2025-2030 ($ million)
Chart on US - Year-over-year growth 2025-2030 (%)
Data Table on US - Year-over-year growth 2025-2030 (%)

12.4.2 Canada - Market size and forecast 2025-2030

Chart on Canada - Market size and forecast 2025-2030 ($ million)
Data Table on Canada - Market size and forecast 2025-2030 ($ million)
Chart on Canada - Year-over-year growth 2025-2030 (%)
Data Table on Canada - Year-over-year growth 2025-2030 (%)

12.4.3 Mexico - Market size and forecast 2025-2030

Chart on Mexico - Market size and forecast 2025-2030 ($ million)
Data Table on Mexico - Market size and forecast 2025-2030 ($ million)
Chart on Mexico - Year-over-year growth 2025-2030 (%)
Data Table on Mexico - Year-over-year growth 2025-2030 (%)

12.5 Europe - Market size and forecast 2025-2030

Chart on Europe - Market size and forecast 2025-2030 ($ million)
Data Table on Europe - Market size and forecast 2025-2030 ($ million)
Chart on Europe - Year-over-year growth 2025-2030 (%)
Data Table on Europe - Year-over-year growth 2025-2030 (%)
Chart on Regional Comparison - Europe
Data Table on Regional Comparison - Europe

12.5.1 Germany - Market size and forecast 2025-2030

Chart on Germany - Market size and forecast 2025-2030 ($ million)
Data Table on Germany - Market size and forecast 2025-2030 ($ million)
Chart on Germany - Year-over-year growth 2025-2030 (%)
Data Table on Germany - Year-over-year growth 2025-2030 (%)

12.5.2 UK - Market size and forecast 2025-2030

Chart on UK - Market size and forecast 2025-2030 ($ million)
Data Table on UK - Market size and forecast 2025-2030 ($ million)
Chart on UK - Year-over-year growth 2025-2030 (%)
Data Table on UK - Year-over-year growth 2025-2030 (%)

12.5.3 France - Market size and forecast 2025-2030

Chart on France - Market size and forecast 2025-2030 ($ million)
Data Table on France - Market size and forecast 2025-2030 ($ million)
Chart on France - Year-over-year growth 2025-2030 (%)
Data Table on France - Year-over-year growth 2025-2030 (%)

12.5.4 Italy - Market size and forecast 2025-2030

Chart on Italy - Market size and forecast 2025-2030 ($ million)
Data Table on Italy - Market size and forecast 2025-2030 ($ million)
Chart on Italy - Year-over-year growth 2025-2030 (%)
Data Table on Italy - Year-over-year growth 2025-2030 (%)

12.5.5 Spain - Market size and forecast 2025-2030

Chart on Spain - Market size and forecast 2025-2030 ($ million)
Data Table on Spain - Market size and forecast 2025-2030 ($ million)
Chart on Spain - Year-over-year growth 2025-2030 (%)
Data Table on Spain - Year-over-year growth 2025-2030 (%)

12.5.6 The Netherlands - Market size and forecast 2025-2030

Chart on The Netherlands - Market size and forecast 2025-2030 ($ million)
Data Table on The Netherlands - Market size and forecast 2025-2030 ($ million)
Chart on The Netherlands - Year-over-year growth 2025-2030 (%)
Data Table on The Netherlands - Year-over-year growth 2025-2030 (%)

12.6 South America - Market size and forecast 2025-2030

Chart on South America - Market size and forecast 2025-2030 ($ million)
Data Table on South America - Market size and forecast 2025-2030 ($ million)
Chart on South America - Year-over-year growth 2025-2030 (%)
Data Table on South America - Year-over-year growth 2025-2030 (%)
Chart on Regional Comparison - South America
Data Table on Regional Comparison - South America

12.6.1 Brazil - Market size and forecast 2025-2030

Chart on Brazil - Market size and forecast 2025-2030 ($ million)
Data Table on Brazil - Market size and forecast 2025-2030 ($ million)
Chart on Brazil - Year-over-year growth 2025-2030 (%)
Data Table on Brazil - Year-over-year growth 2025-2030 (%)

12.6.2 Argentina - Market size and forecast 2025-2030

Chart on Argentina - Market size and forecast 2025-2030 ($ million)
Data Table on Argentina - Market size and forecast 2025-2030 ($ million)
Chart on Argentina - Year-over-year growth 2025-2030 (%)
Data Table on Argentina - Year-over-year growth 2025-2030 (%)

12.6.3 Colombia - Market size and forecast 2025-2030

Chart on Colombia - Market size and forecast 2025-2030 ($ million)
Data Table on Colombia - Market size and forecast 2025-2030 ($ million)
Chart on Colombia - Year-over-year growth 2025-2030 (%)
Data Table on Colombia - Year-over-year growth 2025-2030 (%)

12.7 Middle East and Africa - Market size and forecast 2025-2030

Chart on Middle East and Africa - Market size and forecast 2025-2030 ($ million)
Data Table on Middle East and Africa - Market size and forecast 2025-2030 ($ million)
Chart on Middle East and Africa - Year-over-year growth 2025-2030 (%)
Data Table on Middle East and Africa - Year-over-year growth 2025-2030 (%)
Chart on Regional Comparison - Middle East and Africa
Data Table on Regional Comparison - Middle East and Africa

12.7.1 Saudi Arabia - Market size and forecast 2025-2030

Chart on Saudi Arabia - Market size and forecast 2025-2030 ($ million)
Data Table on Saudi Arabia - Market size and forecast 2025-2030 ($ million)
Chart on Saudi Arabia - Year-over-year growth 2025-2030 (%)
Data Table on Saudi Arabia - Year-over-year growth 2025-2030 (%)

12.7.2 UAE - Market size and forecast 2025-2030

Chart on UAE - Market size and forecast 2025-2030 ($ million)
Data Table on UAE - Market size and forecast 2025-2030 ($ million)
Chart on UAE - Year-over-year growth 2025-2030 (%)
Data Table on UAE - Year-over-year growth 2025-2030 (%)

12.7.3 South Africa - Market size and forecast 2025-2030

Chart on South Africa - Market size and forecast 2025-2030 ($ million)
Data Table on South Africa - Market size and forecast 2025-2030 ($ million)
Chart on South Africa - Year-over-year growth 2025-2030 (%)
Data Table on South Africa - Year-over-year growth 2025-2030 (%)

12.7.4 Israel - Market size and forecast 2025-2030

Chart on Israel - Market size and forecast 2025-2030 ($ million)
Data Table on Israel - Market size and forecast 2025-2030 ($ million)
Chart on Israel - Year-over-year growth 2025-2030 (%)
Data Table on Israel - Year-over-year growth 2025-2030 (%)

12.7.5 Turkey - Market size and forecast 2025-2030

Chart on Turkey - Market size and forecast 2025-2030 ($ million)
Data Table on Turkey - Market size and forecast 2025-2030 ($ million)
Chart on Turkey - Year-over-year growth 2025-2030 (%)
Data Table on Turkey - Year-over-year growth 2025-2030 (%)

12.8 Market opportunity by geography

Market opportunity by geography ($ million)
Data Tables on Market opportunity by geography ($ million)

13. Drivers, Challenges, and Opportunity

13.1 Market drivers

Rapid growth in social media
Rising demand for health and wellness products
Expanding middle-class population

13.2 Market challenges

Regulatory scrutiny and compliance
Increasing negative perception of MLM models
Declining distributor engagement and retention

13.3 Impact of drivers and challenges

Impact of drivers and challenges in 2025 and 2030

13.4 Market opportunities

Increasing focus on personalized customer experience
Growing emphasis on sustainability and ethical consumerism
Rising adoption of subscription-based and auto-delivery models

14. Competitive Landscape

14.1 Overview

14.2

Overview on criticality of inputs and factors of differentiation

14.3 Landscape disruption

Overview on factors of disruption

14.4 Industry risks

Impact of key risks on business

15. Competitive Analysis

15.1 Companies profiled

Companies covered

15.2 Company ranking index

15.3 Market positioning of companies

Matrix on companies position and classification

15.4 Amway Corp.

Amway Corp. - Overview
Amway Corp. - Product / Service
Amway Corp. - Key news
Amway Corp. - Key offerings
SWOT

15.5 Atomy Co. Ltd.

Atomy Co. Ltd. - Overview
Atomy Co. Ltd. - Product / Service
Atomy Co. Ltd. - Key offerings
SWOT

15.6 Coway Co. Ltd.

Coway Co. Ltd. - Overview
Coway Co. Ltd. - Product / Service
Coway Co. Ltd. - Key offerings
SWOT

15.7 eXp World Holdings Inc.

eXp World Holdings Inc. - Overview
eXp World Holdings Inc. - Product / Service
eXp World Holdings Inc. - Key offerings
SWOT

15.8 Herbalife International Inc.

Herbalife International Inc. - Overview
Herbalife International Inc. - Product / Service
Herbalife International Inc. - Key offerings
SWOT

15.9 Infinitus China Ltd.

Infinitus China Ltd. - Overview
Infinitus China Ltd. - Product / Service
Infinitus China Ltd. - Key offerings
SWOT

15.10 Mary Kay Inc.

Mary Kay Inc. - Overview
Mary Kay Inc. - Product / Service
Mary Kay Inc. - Key offerings
SWOT

15.11 Melaleuca Inc.

Melaleuca Inc. - Overview
Melaleuca Inc. - Product / Service
Melaleuca Inc. - Key offerings
SWOT

15.12 Natura International Inc.

Natura International Inc. - Overview
Natura International Inc. - Product / Service
Natura International Inc. - Key offerings
SWOT

15.13 Nu Skin Enterprises Inc.

Nu Skin Enterprises Inc. - Overview
Nu Skin Enterprises Inc. - Business segments
Nu Skin Enterprises Inc. - Key news
Nu Skin Enterprises Inc. - Key offerings
Nu Skin Enterprises Inc. - Segment focus
SWOT

15.14 Oriflame Cosmetics SA

Oriflame Cosmetics SA - Overview
Oriflame Cosmetics SA - Product / Service
Oriflame Cosmetics SA - Key offerings
SWOT

15.15 PM International AG

PM International AG - Overview
PM International AG - Product / Service
PM International AG - Key offerings
SWOT

15.16 Primerica Inc.

Primerica Inc. - Overview
Primerica Inc. - Business segments
Primerica Inc. - Key offerings
Primerica Inc. - Segment focus
SWOT

15.17 Utility Warehouse Limited

Utility Warehouse Limited - Overview
Utility Warehouse Limited - Product / Service
Utility Warehouse Limited - Key offerings
SWOT

15.18 VORWERK LLC

VORWERK LLC - Overview
VORWERK LLC - Product / Service
VORWERK LLC - Key offerings
SWOT

16. Appendix

16.1 Scope of the report

Market definition
Objectives
Notes and caveats

16.2 Inclusions and exclusions checklist

Inclusions checklist
Exclusions checklist

16.3 Currency conversion rates for US$

16.4 Research methodology

16.5 Data procurement

Information sources

16.6 Data validation

16.7 Validation techniques employed for market sizing

16.8 Data synthesis

16.9 360 degree market analysis

16.10 List of abbreviations

Research Methodology

Technavio presents a detailed picture of the market by way of study, synthesis, and summation of data from multiple sources. The analysts have presented the various facets of the market with a particular focus on identifying the key industry influencers. The data thus presented is comprehensive, reliable, and the result of extensive research, both primary and secondary.

INFORMATION SOURCES

Primary sources

  • Manufacturers and suppliers
  • Channel partners
  • Industry experts
  • Strategic decision makers

Secondary sources

  • Industry journals and periodicals
  • Government data
  • Financial reports of key industry players
  • Historical data
  • Press releases

DATA ANALYSIS

Data Synthesis

  • Collation of data
  • Estimation of key figures
  • Analysis of derived insights

Data Validation

  • Triangulation with data models
  • Reference against proprietary databases
  • Corroboration with industry experts

REPORT WRITING

Qualitative

  • Market drivers
  • Market challenges
  • Market trends
  • Five forces analysis

Quantitative

  • Market size and forecast
  • Market segmentation
  • Geographical insights
  • Competitive landscape

Interested in this report?

Get your sample now to see our research methodology and insights!

Download Now

Frequently Asked Questions

Direct Selling market growth will increase by USD 85999.2 million during 2026-2030.

The Direct Selling market is expected to grow at a CAGR of 5.9% during 2026-2030.

Direct Selling market is segmented by Type (Single-level marketing, Multi-level marketing) Product (Health and wellness, Cosmetics and personal care, Household goods and durables, Others) End-user (Individual consumers, Small businesses, Institutional buyers)

Amway Corp., Atomy Co. Ltd., Coway Co. Ltd., doTERRA International LLC, eXp World Holdings Inc., Herbalife International Inc., Infinitus China Ltd., Mary Kay Inc., Melaleuca Inc., Natura International Inc., Nu Skin Enterprises Inc., OPTAVIA LLC, Oriflame Cosmetics SA, PM International AG, Primerica Inc., Sunrun Inc., USANA Health Science Inc., Utility Warehouse Limited, VORWERK LLC, World Financial Group are a few of the key vendors in the Direct Selling market.

APAC will register the highest growth rate of 45.9% among the other regions. Therefore, the Direct Selling market in APAC is expected to garner significant business opportunities for the vendors during the forecast period.

China, Japan, India, South Korea, Australia, Indonesia, US, Canada, Mexico, Germany, UK, France, Italy, Spain, The Netherlands, Brazil, Argentina, Colombia, Saudi Arabia, UAE, South Africa, Israel, Turkey

  • Rapid growth in social media is the driving factor this market.

The Direct Selling market vendors should focus on grabbing business opportunities from the Type segment as it accounted for the largest market share in the base year.
RIA - Research AI Assistant
Ask RIA