Directed Energy Weapons Market Analysis North America, Europe, APAC, South America, Middle East and Africa - US, Canada, China, Japan, Germany - Size and Forecast 2024-2028

Directed Energy Weapons Market Analysis North America, Europe, APAC, South America, Middle East and Africa - US, Canada, China, Japan, Germany - Size and Forecast 2024-2028

Published: Feb 2024 168 Pages SKU: IRTNTR70817

Market Overview at a Glance

$5.31 B
Market Opportunity
19.4%
CAGR
18.85
YoY growth 2023-2024(%)

Directed Energy Weapons Market Size 2024-2028

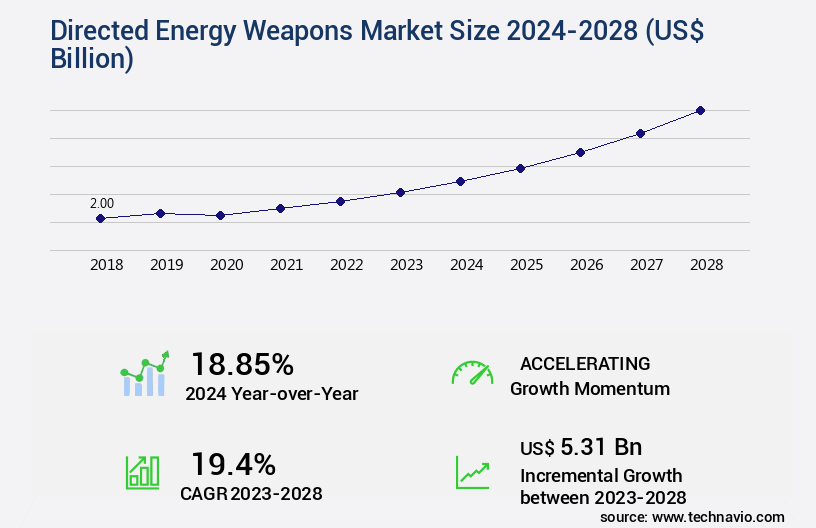
The directed energy weapons market size is valued to increase by USD 5.31 billion, at a CAGR of 19.4% from 2023 to 2028. Development and procurement of advanced technologies in directed energy weapons will drive the directed energy weapons market.

Market Insights

  • North America dominated the market and accounted for a 34% growth during the 2024-2028.
  • By Application - Defense segment was valued at USD 1.93 billion in 2022
  • By Type - Non-lethal segment accounted for the largest market revenue share in 2022

Market Size & Forecast

  • Market Opportunities: USD 351.96 billion 
  • Market Future Opportunities 2023: USD 5.31 billion
  • CAGR from 2023 to 2028 : 19.4%

Market Summary

  • Directed Energy Weapons (DEW), a cutting-edge technology, represents the future of defense and security solutions. This market encompasses various applications, including counter-drone systems, anti-materiel weapons, and crowd control. Driven by technological advancements and geopolitical tensions, the DEW market is experiencing significant growth. The integration of Artificial Intelligence (AI) and Machine Learning (ML) in DEW systems is a major trend. These technologies enable real-time target identification and tracking, enhancing operational efficiency and precision. Furthermore, the development of compact, portable DEW systems is transforming military operations, allowing for quick deployment and flexibility. However, the DEW market faces challenges, primarily related to legality and ethical concerns.
  • As these weapons can cause severe damage without leaving a physical trace, their use raises questions about human rights and international law. For instance, in a supply chain optimization scenario, a logistics company might consider investing in DEWs for securing its facilities. However, it must ensure compliance with international regulations and ethical standards, balancing security needs with ethical considerations. In conclusion, the DEW market is witnessing rapid growth, driven by technological advancements and geopolitical tensions. The integration of AI and ML, as well as the development of compact, portable systems, are key trends. However, legality and ethical concerns pose challenges, necessitating careful consideration and adherence to international regulations.

What will be the size of the Directed Energy Weapons Market during the forecast period?

Directed Energy Weapons Market Size

Get Key Insights on Market Forecast (PDF) Request Free Sample

  • Directed Energy Weapons (DEW) market encompasses advanced technologies designed to generate and focus beams of energy towards specific targets for various applications, including security, defense, and industrial sectors. This market continues to evolve, with trends such as system robustness and survivability gaining prominence. For instance, satellite-based DEW systems are increasingly being integrated into military arsenals for threat neutralization and damage assessment. One significant development in DEW technology is the use of adaptive optics for wavefront correction, ensuring improved target identification and precision. Ground-based DEW systems are also being deployed for training simulations and naval DEW integration, enhancing active protection systems and electronic warfare capabilities.
  • Moreover, power scaling and beam propagation modeling are essential for optimizing DEW performance and expanding their applications, such as non-lethal weapons and material ablation. Jitter compensation and multi-spectral imaging are crucial components of DEW systems, ensuring system reliability and accuracy. Training simulations and maintenance procedures are essential for ensuring operator proficiency and system readiness. Incorporating advanced features like thermal effects, target identification, and wavefront correction, DEWs offer a cost-effective alternative to traditional kinetic energy transfer weapons. By integrating DEWs into strategic planning, companies can improve their compliance, budgeting, and product development, ultimately enhancing their competitive edge.

Unpacking the Directed Energy Weapons Market Landscape

The evolving directed energy sector requires integrated technical and operational approaches to address high-power microwave weapon effects and laser weapon system integration challenges while reconciling particle beam weapon power requirements with practical deployment constraints. Programs emphasize directed energy weapon system reliability testing and electromagnetic pulse weapon effects modeling to quantify vulnerabilities and validate mitigation strategies, and non-lethal energy weapon applications are explored for a wider range of mission profiles. Investments in energy weapon system maintainability improvements and high-energy laser weapon system design considerations aim to reduce lifecycle costs while preserving performance. Concurrent advances in plasma weapon technology advancements and pulsed power technology advancements support higher instantaneous output, but they also increase the need for rigorous radiation effects testing protocols and refined weapon effects simulation software. Engineering priorities include power source efficiency optimization, system power requirements reduction, and beam control mechanism advancements that enhance targeting and reduce collateral effects. Sensor and targeting integration such as thermal imaging system calibration and optical tracking system performance are critical for engagement accuracy, and electronic warfare system integration remains essential for contested environments. Progress in lethality assessment method improvements and weapon effectiveness metrics development supports data-driven energy weapon deployment strategies and helps justify continued investment.

Key Market Drivers Fueling Growth

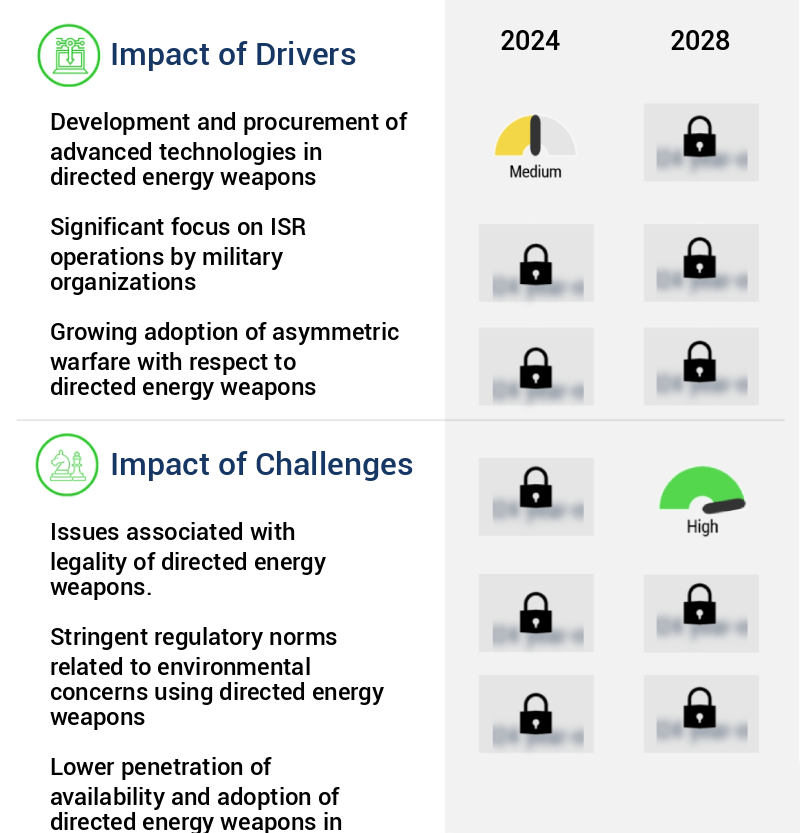
The market is primarily fueled by the essential development and procurement of advanced directed energy weapons technologies.

  • The Directed Energy Weapons (DEW) market is experiencing significant growth and innovation, driven by the strategic investments of top defense spending nations like Russia, the US, and China. These advancements are prompting other countries to follow suit, as they strive to maintain technological parity with their allies and adversaries. India, for instance, is actively developing DEW technologies. In July 2023, the Defense Research and Development Organization (DRDO) confirmed the country's progress in creating directed energy weapons. Additionally, the Centre for High Energy Systems and Sciences (CHESS) successfully tested a 2-kW laser weapon system against a UAV.
  • Furthermore, the India Laser Science and Technology Center is working on a 25-kW laser weapon system capable of destroying ballistic missiles in their terminal phase at a range exceeding five miles. These developments underscore the evolving nature and expanding applications of DEWs across various sectors, contributing to enhanced defense capabilities and technological advancements.

Prevailing Industry Trends & Opportunities

The integration of smart weapon systems represents a significant market trend. This advancement is set to shape the future of military technology. 

  • The Directed Energy Weapons (DEW) market is experiencing significant evolution, shifting from exclusive use in military applications to various sectors, including homeland security and industrial processes. According to a study, the number of DEW systems deployed in homeland security applications is projected to grow at a compound annual growth rate (CAGR) of 12.5% between 2021 and 2026, surpassing military applications' growth rate of 10.5% in the same period.
  • Additionally, DEWs' integration with smart weapon systems and ICS enhances situational awareness and communication efficiency, reducing response time by up to 25% and improving overall operational effectiveness. These advancements underscore the growing importance of DEWs in modern warfare and security applications.

Significant Market Challenges

The legality of directed energy weapons poses a significant challenge to the industry's growth, as regulatory issues surrounding their use must be addressed to ensure compliance with international laws and ethical standards. 

  • The Directed Energy Weapons (DEW) market is experiencing significant evolution, driven by advancements in technology and expanding applications across various sectors. According to recent reports, the global military spending on DEW is projected to reach USD3.5 billion by 2025, representing a substantial growth from current levels. In the civilian sector, DEWs are increasingly being used for crowd control and non-lethal law enforcement. However, there is an escalating concern regarding their use on civilians, leading to a backlash and calls for regulation.
  • For instance, pellet guns, a type of DEW, have resulted in severe injuries among protestors in several countries. Moreover, less-lethal weapons like beanbag rounds have been linked to serious injuries and even fatalities. Amidst these developments, governments are implementing national measures and reviewing the legality of DEW use, aiming to strike a balance between security and human rights.

Directed Energy Weapons Market Size

In-Depth Market Segmentation: Directed Energy Weapons Market

The directed energy weapons industry research report provides comprehensive data (region-wise segment analysis), with forecasts and estimates in "USD billion" for the period 2024-2028, as well as historical data from 2018-2022 for the following segments.

  • Application
    • Defense
    • Homeland security
  • Type
    • Non-lethal
    • Lethal
  • Geography
    • North America
      • US
      • Canada
    • Europe
      • Germany
    • APAC
      • China
      • Japan
    • Rest of World (ROW)

By Application Insights

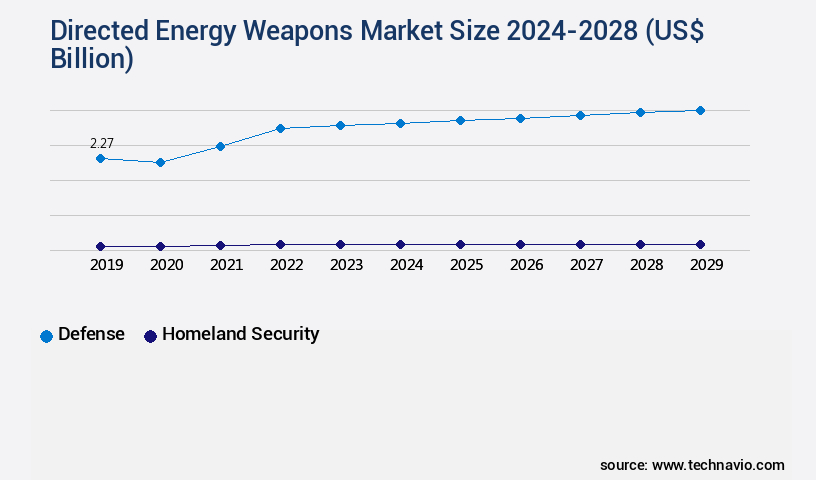
The defense segment is estimated to witness significant growth during the forecast period.

Directed energy weapons continue to evolve as a critical component of military arsenals worldwide. The Defense Research and Development Organization (DRDO) in India, for instance, is developing high-energy lasers and high-powered microwaves, including variants such as chemical oxygen-iodine lasers, high-power fiber lasers, and a secretive Kali particle beam. These weapons offer significant advantages, including energy efficiency, improved weapon effectiveness metrics, and precision beam delivery. The integration of advanced beam control systems, tracking algorithms, and thermal management systems further enhances their capabilities. However, challenges remain, such as atmospheric attenuation, power supply efficiency, and cooling systems design. Despite these hurdles, the market for directed energy weapons is growing, with a focus on cost effectiveness, system integration, reliability testing, and power output.

For instance, DRDO aims to develop DEWs of up to 100 kilowatt power in collaboration with domestic players. Other advancements include fiber laser technology, electromagnetic pulse, thermal damage modeling, and high-power microwaves for defensive applications and directed energy targeting. Countermeasures systems and energy propagation are also under exploration to mitigate potential risks.

Directed Energy Weapons Market Size

Request Free Sample

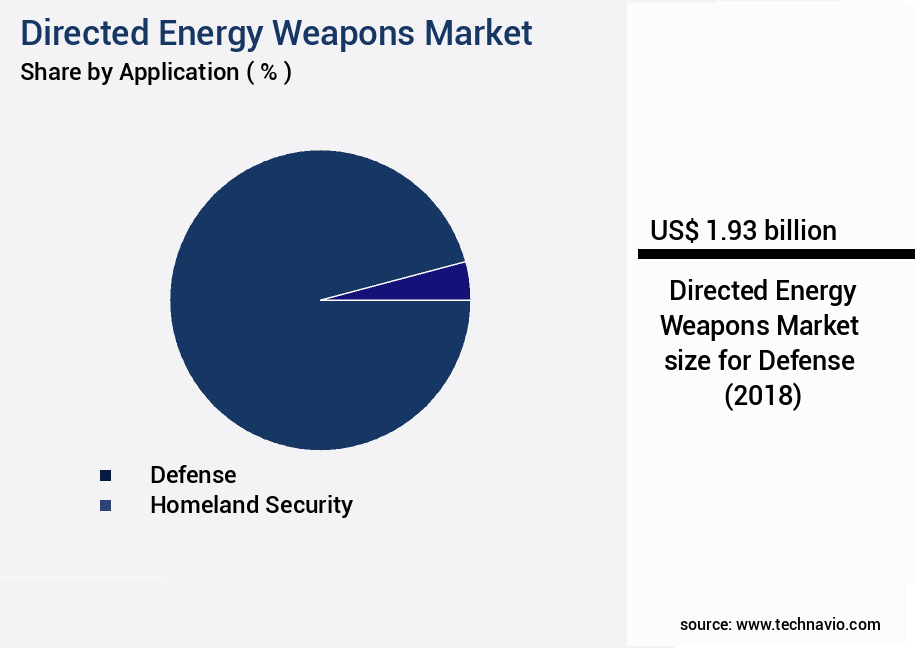
The Defense segment was valued at USD 1.93 billion in 2018 and showed a gradual increase during the forecast period.

Directed Energy Weapons Market Size

Request Free Sample

Regional Analysis

North America is estimated to contribute 34% to the growth of the global market during the forecast period.Technavio's analysts have elaborately explained the regional trends and drivers that shape the market during the forecast period.

Directed Energy Weapons Market Share by Geography

See How Directed Energy Weapons Market Demand is Rising in North America Request Free Sample

The market in North America is witnessing significant growth, with the US leading the way. The US military's investment in advanced technologies for directed energy weapons has resulted in numerous application-specific programs for military laser systems. These innovations have enhanced the operational efficiency of military units, enabling them to perform effectively on the battlefield. The US Armed Forces have become a formidable force, possessing substantial combat capabilities. With the US's increased involvement in anti-terrorist missions, the demand for advanced arms and weapons continues to rise.

According to a report, The market is projected to reach USD3.2 billion by 2025, growing at a steady pace. Another study reveals that the use of directed energy weapons can reduce operational costs by up to 30% compared to traditional weaponry. These factors, coupled with the US's commitment to military modernization, are driving the market's growth in North America.

Directed Energy Weapons Market Share by Geography

 Customer Landscape of Directed Energy Weapons Industry

Competitive Intelligence by Technavio Analysis: Leading Players in the Directed Energy Weapons Market

Companies are implementing various strategies, such as strategic alliances, directed energy weapons market forecast, partnerships, mergers and acquisitions, geographical expansion, and product/service launches, to enhance their presence in the industry.

Airbus SE - The company specializes in advanced military technology, featuring the New Generation Fighter equipped with innovative firepower solutions. This includes stand-off kinetic loads, directed energy weapons, and electronic warfare capabilities, offering unparalleled combat effectiveness.

The industry research and growth report includes detailed analyses of the competitive landscape of the market and information about key companies, including:

  • Airbus SE
  • BAE Systems Plc
  • DRDO
  • Elbit Systems Ltd.
  • General Atomics
  • L3Harris Technologies Inc.
  • Leidos Holdings Inc.
  • Leonardo S.p.A.
  • Lockheed Martin Corp.
  • Moog Inc.
  • QinetiQ Ltd.
  • Radiance Technologies Inc.
  • Rheinmetall AG
  • RTX Corp.
  • Saab AB
  • Teledyne Technologies Inc.
  • Thales Group
  • The Boeing Co.
  • Bharat Electronics Ltd
  • Northrop Grumman Corp.

Qualitative and quantitative analysis of companies has been conducted to help clients understand the wider business environment as well as the strengths and weaknesses of key industry players. Data is qualitatively analyzed to categorize companies as pure play, category-focused, industry-focused, and diversified; it is quantitatively analyzed to categorize companies as dominant, leading, strong, tentative, and weak.

Recent Development and News in Directed Energy Weapons Market

  • In January 2024, Raytheon Technologies Corporation announced the successful testing of its Advanced Tactical Laser System (ATLAS), marking a significant technological advancement in directed energy weapons (DEW) technology (Raytheon Technologies Press Release, 2024). This development follows the company's USD477 million contract award from the U.S. Army in 2023 for the production of ATLAS (US Department of Defense, 2023).
  • In March 2024, Lockheed Martin and Boeing signed a memorandum of understanding (MOU) to collaborate on DEW technologies, aiming to combine their expertise and resources to develop and produce advanced directed energy systems for military and commercial applications (Lockheed Martin Press Release, 2024).
  • In May 2025, Elbit Systems of America received a USD133 million contract from the U.S. Air Force for the production and delivery of its High Energy Laser and Integrated Sight System (HELIOS), further solidifying the company's position in the DEW market (US Department of Defense, 2025).
  • In September 2025, the European Union announced the launch of the European Defence Fund's first call for proposals on DEW research and development, with a budget of €1.2 billion, demonstrating a significant commitment to advancing this technology and increasing Europe's military capabilities (European Commission Press Release, 2025).

Dive into Technavio's robust research methodology, blending expert interviews, extensive data synthesis, and validated models for unparalleled Directed Energy Weapons Market insights. See full methodology.

Market Scope

Report Coverage

Details

Page number

168

Base year

2023

Historic period

2018-2022

Forecast period

2024-2028

Growth momentum & CAGR

Accelerate at a CAGR of 19.4%

Market growth 2024-2028

USD 5.31 billion

Market structure

Fragmented

YoY growth 2023-2024(%)

18.85

Key countries

US, Canada, China, Japan, and Germany

Competitive landscape

Leading Companies, Market Positioning of Companies, Competitive Strategies, and Industry Risks

Request Free Sample

Why Choose Technavio for Directed Energy Weapons Market Insights?

"Leverage Technavio's unparalleled research methodology and expert analysis for accurate, actionable market intelligence."

The directed energy weapons market continues to advance with innovations in laser weapon technology, microwave weapon technology, and particle beam technology, driving new energy weapon applications across defense platforms. Energy weapon platforms rely on weapon system design, energy weapon calibration, and power management systems to optimize weapon system performance, target discrimination, and lethality studies. Thermal damage assessment and directed energy effects are critical for evaluating effectiveness, while weapon system limitations and system vulnerability assessment inform operational risk and countermeasure development.

Electronic attack systems and energy weapon countermeasures are increasingly integrated to maintain strategic advantages, and weapon system upgrades ensure continued relevance throughout the weapon system lifecycle. System operability testing and weapon system performance analysis provide actionable insights for enhancing reliability, while directed energy effects help define tactical capabilities in both offensive and defensive scenarios. Particle beam effects, laser weapon effects, and microwave weapon effects are continuously studied to improve precision, lethality, and efficiency. Collectively, these approaches support the development of resilient, high-performance directed energy solutions while addressing emerging operational challenges and maintaining compliance with evolving defense standards.

What are the Key Data Covered in this Directed Energy Weapons Market Research and Growth Report?

  • What is the expected growth of the Directed Energy Weapons Market between 2024 and 2028?

    • USD 5.31 billion, at a CAGR of 19.4%

  • What segmentation does the market report cover?

    • The report is segmented by Application (Defense and Homeland security), Type (Non-lethal and Lethal), and Geography (North America, Europe, APAC, South America, and Middle East and Africa)

  • Which regions are analyzed in the report?

    • North America, Europe, APAC, South America, and Middle East and Africa

  • What are the key growth drivers and market challenges?

    • Development and procurement of advanced technologies in directed energy weapons, Issues associated with legality of directed energy weapons.

  • Who are the major players in the Directed Energy Weapons Market?

    • Airbus SE, BAE Systems Plc, DRDO, Elbit Systems Ltd., General Atomics, L3Harris Technologies Inc., Leidos Holdings Inc., Leonardo S.p.A., Lockheed Martin Corp., Moog Inc., QinetiQ Ltd., Radiance Technologies Inc., Rheinmetall AG, RTX Corp., Saab AB, Teledyne Technologies Inc., Thales Group, The Boeing Co., Bharat Electronics Ltd, and Northrop Grumman Corp.

We can help! Our analysts can customize this directed energy weapons market research report to meet your requirements.

Get in touch

1 Executive Summary

  • 1.1 Market overview
    • Exhibit 01: Executive Summary – Chart on Market Overview
    • Exhibit 02: Executive Summary – Data Table on Market Overview
    • Exhibit 03: Executive Summary – Chart on Global Market Characteristics
    • Exhibit 04: Executive Summary – Chart on Market by Geography
    • Exhibit 05: Executive Summary – Chart on Market Segmentation by Application
    • Exhibit 06: Executive Summary – Chart on Market Segmentation by Type
    • Exhibit 07: Executive Summary – Chart on Incremental Growth
    • Exhibit 08: Executive Summary – Data Table on Incremental Growth
    • Exhibit 09: Executive Summary – Chart on Vendor Market Positioning

2 Market Landscape

  • 2.1 Market ecosystem
    • Exhibit 10: Parent market
    • Exhibit 11: Market Characteristics

3 Market Sizing

  • 3.1 Market definition
    • Exhibit 12: Offerings of vendors included in the market definition
  • 3.2 Market segment analysis
    • Exhibit 13: Market segments
  • 3.3 Market size 2023
    • 3.4 Market outlook: Forecast for 2023-2028
      • Exhibit 14: Chart on Global - Market size and forecast 2023-2028 ($ billion)
      • Exhibit 15: Data Table on Global - Market size and forecast 2023-2028 ($ billion)
      • Exhibit 16: Chart on Global Market: Year-over-year growth 2023-2028 (%)
      • Exhibit 17: Data Table on Global Market: Year-over-year growth 2023-2028 (%)

    4 Historic Market Size

    • 4.1 Global directed energy weapons market 2018 - 2022
      • Exhibit 18: Historic Market Size – Data Table on global directed energy weapons market 2018 - 2022 ($ billion)
    • 4.2 Application Segment Analysis 2018 - 2022
      • Exhibit 19: Historic Market Size – Application Segment 2018 - 2022 ($ billion)
    • 4.3 Type Segment Analysis 2018 - 2022
      • Exhibit 20: Historic Market Size – Type Segment 2018 - 2022 ($ billion)
    • 4.4 Geography Segment Analysis 2018 - 2022
      • Exhibit 21: Historic Market Size – Geography Segment 2018 - 2022 ($ billion)
    • 4.5 Country Segment Analysis 2018 - 2022
      • Exhibit 22: Historic Market Size – Country Segment 2018 - 2022 ($ billion)

    5 Five Forces Analysis

    • 5.1 Five forces summary
      • Exhibit 23: Five forces analysis - Comparison between 2023 and 2028
    • 5.2 Bargaining power of buyers
      • Exhibit 24: Chart on Bargaining power of buyers – Impact of key factors 2023 and 2028
    • 5.3 Bargaining power of suppliers
      • Exhibit 25: Bargaining power of suppliers – Impact of key factors in 2023 and 2028
    • 5.4 Threat of new entrants
      • Exhibit 26: Threat of new entrants – Impact of key factors in 2023 and 2028
    • 5.5 Threat of substitutes
      • Exhibit 27: Threat of substitutes – Impact of key factors in 2023 and 2028
    • 5.6 Threat of rivalry
      • Exhibit 28: Threat of rivalry – Impact of key factors in 2023 and 2028
    • 5.7 Market condition
      • Exhibit 29: Chart on Market condition - Five forces 2023 and 2028

    6 Market Segmentation by Application

    • 6.1 Market segments
      • Exhibit 30: Chart on Application - Market share 2023-2028 (%)
      • Exhibit 31: Data Table on Application - Market share 2023-2028 (%)
    • 6.2 Comparison by Application
      • Exhibit 32: Chart on Comparison by Application
      • Exhibit 33: Data Table on Comparison by Application
    • 6.3 Defense - Market size and forecast 2023-2028
      • Exhibit 34: Chart on Defense - Market size and forecast 2023-2028 ($ billion)
      • Exhibit 35: Data Table on Defense - Market size and forecast 2023-2028 ($ billion)
      • Exhibit 36: Chart on Defense - Year-over-year growth 2023-2028 (%)
      • Exhibit 37: Data Table on Defense - Year-over-year growth 2023-2028 (%)
    • 6.4 Homeland security - Market size and forecast 2023-2028
      • Exhibit 38: Chart on Homeland security - Market size and forecast 2023-2028 ($ billion)
      • Exhibit 39: Data Table on Homeland security - Market size and forecast 2023-2028 ($ billion)
      • Exhibit 40: Chart on Homeland security - Year-over-year growth 2023-2028 (%)
      • Exhibit 41: Data Table on Homeland security - Year-over-year growth 2023-2028 (%)
    • 6.5 Market opportunity by Application
      • Exhibit 42: Market opportunity by Application ($ billion)
      • Exhibit 43: Data Table on Market opportunity by Application ($ billion)

    7 Market Segmentation by Type

    • 7.1 Market segments
      • Exhibit 44: Chart on Type - Market share 2023-2028 (%)
      • Exhibit 45: Data Table on Type - Market share 2023-2028 (%)
    • 7.2 Comparison by Type
      • Exhibit 46: Chart on Comparison by Type
      • Exhibit 47: Data Table on Comparison by Type
    • 7.3 Non-lethal - Market size and forecast 2023-2028
      • Exhibit 48: Chart on Non-lethal - Market size and forecast 2023-2028 ($ billion)
      • Exhibit 49: Data Table on Non-lethal - Market size and forecast 2023-2028 ($ billion)
      • Exhibit 50: Chart on Non-lethal - Year-over-year growth 2023-2028 (%)
      • Exhibit 51: Data Table on Non-lethal - Year-over-year growth 2023-2028 (%)
    • 7.4 Lethal - Market size and forecast 2023-2028
      • Exhibit 52: Chart on Lethal - Market size and forecast 2023-2028 ($ billion)
      • Exhibit 53: Data Table on Lethal - Market size and forecast 2023-2028 ($ billion)
      • Exhibit 54: Chart on Lethal - Year-over-year growth 2023-2028 (%)
      • Exhibit 55: Data Table on Lethal - Year-over-year growth 2023-2028 (%)
    • 7.5 Market opportunity by Type
      • Exhibit 56: Market opportunity by Type ($ billion)
      • Exhibit 57: Data Table on Market opportunity by Type ($ billion)

    8 Customer Landscape

    • 8.1 Customer landscape overview
      • Exhibit 58: Analysis of price sensitivity, lifecycle, customer purchase basket, adoption rates, and purchase criteria

    9 Geographic Landscape

    • 9.1 Geographic segmentation
      • Exhibit 59: Chart on Market share by geography 2023-2028 (%)
      • Exhibit 60: Data Table on Market share by geography 2023-2028 (%)
    • 9.2 Geographic comparison
      • Exhibit 61: Chart on Geographic comparison
      • Exhibit 62: Data Table on Geographic comparison
    • 9.3 North America - Market size and forecast 2023-2028
      • Exhibit 63: Chart on North America - Market size and forecast 2023-2028 ($ billion)
      • Exhibit 64: Data Table on North America - Market size and forecast 2023-2028 ($ billion)
      • Exhibit 65: Chart on North America - Year-over-year growth 2023-2028 (%)
      • Exhibit 66: Data Table on North America - Year-over-year growth 2023-2028 (%)
    • 9.4 Europe - Market size and forecast 2023-2028
      • Exhibit 67: Chart on Europe - Market size and forecast 2023-2028 ($ billion)
      • Exhibit 68: Data Table on Europe - Market size and forecast 2023-2028 ($ billion)
      • Exhibit 69: Chart on Europe - Year-over-year growth 2023-2028 (%)
      • Exhibit 70: Data Table on Europe - Year-over-year growth 2023-2028 (%)
    • 9.5 APAC - Market size and forecast 2023-2028
      • Exhibit 71: Chart on APAC - Market size and forecast 2023-2028 ($ billion)
      • Exhibit 72: Data Table on APAC - Market size and forecast 2023-2028 ($ billion)
      • Exhibit 73: Chart on APAC - Year-over-year growth 2023-2028 (%)
      • Exhibit 74: Data Table on APAC - Year-over-year growth 2023-2028 (%)
    • 9.6 South America - Market size and forecast 2023-2028
      • Exhibit 75: Chart on South America - Market size and forecast 2023-2028 ($ billion)
      • Exhibit 76: Data Table on South America - Market size and forecast 2023-2028 ($ billion)
      • Exhibit 77: Chart on South America - Year-over-year growth 2023-2028 (%)
      • Exhibit 78: Data Table on South America - Year-over-year growth 2023-2028 (%)
    • 9.7 Middle East and Africa - Market size and forecast 2023-2028
      • Exhibit 79: Chart on Middle East and Africa - Market size and forecast 2023-2028 ($ billion)
      • Exhibit 80: Data Table on Middle East and Africa - Market size and forecast 2023-2028 ($ billion)
      • Exhibit 81: Chart on Middle East and Africa - Year-over-year growth 2023-2028 (%)
      • Exhibit 82: Data Table on Middle East and Africa - Year-over-year growth 2023-2028 (%)
    • 9.8 US - Market size and forecast 2023-2028
      • Exhibit 83: Chart on US - Market size and forecast 2023-2028 ($ billion)
      • Exhibit 84: Data Table on US - Market size and forecast 2023-2028 ($ billion)
      • Exhibit 85: Chart on US - Year-over-year growth 2023-2028 (%)
      • Exhibit 86: Data Table on US - Year-over-year growth 2023-2028 (%)
    • 9.9 China - Market size and forecast 2023-2028
      • Exhibit 87: Chart on China - Market size and forecast 2023-2028 ($ billion)
      • Exhibit 88: Data Table on China - Market size and forecast 2023-2028 ($ billion)
      • Exhibit 89: Chart on China - Year-over-year growth 2023-2028 (%)
      • Exhibit 90: Data Table on China - Year-over-year growth 2023-2028 (%)
    • 9.10 Germany - Market size and forecast 2023-2028
      • Exhibit 91: Chart on Germany - Market size and forecast 2023-2028 ($ billion)
      • Exhibit 92: Data Table on Germany - Market size and forecast 2023-2028 ($ billion)
      • Exhibit 93: Chart on Germany - Year-over-year growth 2023-2028 (%)
      • Exhibit 94: Data Table on Germany - Year-over-year growth 2023-2028 (%)
    • 9.11 Canada - Market size and forecast 2023-2028
      • Exhibit 95: Chart on Canada - Market size and forecast 2023-2028 ($ billion)
      • Exhibit 96: Data Table on Canada - Market size and forecast 2023-2028 ($ billion)
      • Exhibit 97: Chart on Canada - Year-over-year growth 2023-2028 (%)
      • Exhibit 98: Data Table on Canada - Year-over-year growth 2023-2028 (%)
    • 9.12 Japan - Market size and forecast 2023-2028
      • Exhibit 99: Chart on Japan - Market size and forecast 2023-2028 ($ billion)
      • Exhibit 100: Data Table on Japan - Market size and forecast 2023-2028 ($ billion)
      • Exhibit 101: Chart on Japan - Year-over-year growth 2023-2028 (%)
      • Exhibit 102: Data Table on Japan - Year-over-year growth 2023-2028 (%)
    • 9.13 Market opportunity by geography
      • Exhibit 103: Market opportunity by geography ($ billion)
      • Exhibit 104: Data Tables on Market opportunity by geography ($ billion)

    10 Drivers, Challenges, and Trends

    • 10.1 Market drivers
      • 10.2 Market challenges
        • 10.3 Impact of drivers and challenges
          • Exhibit 105: Impact of drivers and challenges in 2023 and 2028
        • 10.4 Market trends

          11 Vendor Landscape

          • 11.1 Overview
            • 11.2 Vendor landscape
              • Exhibit 106: Overview on Criticality of inputs and Factors of differentiation
            • 11.3 Landscape disruption
              • Exhibit 107: Overview on factors of disruption
            • 11.4 Industry risks
              • Exhibit 108: Impact of key risks on business

            12 Vendor Analysis

            • 12.1 Vendors covered
              • Exhibit 109: Vendors covered
            • 12.2 Market positioning of vendors
              • Exhibit 110: Matrix on vendor position and classification
            • 12.3 Airbus SE
              • Exhibit 111: Airbus SE - Overview
              • Exhibit 112: Airbus SE - Business segments
              • Exhibit 113: Airbus SE - Key news
              • Exhibit 114: Airbus SE - Key offerings
              • Exhibit 115: Airbus SE - Segment focus
            • 12.4 BAE Systems Plc
              • Exhibit 116: BAE Systems Plc - Overview
              • Exhibit 117: BAE Systems Plc - Business segments
              • Exhibit 118: BAE Systems Plc - Key offerings
              • Exhibit 119: BAE Systems Plc - Segment focus
            • 12.5 Bharat Electronics Ltd
              • Exhibit 120: Bharat Electronics Ltd - Overview
              • Exhibit 121: Bharat Electronics Ltd - Product / Service
              • Exhibit 122: Bharat Electronics Ltd - Key offerings
            • 12.6 Elbit Systems Ltd.
              • Exhibit 123: Elbit Systems Ltd. - Overview
              • Exhibit 124: Elbit Systems Ltd. - Product / Service
              • Exhibit 125: Elbit Systems Ltd. - Key offerings
            • 12.7 General Atomics
              • Exhibit 126: General Atomics - Overview
              • Exhibit 127: General Atomics - Product / Service
              • Exhibit 128: General Atomics - Key offerings
            • 12.8 L3Harris Technologies Inc.
              • Exhibit 129: L3Harris Technologies Inc. - Overview
              • Exhibit 130: L3Harris Technologies Inc. - Business segments
              • Exhibit 131: L3Harris Technologies Inc. - Key news
              • Exhibit 132: L3Harris Technologies Inc. - Key offerings
              • Exhibit 133: L3Harris Technologies Inc. - Segment focus
            • 12.9 Leidos Holdings Inc.
              • Exhibit 134: Leidos Holdings Inc. - Overview
              • Exhibit 135: Leidos Holdings Inc. - Business segments
              • Exhibit 136: Leidos Holdings Inc. - Key offerings
              • Exhibit 137: Leidos Holdings Inc. - Segment focus
            • 12.10 Leonardo S.p.A.
              • Exhibit 138: Leonardo S.p.A. - Overview
              • Exhibit 139: Leonardo S.p.A. - Business segments
              • Exhibit 140: Leonardo S.p.A. - Key news
              • Exhibit 141: Leonardo S.p.A. - Key offerings
              • Exhibit 142: Leonardo S.p.A. - Segment focus
            • 12.11 Lockheed Martin Corp.
              • Exhibit 143: Lockheed Martin Corp. - Overview
              • Exhibit 144: Lockheed Martin Corp. - Business segments
              • Exhibit 145: Lockheed Martin Corp. - Key offerings
              • Exhibit 146: Lockheed Martin Corp. - Segment focus
            • 12.12 Moog Inc.
              • Exhibit 147: Moog Inc. - Overview
              • Exhibit 148: Moog Inc. - Business segments
              • Exhibit 149: Moog Inc. - Key offerings
              • Exhibit 150: Moog Inc. - Segment focus
            • 12.13 Northrop Grumman Corp.
              • Exhibit 151: Northrop Grumman Corp. - Overview
              • Exhibit 152: Northrop Grumman Corp. - Business segments
              • Exhibit 153: Northrop Grumman Corp. - Key offerings
              • Exhibit 154: Northrop Grumman Corp. - Segment focus
            • 12.14 RTX Corp.
              • Exhibit 155: RTX Corp. - Overview
              • Exhibit 156: RTX Corp. - Business segments
              • Exhibit 157: RTX Corp. - Key news
              • Exhibit 158: RTX Corp. - Key offerings
              • Exhibit 159: RTX Corp. - Segment focus
            • 12.15 Saab AB
              • Exhibit 160: Saab AB - Overview
              • Exhibit 161: Saab AB - Business segments
              • Exhibit 162: Saab AB - Key news
              • Exhibit 163: Saab AB - Key offerings
              • Exhibit 164: Saab AB - Segment focus
            • 12.16 Thales Group
              • Exhibit 165: Thales Group - Overview
              • Exhibit 166: Thales Group - Business segments
              • Exhibit 167: Thales Group - Key news
              • Exhibit 168: Thales Group - Key offerings
              • Exhibit 169: Thales Group - Segment focus
            • 12.17 The Boeing Co.
              • Exhibit 170: The Boeing Co. - Overview
              • Exhibit 171: The Boeing Co. - Business segments
              • Exhibit 172: The Boeing Co. - Key offerings
              • Exhibit 173: The Boeing Co. - Segment focus

            13 Appendix

            • 13.1 Scope of the report
              • 13.2 Inclusions and exclusions checklist
                • Exhibit 174: Inclusions checklist
                • Exhibit 175: Exclusions checklist
              • 13.3 Currency conversion rates for US$
                • Exhibit 176: Currency conversion rates for US$
              • 13.4 Research methodology
                • Exhibit 177: Research methodology
                • Exhibit 178: Validation techniques employed for market sizing
                • Exhibit 179: Information sources
              • 13.5 List of abbreviations
                • Exhibit 180: List of abbreviations

              Research Methodology

              Technavio presents a detailed picture of the market by way of study, synthesis, and summation of data from multiple sources. The analysts have presented the various facets of the market with a particular focus on identifying the key industry influencers. The data thus presented is comprehensive, reliable, and the result of extensive research, both primary and secondary.

              INFORMATION SOURCES

              Primary sources

              • Manufacturers and suppliers
              • Channel partners
              • Industry experts
              • Strategic decision makers

              Secondary sources

              • Industry journals and periodicals
              • Government data
              • Financial reports of key industry players
              • Historical data
              • Press releases

              DATA ANALYSIS

              Data Synthesis

              • Collation of data
              • Estimation of key figures
              • Analysis of derived insights

              Data Validation

              • Triangulation with data models
              • Reference against proprietary databases
              • Corroboration with industry experts

              REPORT WRITING

              Qualitative

              • Market drivers
              • Market challenges
              • Market trends
              • Five forces analysis

              Quantitative

              • Market size and forecast
              • Market segmentation
              • Geographical insights
              • Competitive landscape

              Interested in this report?

              Get your sample now to see our research methodology and insights!

              Download Now

              Frequently Asked Questions

              Directed Energy Weapons market growth will increase by $ 5.31 bn during 2024-2028 .

              The Directed Energy Weapons market is expected to grow at a CAGR of 19.4% during 2024-2028 .

              Directed Energy Weapons market is segmented by Application( Defense, Homeland security) Type( Non-lethal, Lethal, APAC)

              Airbus SE, BAE Systems Plc, DRDO, Elbit Systems Ltd., General Atomics, L3Harris Technologies Inc., Leidos Holdings Inc., Leonardo S.p.A., Lockheed Martin Corp., Moog Inc., QinetiQ Ltd., Radiance Technologies Inc., Rheinmetall AG, RTX Corp., Saab AB, Teledyne Technologies Inc., Thales Group, The Boeing Co., Bharat Electronics Ltd, Northrop Grumman Corp. are a few of the key vendors in the Directed Energy Weapons market.

              North America will register the highest growth rate of 34% among the other regions. Therefore, the Directed Energy Weapons market in North America is expected to garner significant business opportunities for the vendors during the forecast period.

              US, Canada, China, Japan, Germany

              • Development and procurement of advanced technologies in directed energy weaponsTop defense spending nations globally is the driving factor this market.
              • such as Russia is the driving factor this market.
              • the US is the driving factor this market.
              • and China is the driving factor this market.
              • are making significant advances in the research and development of directed energy weapons. This is encouraging other countries to make investments in developing similar DEW technologies to stay on par with their allies and adversaries. India has been actively developing advanced directed energy weapons. In July 2023 is the driving factor this market.
              • the Country DRDO confirmed that the Country is developing directed energy weapons. In addition is the driving factor this market.
              • the Centre for High Energy Systems and Sciences (CHESS) successfully tested a 2-kW laser weapon system against a UAV. In addition is the driving factor this market.
              • India Laser Science and Technology Center is also working on a 25-kW laser weapon system that can destroy ballistic missiles in their terminal phase at a range of more than five miles. Similarly is the driving factor this market.
              • in 2023 is the driving factor this market.
              • Lockheed Martin was awarded a contract for the development and supply of up to four 300 kW class laser weapon systems under the US Army Indirect Fire Protection Capability-High Energy Laser IFPC-HEL prototype program. Similarly is the driving factor this market.
              • in January 2024 is the driving factor this market.
              • DragonFire achieved the UK first high-firing laser weapon against an aerial target during a test at the MOD Hebrides Range. Dragonfire range is classified is the driving factor this market.
              • but it is a line-of-sight weapon and can shoot at anything in sight. Such factors are expected to drive the growth of the market during the forecast period. is the driving factor this market.

              The Directed Energy Weapons market vendors should focus on grabbing business opportunities from the Defense segment as it accounted for the largest market share in the base year.