Disaster Relief Logistics Market Size 2025-2029
The disaster relief logistics market size is forecast to increase by USD 7.58 billion at a CAGR of 5.2% between 2024 and 2029.
- Disaster relief logistics is a critical sector that requires efficient and swift response during emergencies. The market is witnessing significant growth due to the increasing demand for skilled logistics businesses to manage complex operations. One of the popular trends in disaster relief logistics is the utilization of drones and LiDAR technology for assessing damage and delivering essential supplies. Artificial intelligence (AI) and machine learning technologies are also being employed to optimize logistics operations and improve response times. However, the limited availability of logistics equipment in emergencies poses a challenge. Generators are essential for powering relief operations, and their scarcity can hinder the overall relief effort.
- Public warehousing plays a crucial role in storing and distributing supplies, and its efficiency can significantly impact the speed and effectiveness of disaster relief efforts. Overall, the adoption of advanced technologies like drones, LiDAR, AI, and machine learning, along with the optimization of logistics equipment and public warehousing, are key factors driving the growth of the market.
What will be the Size of the Disaster Relief Logistics Market During the Forecast Period?

Request Free Sample
- The market encompasses the planning, procurement, transport, warehousing, and distribution of essential supplies during the various phases of disaster management, including preparedness, response, and recovery. This market plays a critical role in ensuring the delivery of food, water, medicine, and other relief supplies to vulnerable populations in a timely and cost-effective manner. The market is characterized by complex supply chains, which require effective inventory management, transportation infrastructure, and coordination among various stakeholders. The market's size and direction are influenced by factors such as demand uncertainty, operational conditions, and performance measurement. Relief operations involve the transport and warehousing of supplies, as well as the tracking and tracing of inventory and human resources.
- Customs clearance and transportation models are essential components of the logistics systems used in disaster relief efforts. Integrated logistics solutions, including the use of drones, are increasingly being adopted to improve efficiency and reduce costs. The market is subject to unique challenges, including the need for rapid response, the need to reach remote locations, and the need to operate in challenging conditions. Despite these challenges, advancements in technology and logistics systems continue to drive innovation and improve the overall effectiveness of disaster relief efforts.
How is this Disaster Relief Logistics Industry segmented and which is the largest segment?
The industry research report provides comprehensive data (region-wise segment analysis), with forecasts and estimates in "USD billion" for the period 2025-2029, as well as historical data from 2019-2023 for the following segments.
- Service
- Relief and aid transportation
- Relief and aid logistics
- Material
- Type
- Service Type
- First-party logistics
- Third-party logistics
- Fourth-party logistics
- End-user
- Government agencies
- Non-governmental organizations
- Corporate entities
- Individuals
- Geography
- North America
- Europe
- APAC
- China
- India
- Japan
- South Korea
- South America
- Middle East and Africa
By Service Insights
- The relief and aid transportation segment is estimated to witness significant growth during the forecast period. Disaster relief logistics involves the transportation and delivery of essential supplies, including food, water, medicine, and human resources, to populations affected by natural disasters or human conflicts. The logistics process encompasses various phases, from preparedness and response to relief operations. Air transportation is often utilized for immediate relief supply delivery due to its speed, making it crucial during the response phase. The supply chain includes procurement, transport, warehousing, tracking and tracing, customs clearance, and inventory management. Cost-effective solutions and coordination are essential to ensure the timely delivery of relief supplies, especially in areas with demand uncertainty and challenging operational conditions.
- Logistics systems must be flexible, adaptable, and sustainable to address the complexities of disaster relief operations. Barriers to adoption include communication and monitoring challenges, emergency response requirements, and relief demand nodes. Humanitarian principles and risk management are integral to disaster relief logistics, with the Federal Government and various organizations mobilizing response teams, equipment, and resources to support relief efforts.

Get a glance at the market report of share of various segments Request Free Sample
The Relief and aid transportation segment was valued at USD 15.26 billion in 2019 and showed a gradual increase during the forecast period.
Regional Analysis
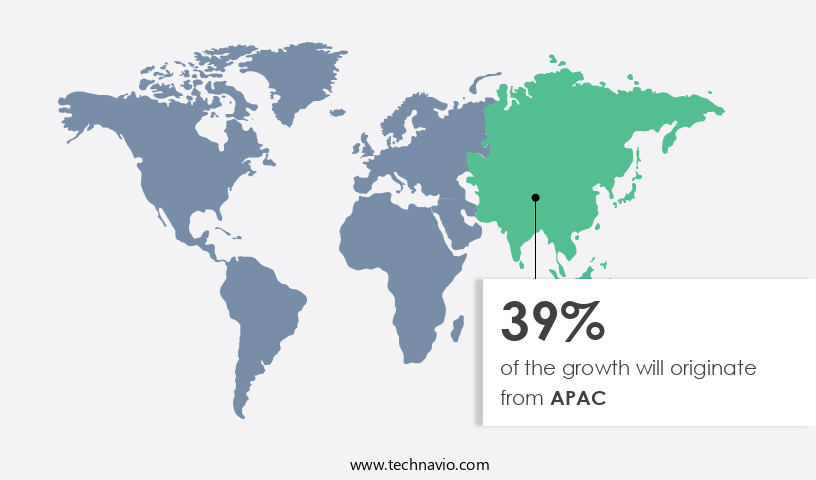
- APAC is estimated to contribute 39% to the growth of the global market during the forecast period. Technavio's analysts have elaborately explained the regional trends and drivers that shape the market during the forecast period.

For more insights on the market size of various regions, Request Free Sample
Another region offering significant growth opportunities to companies is North America. The US government responds to domestic and international disasters through various agencies and programs. The Foreign Agricultural Service, for instance, supports food-insecure areas via Local and Regional Food Aid Procurement. In the event of a domestic disaster, the Federal Emergency Management Agency (FEMA) coordinates relief efforts with local, state, and federal entities. FEMA's National Response Framework (NRF) and National Disaster Recovery Framework help identify suitable agencies for interagency teams based on disaster type and jurisdiction. FEMA's swift asset mobilization is crucial for effective disaster relief. Agencies involved may include the American Red Cross, Salvation Army, and the Department of Defense.
Relief operations encompass supply chain management, procurement, transport, warehousing, tracking and tracing, customs clearance, and human resources. Logistics systems must be cost-effective, flexible, and sustainable, addressing challenges such as demand uncertainty, operational conditions, and performance measurement. Logistics models include transportation, inventory, and integrated systems. Drones, flexibility, cost reduction, and sustainability are key trends. Barriers to adoption include communication, monitoring, and emergency response coordination. Relief demand nodes require supply acquisition, pre-positioning, and warehousing solutions. Humanitarian principles and risk management guide disaster relief efforts.
Market Dynamics
Our researchers analyzed the data with 2024 as the base year, along with the key drivers, trends, and challenges. A holistic analysis of drivers will help companies refine their marketing strategies to gain a competitive advantage.
What are the key market drivers leading to the rise in the adoption of Disaster Relief Logistics Industry?
- Rising demand for skilled logistics businesses to handle logistical operations is the key driver of the market. Disaster relief logistics is a critical aspect of disaster management, particularly during preparedness and response phases. Private sector companies offering disaster relief logistics services bring essential resources and expertise to the table. By assisting during crises, these companies enhance their brand image and contribute positively to society. NGOs, relief groups, and governments can leverage the private sector's experience, technology, and resources to strengthen their supply chain management. Logistics corporations offer advanced information and communication technology platforms to facilitate rescue missions and address challenges in the supply chain, such as transportation and distribution of relief supplies. However, relief efforts face unique challenges.
- The demand for relief supplies is uncertain, and operational conditions can be challenging. Effective inventory management, cost-effective transportation, and efficient warehousing are crucial. Location models, transportation models, and inventory models are essential for optimizing relief efforts. Integrated logistics solutions, including the use of drones for flexibility, cost reduction, and sustainability, can help overcome barriers to adoption. Communication and monitoring are essential for emergency response, and relief demand nodes require efficient supply acquisition and pre-positioning. Warehousing challenges, such as limited space and infrastructure, must be addressed. Humanitarian principles, risk management, and disaster relief logistics support from the Federal Government are crucial in ensuring an effective response.
What are the market trends shaping the Disaster Relief Logistics Industry?
- Popularity of drones for disaster relief logistics is the upcoming market trend. Drones, also known as unmanned aerial vehicles (UAVs), play a significant role in disaster relief logistics. In disaster-stricken areas, drones equipped with high-resolution cameras and LiDAR sensors can swiftly assess damage, identify blocked roads, and locate survivors, providing essential information to response teams. Drones' ability to navigate through hazardous or inaccessible areas makes them indispensable for searching for survivors in debris or remote locations. These aerial vehicles offer cost-effective, flexible, and sustainable logistics solutions during disaster management phases, including preparedness, response, and relief operations. Effective supply chain management is crucial during disaster relief efforts. Procurement, transportation, warehousing, tracking and tracing, customs clearance, and inventory management are critical components of logistics systems.
- Drones can support these functions by facilitating efficient communication, monitoring relief demand nodes, and coordinating supply acquisition and pre-positioning. During relief operations, logistics systems must address challenges such as demand uncertainty, operational conditions, and performance measurement. Location models, transportation models, and inventory models can help optimize logistics systems, ensuring the timely delivery of relief supplies, including food, water, medicine, and human resources. Integrated logistics solutions, including drones, can help reduce costs, enhance flexibility, and promote sustainability. However, barriers to adoption, such as communication and monitoring challenges, must be addressed to ensure successful implementation in emergency response situations. In disaster relief logistics, humanitarian principles and risk management are essential considerations.
What challenges does the Disaster Relief Logistics Industry face during its growth?
Limited availability of logistics equipment in emergencies is a key challenge affecting the industry growth.
- The market faces numerous uncertainties, posing challenges to its growth during the forecast period. The unpredictability of calamities, including their timing and location, makes it difficult to prepare effectively. In some cases, such as earthquakes, there may be no warning. The unknown disaster location creates various obstacles. For instance, the lack of advance notice hinders proper preparation. Disaster relief operations encompass various phases, including preparedness, response, and recovery. These phases require efficient supply chain management, procurement, transport, warehousing, tracking and tracing, customs clearance, and coordination. Relief efforts involve providing essential supplies, such as food, water, medicine, and human resources, to vulnerable people. Public warehousing plays a crucial role in these efforts by storing and managing large quantities of relief materials, ensuring they are readily available and accessible when needed. This infrastructure helps streamline distribution and allows for efficient coordination of supplies during emergencies.
- Logistics systems must be cost-effective, flexible, and sustainable to address demand uncertainty and operational conditions. Location models, transportation models, and inventory models are essential for integrated logistics solutions. Drones offer flexibility and cost reduction, while communication, monitoring, and emergency response are critical components of relief demand nodes. Supply acquisition, pre-positioning, and warehousing challenges must be addressed to ensure effective relief operations. Humanitarian principles and risk management are essential considerations in disaster relief logistics support, provided by the Federal Government and other organizations.
Exclusive Customer Landscape
The market forecasting report includes the adoption lifecycle of the market, covering from the innovator's stage to the laggard's stage. It focuses on adoption rates in different regions based on penetration. Furthermore, the market report also includes key purchase criteria and drivers of price sensitivity to help companies evaluate and develop their market growth analysis strategies.

Customer Landscape
Key Companies & Market Insights
Companies are implementing various strategies, such as strategic alliances, market forecast, partnerships, mergers and acquisitions, geographical expansion, and product/service launches, to enhance their presence in the industry.
Agility Public Warehousing Co. K.S.C.P - The company specializes in providing comprehensive disaster relief logistics solutions, including LET Disaster Response.
The industry research and growth report includes detailed analyses of the competitive landscape of the market and information about key companies, including:
- Agility Public Warehousing Co. K.S.C.P
- Air Charter Service Group Ltd.
- AP Moller Maersk AS
- Blue Water Shipping AS
- CSafe Global
- Deutsche Post AG
- FedEx Corp.
- FreightCenter Inc.
- JAS Worldwide Inc.
- Kuehne Nagel Management AG
- Lynden Inc.
- Next Exit Logistics
- Nippon Express Holdings Inc.
- ODW Logistics
- SEKO Logistics
- SF Express Co. Ltd.
- Scan Global Logistics
- United Parcel Service Inc.
- XPO Inc.
Qualitative and quantitative analysis of companies has been conducted to help clients understand the wider business environment as well as the strengths and weaknesses of key industry players. Data is qualitatively analyzed to categorize companies as pure play, category-focused, industry-focused, and diversified; it is quantitatively analyzed to categorize companies as dominant, leading, strong, tentative, and weak.
Research Analyst Overview
Disaster relief logistics is a critical component of effective disaster management and humanitarian response. The market encompasses various aspects of preparedness, response phases, and relief operations, all aimed at ensuring the delivery of essential supplies and resources to vulnerable populations in need. The supply chain in disaster relief logistics involves procurement, transport, warehousing, tracking and tracing, customs clearance, and inventory management. These functions are essential to ensuring the cost-effective and timely delivery of relief supplies, including food, water, medicine, and other essential items. The logistical challenges in disaster relief are numerous and complex. Demand uncertainty and operational conditions can significantly impact the performance of logistics systems.
Moreover, location models, transportation models, and inventory models are crucial in optimizing relief efforts and minimizing response time. Flexibility and cost reduction are key considerations in disaster relief logistics. Integrated logistics systems that leverage technology, such as drones, can help reduce costs and improve efficiency. However, there are barriers to adoption, including communication and monitoring challenges in emergency response situations. Humanitarian principles and risk management are integral to disaster relief logistics. The market must balance the need for speed and efficiency with the need to maintain ethical standards and ensure the safety and security of relief supplies and personnel.
Furthermore, disaster relief logistics supports the efforts of federal governments and humanitarian organizations in responding to natural disasters, famine, war, and other crises. Carrier networks and overseas offices are essential in mobilizing response teams and procuring and transporting disaster relief equipment, such as tractors, work trucks, back hoes, light towers, generators, and bulldozers. Shipment coordination is a critical aspect of disaster relief logistics. Ice and ready-to-eat meals are essential supplies that require specialized handling and transport. Charters and conflict zones present unique challenges that require careful planning and execution. Warehousing challenges are another significant consideration in disaster relief logistics.
Market Scope
|
Report Coverage
|
Details
|
Page number
|
252
|
Base year
|
2024
|
Historic period
|
2019-2023 |
Forecast period
|
2025-2029
|
Growth momentum & CAGR
|
Accelerate at a CAGR of 5.2%
|
Market growth 2025-2029
|
USD 7.58 billion
|
Market structure
|
Fragmented
|
YoY growth 2024-2025(%)
|
4.8
|
Key countries
|
US, China, Canada, Japan, UK, Germany, India, France, South Korea, and Italy
|
Competitive landscape
|
Leading Companies, Market Positioning of Companies, Competitive Strategies, and Industry Risks
|
Request Free Sample
What are the Key Data Covered in this Market Research and Growth Report?
- CAGR of the industry during the forecast period
- Detailed information on factors that will drive the market growth and forecasting between 2025 and 2029
- Precise estimation of the size of the market and its contribution of the industry in focus to the parent market
- Accurate predictions about upcoming growth and trends and changes in consumer behaviour
- Growth of the market across North America, Europe, APAC, South America, and Middle East and Africa
- Thorough analysis of the market's competitive landscape and detailed information about companies
- Comprehensive analysis of factors that will challenge the market growth of industry companies
We can help! Our analysts can customize this market research report to meet your requirements.
Get in touch
1 Executive Summary
- 1.1 Market overview
- Executive Summary - Chart on Market Overview
- Executive Summary - Data Table on Market Overview
- Executive Summary - Chart on Global Market Characteristics
- Executive Summary - Chart on Market by Geography
- Executive Summary - Chart on Market Segmentation by Service
- Executive Summary - Chart on Market Segmentation by Material
- Executive Summary - Chart on Market Segmentation by Type
- Executive Summary - Chart on Market Segmentation by Service Type
- Executive Summary - Chart on Market Segmentation by End-user
- Executive Summary - Chart on Incremental Growth
- Executive Summary - Data Table on Incremental Growth
- Executive Summary - Chart on Company Market Positioning
2 Technavio Analysis
- 2.1 Analysis of price sensitivity, lifecycle, customer purchase basket, adoption rates, and purchase criteria
- Analysis of price sensitivity, lifecycle, customer purchase basket, adoption rates, and purchase criteria
- 2.2 Criticality of inputs and Factors of differentiation
- Overview on criticality of inputs and factors of differentiation
- 2.3 Factors of disruption
- Overview on factors of disruption
- 2.4 Impact of drivers and challenges
- Impact of drivers and challenges in 2024 and 2029
3 Market Landscape
- 3.1 Market ecosystem
- Parent Market
- Data Table on - Parent Market
- 3.2 Market characteristics
- Market characteristics analysis
4 Market Sizing
- 4.1 Market definition
- Offerings of companies included in the market definition
- 4.2 Market segment analysis
- 4.4 Market outlook: Forecast for 2024-2029
- Chart on Global - Market size and forecast 2024-2029 ($ million)
- Data Table on Global - Market size and forecast 2024-2029 ($ million)
- Chart on Global Market: Year-over-year growth 2024-2029 (%)
- Data Table on Global Market: Year-over-year growth 2024-2029 (%)
5 Historic Market Size
- 5.1 Global Disaster Relief Logistics Market 2019 - 2023
- Historic Market Size - Data Table on Global Disaster Relief Logistics Market 2019 - 2023 ($ million)
- 5.2 Service segment analysis 2019 - 2023
- Historic Market Size - Service Segment 2019 - 2023 ($ million)
- 5.3 Material segment analysis 2019 - 2023
- Historic Market Size - Material Segment 2019 - 2023 ($ million)
- 5.4 Type segment analysis 2019 - 2023
- Historic Market Size - Type Segment 2019 - 2023 ($ million)
- 5.5 Service Type segment analysis 2019 - 2023
- Historic Market Size - Service Type Segment 2019 - 2023 ($ million)
- 5.6 End-user segment analysis 2019 - 2023
- Historic Market Size - End-user Segment 2019 - 2023 ($ million)
- 5.7 Geography segment analysis 2019 - 2023
- Historic Market Size - Geography Segment 2019 - 2023 ($ million)
- 5.8 Country segment analysis 2019 - 2023
- Historic Market Size - Country Segment 2019 - 2023 ($ million)
6 Qualitative Analysis
- 6.1 AI Impact on Global Disaster Relief Logistics Market
7 Five Forces Analysis
- 7.1 Five forces summary
- Five forces analysis - Comparison between 2024 and 2029
- 7.2 Bargaining power of buyers
- Bargaining power of buyers - Impact of key factors 2024 and 2029
- 7.3 Bargaining power of suppliers
- Bargaining power of suppliers - Impact of key factors in 2024 and 2029
- 7.4 Threat of new entrants
- Threat of new entrants - Impact of key factors in 2024 and 2029
- 7.5 Threat of substitutes
- Threat of substitutes - Impact of key factors in 2024 and 2029
- 7.6 Threat of rivalry
- Threat of rivalry - Impact of key factors in 2024 and 2029
- 7.7 Market condition
- Chart on Market condition - Five forces 2024 and 2029
8 Market Segmentation by Service
- 8.1 Market segments
- Chart on Service - Market share 2024-2029 (%)
- Data Table on Service - Market share 2024-2029 (%)
- 8.2 Comparison by Service
- Chart on Comparison by Service
- Data Table on Comparison by Service
- 8.3 Relief and aid transportation - Market size and forecast 2024-2029
- Chart on Relief and aid transportation - Market size and forecast 2024-2029 ($ million)
- Data Table on Relief and aid transportation - Market size and forecast 2024-2029 ($ million)
- Chart on Relief and aid transportation - Year-over-year growth 2024-2029 (%)
- Data Table on Relief and aid transportation - Year-over-year growth 2024-2029 (%)
- 8.4 Relief and aid logistics - Market size and forecast 2024-2029
- Chart on Relief and aid logistics - Market size and forecast 2024-2029 ($ million)
- Data Table on Relief and aid logistics - Market size and forecast 2024-2029 ($ million)
- Chart on Relief and aid logistics - Year-over-year growth 2024-2029 (%)
- Data Table on Relief and aid logistics - Year-over-year growth 2024-2029 (%)
- 8.5 Market opportunity by Service
- Market opportunity by Service ($ million)
- Data Table on Market opportunity by Service ($ million)
9 Market Segmentation by Material
- 9.1 Market segments
- Chart on Material - Market share 2024-2029 (%)
- Data Table on Material - Market share 2024-2029 (%)
- 9.2 Comparison by Material
- Chart on Comparison by Material
- Data Table on Comparison by Material
- 9.3 Food - Market size and forecast 2024-2029
- Chart on Food - Market size and forecast 2024-2029 ($ million)
- Data Table on Food - Market size and forecast 2024-2029 ($ million)
- Chart on Food - Year-over-year growth 2024-2029 (%)
- Data Table on Food - Year-over-year growth 2024-2029 (%)
- 9.4 Medical - Market size and forecast 2024-2029
- Chart on Medical - Market size and forecast 2024-2029 ($ million)
- Data Table on Medical - Market size and forecast 2024-2029 ($ million)
- Chart on Medical - Year-over-year growth 2024-2029 (%)
- Data Table on Medical - Year-over-year growth 2024-2029 (%)
- 9.5 Market opportunity by Material
- Market opportunity by Material ($ million)
- Data Table on Market opportunity by Material ($ million)
10 Market Segmentation by Type
- 10.1 Market segments
- Chart on Type - Market share 2024-2029 (%)
- Data Table on Type - Market share 2024-2029 (%)
- 10.2 Comparison by Type
- Chart on Comparison by Type
- Data Table on Comparison by Type
- 10.3 Land - Market size and forecast 2024-2029
- Chart on Land - Market size and forecast 2024-2029 ($ million)
- Data Table on Land - Market size and forecast 2024-2029 ($ million)
- Chart on Land - Year-over-year growth 2024-2029 (%)
- Data Table on Land - Year-over-year growth 2024-2029 (%)
- 10.4 Air - Market size and forecast 2024-2029
- Chart on Air - Market size and forecast 2024-2029 ($ million)
- Data Table on Air - Market size and forecast 2024-2029 ($ million)
- Chart on Air - Year-over-year growth 2024-2029 (%)
- Data Table on Air - Year-over-year growth 2024-2029 (%)
- 10.5 Sea - Market size and forecast 2024-2029
- Chart on Sea - Market size and forecast 2024-2029 ($ million)
- Data Table on Sea - Market size and forecast 2024-2029 ($ million)
- Chart on Sea - Year-over-year growth 2024-2029 (%)
- Data Table on Sea - Year-over-year growth 2024-2029 (%)
- 10.6 Market opportunity by Type
- Market opportunity by Type ($ million)
- Data Table on Market opportunity by Type ($ million)
11 Market Segmentation by Service Type
- 11.1 Market segments
- Chart on Service Type - Market share 2024-2029 (%)
- Data Table on Service Type - Market share 2024-2029 (%)
- 11.2 Comparison by Service Type
- Chart on Comparison by Service Type
- Data Table on Comparison by Service Type
- 11.3 First-party logistics - Market size and forecast 2024-2029
- Chart on First-party logistics - Market size and forecast 2024-2029 ($ million)
- Data Table on First-party logistics - Market size and forecast 2024-2029 ($ million)
- Chart on First-party logistics - Year-over-year growth 2024-2029 (%)
- Data Table on First-party logistics - Year-over-year growth 2024-2029 (%)
- 11.4 Third-party logistics - Market size and forecast 2024-2029
- Chart on Third-party logistics - Market size and forecast 2024-2029 ($ million)
- Data Table on Third-party logistics - Market size and forecast 2024-2029 ($ million)
- Chart on Third-party logistics - Year-over-year growth 2024-2029 (%)
- Data Table on Third-party logistics - Year-over-year growth 2024-2029 (%)
- 11.5 Fourth-party logistics - Market size and forecast 2024-2029
- Chart on Fourth-party logistics - Market size and forecast 2024-2029 ($ million)
- Data Table on Fourth-party logistics - Market size and forecast 2024-2029 ($ million)
- Chart on Fourth-party logistics - Year-over-year growth 2024-2029 (%)
- Data Table on Fourth-party logistics - Year-over-year growth 2024-2029 (%)
- 11.6 Market opportunity by Service Type
- Market opportunity by Service Type ($ million)
- Data Table on Market opportunity by Service Type ($ million)
12 Market Segmentation by End-user
- 12.1 Market segments
- Chart on End-user - Market share 2024-2029 (%)
- Data Table on End-user - Market share 2024-2029 (%)
- 12.2 Comparison by End-user
- Chart on Comparison by End-user
- Data Table on Comparison by End-user
- 12.3 Government agencies - Market size and forecast 2024-2029
- Chart on Government agencies - Market size and forecast 2024-2029 ($ million)
- Data Table on Government agencies - Market size and forecast 2024-2029 ($ million)
- Chart on Government agencies - Year-over-year growth 2024-2029 (%)
- Data Table on Government agencies - Year-over-year growth 2024-2029 (%)
- 12.4 Non-governmental organizations - Market size and forecast 2024-2029
- Chart on Non-governmental organizations - Market size and forecast 2024-2029 ($ million)
- Data Table on Non-governmental organizations - Market size and forecast 2024-2029 ($ million)
- Chart on Non-governmental organizations - Year-over-year growth 2024-2029 (%)
- Data Table on Non-governmental organizations - Year-over-year growth 2024-2029 (%)
- 12.5 Corporate entities - Market size and forecast 2024-2029
- Chart on Corporate entities - Market size and forecast 2024-2029 ($ million)
- Data Table on Corporate entities - Market size and forecast 2024-2029 ($ million)
- Chart on Corporate entities - Year-over-year growth 2024-2029 (%)
- Data Table on Corporate entities - Year-over-year growth 2024-2029 (%)
- 12.6 Individuals - Market size and forecast 2024-2029
- Chart on Individuals - Market size and forecast 2024-2029 ($ million)
- Data Table on Individuals - Market size and forecast 2024-2029 ($ million)
- Chart on Individuals - Year-over-year growth 2024-2029 (%)
- Data Table on Individuals - Year-over-year growth 2024-2029 (%)
- 12.7 Market opportunity by End-user
- Market opportunity by End-user ($ million)
- Data Table on Market opportunity by End-user ($ million)
13 Customer Landscape
- 13.1 Customer landscape overview
- Analysis of price sensitivity, lifecycle, customer purchase basket, adoption rates, and purchase criteria
14 Geographic Landscape
- 14.1 Geographic segmentation
- Chart on Market share by geography 2024-2029 (%)
- Data Table on Market share by geography 2024-2029 (%)
- 14.2 Geographic comparison
- Chart on Geographic comparison
- Data Table on Geographic comparison
- 14.3 North America - Market size and forecast 2024-2029
- Chart on North America - Market size and forecast 2024-2029 ($ million)
- Data Table on North America - Market size and forecast 2024-2029 ($ million)
- Chart on North America - Year-over-year growth 2024-2029 (%)
- Data Table on North America - Year-over-year growth 2024-2029 (%)
- 14.4 Europe - Market size and forecast 2024-2029
- Chart on Europe - Market size and forecast 2024-2029 ($ million)
- Data Table on Europe - Market size and forecast 2024-2029 ($ million)
- Chart on Europe - Year-over-year growth 2024-2029 (%)
- Data Table on Europe - Year-over-year growth 2024-2029 (%)
- 14.5 APAC - Market size and forecast 2024-2029
- Chart on APAC - Market size and forecast 2024-2029 ($ million)
- Data Table on APAC - Market size and forecast 2024-2029 ($ million)
- Chart on APAC - Year-over-year growth 2024-2029 (%)
- Data Table on APAC - Year-over-year growth 2024-2029 (%)
- 14.6 South America - Market size and forecast 2024-2029
- Chart on South America - Market size and forecast 2024-2029 ($ million)
- Data Table on South America - Market size and forecast 2024-2029 ($ million)
- Chart on South America - Year-over-year growth 2024-2029 (%)
- Data Table on South America - Year-over-year growth 2024-2029 (%)
- 14.7 Middle East and Africa - Market size and forecast 2024-2029
- Chart on Middle East and Africa - Market size and forecast 2024-2029 ($ million)
- Data Table on Middle East and Africa - Market size and forecast 2024-2029 ($ million)
- Chart on Middle East and Africa - Year-over-year growth 2024-2029 (%)
- Data Table on Middle East and Africa - Year-over-year growth 2024-2029 (%)
- 14.8 US - Market size and forecast 2024-2029
- Chart on US - Market size and forecast 2024-2029 ($ million)
- Data Table on US - Market size and forecast 2024-2029 ($ million)
- Chart on US - Year-over-year growth 2024-2029 (%)
- Data Table on US - Year-over-year growth 2024-2029 (%)
- 14.9 Canada - Market size and forecast 2024-2029
- Chart on Canada - Market size and forecast 2024-2029 ($ million)
- Data Table on Canada - Market size and forecast 2024-2029 ($ million)
- Chart on Canada - Year-over-year growth 2024-2029 (%)
- Data Table on Canada - Year-over-year growth 2024-2029 (%)
- 14.10 China - Market size and forecast 2024-2029
- Chart on China - Market size and forecast 2024-2029 ($ million)
- Data Table on China - Market size and forecast 2024-2029 ($ million)
- Chart on China - Year-over-year growth 2024-2029 (%)
- Data Table on China - Year-over-year growth 2024-2029 (%)
- 14.11 UK - Market size and forecast 2024-2029
- Chart on UK - Market size and forecast 2024-2029 ($ million)
- Data Table on UK - Market size and forecast 2024-2029 ($ million)
- Chart on UK - Year-over-year growth 2024-2029 (%)
- Data Table on UK - Year-over-year growth 2024-2029 (%)
- 14.12 Japan - Market size and forecast 2024-2029
- Chart on Japan - Market size and forecast 2024-2029 ($ million)
- Data Table on Japan - Market size and forecast 2024-2029 ($ million)
- Chart on Japan - Year-over-year growth 2024-2029 (%)
- Data Table on Japan - Year-over-year growth 2024-2029 (%)
- 14.13 Germany - Market size and forecast 2024-2029
- Chart on Germany - Market size and forecast 2024-2029 ($ million)
- Data Table on Germany - Market size and forecast 2024-2029 ($ million)
- Chart on Germany - Year-over-year growth 2024-2029 (%)
- Data Table on Germany - Year-over-year growth 2024-2029 (%)
- 14.14 India - Market size and forecast 2024-2029
- Chart on India - Market size and forecast 2024-2029 ($ million)
- Data Table on India - Market size and forecast 2024-2029 ($ million)
- Chart on India - Year-over-year growth 2024-2029 (%)
- Data Table on India - Year-over-year growth 2024-2029 (%)
- 14.15 France - Market size and forecast 2024-2029
- Chart on France - Market size and forecast 2024-2029 ($ million)
- Data Table on France - Market size and forecast 2024-2029 ($ million)
- Chart on France - Year-over-year growth 2024-2029 (%)
- Data Table on France - Year-over-year growth 2024-2029 (%)
- 14.16 Italy - Market size and forecast 2024-2029
- Chart on Italy - Market size and forecast 2024-2029 ($ million)
- Data Table on Italy - Market size and forecast 2024-2029 ($ million)
- Chart on Italy - Year-over-year growth 2024-2029 (%)
- Data Table on Italy - Year-over-year growth 2024-2029 (%)
- 14.17 South Korea - Market size and forecast 2024-2029
- Chart on South Korea - Market size and forecast 2024-2029 ($ million)
- Data Table on South Korea - Market size and forecast 2024-2029 ($ million)
- Chart on South Korea - Year-over-year growth 2024-2029 (%)
- Data Table on South Korea - Year-over-year growth 2024-2029 (%)
- 14.18 Market opportunity by geography
- Market opportunity by geography ($ million)
- Data Tables on Market opportunity by geography ($ million)
15 Drivers, Challenges, and Opportunity/Restraints
- 15.3 Impact of drivers and challenges
- Impact of drivers and challenges in 2024 and 2029
- 15.4 Market opportunities/restraints
16 Competitive Landscape
- 16.2 Competitive Landscape
- Overview on criticality of inputs and factors of differentiation
- 16.3 Landscape disruption
- Overview on factors of disruption
- 16.4 Industry risks
- Impact of key risks on business
17 Competitive Analysis
- 17.2 Company ranking index
- 17.3 Market positioning of companies
- Matrix on companies position and classification
- 17.4 Agility Public Warehousing Co. K.S.C.P
- Agility Public Warehousing Co. K.S.C.P - Overview
- Agility Public Warehousing Co. K.S.C.P - Business segments
- Agility Public Warehousing Co. K.S.C.P - Key offerings
- Agility Public Warehousing Co. K.S.C.P - Segment focus
- SWOT
- 17.5 Air Charter Service Group Ltd.
- Air Charter Service Group Ltd. - Overview
- Air Charter Service Group Ltd. - Business segments
- Air Charter Service Group Ltd. - Key offerings
- Air Charter Service Group Ltd. - Segment focus
- SWOT
- 17.6 AP Moller Maersk AS
- AP Moller Maersk AS - Overview
- AP Moller Maersk AS - Business segments
- AP Moller Maersk AS - Key news
- AP Moller Maersk AS - Key offerings
- AP Moller Maersk AS - Segment focus
- SWOT
- 17.7 Blue Water Shipping AS
- Blue Water Shipping AS - Overview
- Blue Water Shipping AS - Product / Service
- Blue Water Shipping AS - Key offerings
- SWOT
- 17.8 CSafe Global
- CSafe Global - Overview
- CSafe Global - Product / Service
- CSafe Global - Key news
- CSafe Global - Key offerings
- SWOT
- 17.9 Deutsche Post AG
- Deutsche Post AG - Overview
- Deutsche Post AG - Business segments
- Deutsche Post AG - Key news
- Deutsche Post AG - Key offerings
- Deutsche Post AG - Segment focus
- SWOT
- 17.10 FreightCenter Inc.
- FreightCenter Inc. - Overview
- FreightCenter Inc. - Product / Service
- FreightCenter Inc. - Key offerings
- SWOT
- 17.11 JAS Worldwide Inc.
- JAS Worldwide Inc. - Overview
- JAS Worldwide Inc. - Product / Service
- JAS Worldwide Inc. - Key offerings
- SWOT
- 17.12 Kuehne Nagel Management AG
- Kuehne Nagel Management AG - Overview
- Kuehne Nagel Management AG - Business segments
- Kuehne Nagel Management AG - Key news
- Kuehne Nagel Management AG - Key offerings
- Kuehne Nagel Management AG - Segment focus
- SWOT
- 17.13 Lynden Inc.
- Lynden Inc. - Overview
- Lynden Inc. - Product / Service
- Lynden Inc. - Key offerings
- SWOT
- 17.14 Next Exit Logistics
- Next Exit Logistics - Overview
- Next Exit Logistics - Product / Service
- Next Exit Logistics - Key offerings
- SWOT
- 17.15 ODW Logistics
- ODW Logistics - Overview
- ODW Logistics - Product / Service
- ODW Logistics - Key offerings
- SWOT
- 17.16 SEKO Logistics
- SEKO Logistics - Overview
- SEKO Logistics - Product / Service
- SEKO Logistics - Key offerings
- SWOT
- 17.17 Scan Global Logistics
- Scan Global Logistics - Overview
- Scan Global Logistics - Product / Service
- Scan Global Logistics - Key offerings
- SWOT
- 17.18 United Parcel Service Inc.
- United Parcel Service Inc. - Overview
- United Parcel Service Inc. - Business segments
- United Parcel Service Inc. - Key news
- United Parcel Service Inc. - Key offerings
- United Parcel Service Inc. - Segment focus
- SWOT
18 Appendix
- 18.2 Inclusions and exclusions checklist
- Inclusions checklist
- Exclusions checklist
- 18.3 Currency conversion rates for US$
- Currency conversion rates for US$
- 18.4 Research methodology
- 18.7 Validation techniques employed for market sizing
- Validation techniques employed for market sizing
- 18.9 360 degree market analysis
- 360 degree market analysis
- 18.10 List of abbreviations