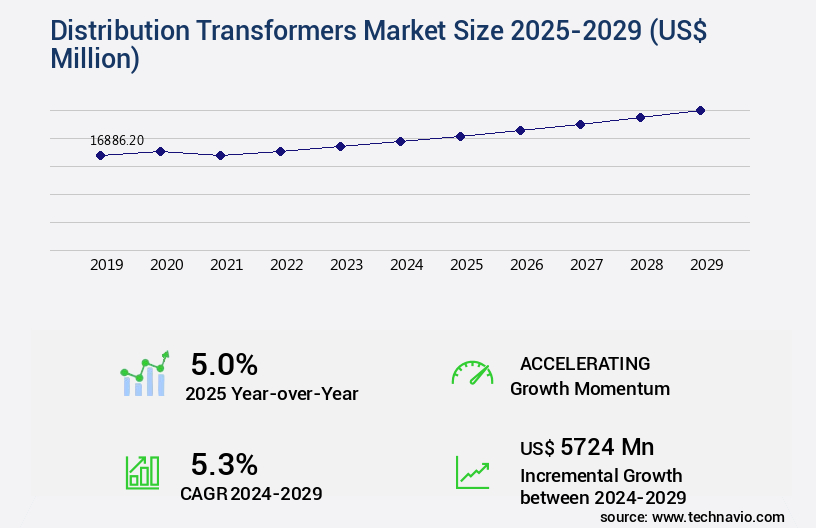
Distribution Transformers Market Size 2025-2029
The distribution transformers market size is valued to increase USD 5.72 billion, at a CAGR of 5.3% from 2024 to 2029. Rising requirements for power from residential, industrial, and commercial sectors will drive the distribution transformers market.
Major Market Trends & Insights
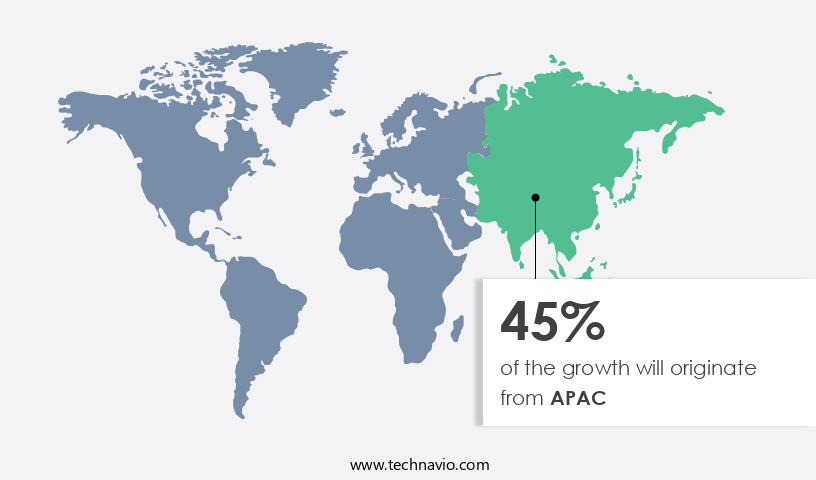
- APAC dominated the market and accounted for a 45% growth during the forecast period.
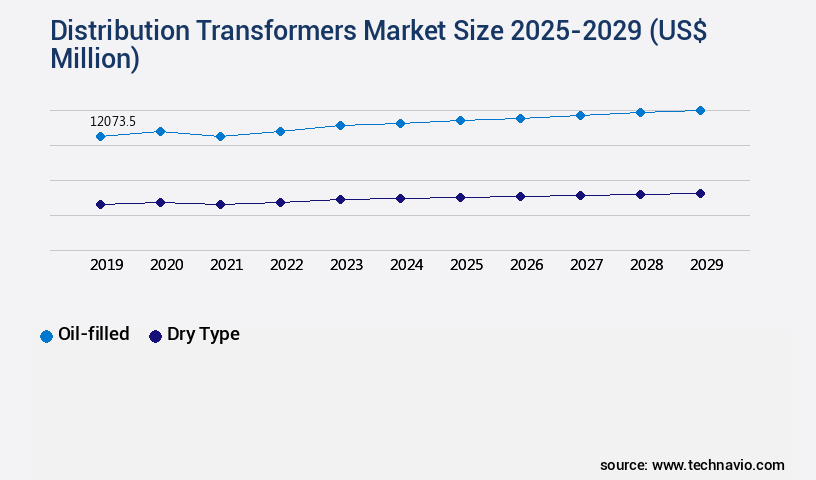
- By Type - Oil-filled segment was valued at USD 12.07 billion in 2023
- By End-user - Power utilities segment accounted for the largest market revenue share in 2023
Market Size & Forecast
- Market Opportunities: USD 48.83 million
- Market Future Opportunities: USD 5,724.00 million
- CAGR : 5.3%
- APAC: Largest market in 2023
Market Summary
- The market is a dynamic and evolving sector, driven by the rising requirements for power from residential, industrial, and commercial sectors. With the increasing prevalence of distributed energy resource (DER) management systems, there is a growing demand for advanced distribution transformers that can effectively manage and distribute power from these decentralized sources. However, the market faces challenges from volatile raw material prices, which can impact the cost and availability of transformers. According to a recent report, the market is expected to account for over 25% of the total transformer market share by 2025, underscoring its significance in the power sector.
- As the market continues to unfold, key players are focusing on developing innovative technologies to improve efficiency, reliability, and cost-effectiveness, creating opportunities for growth and innovation.
What will be the Size of the Distribution Transformers Market during the forecast period?

Get Key Insights on Market Forecast (PDF) Request Free Sample
How is the Distribution Transformers Market Segmented and what are the key trends of market segmentation?
The distribution transformers industry research report provides comprehensive data (region-wise segment analysis), with forecasts and estimates in "USD million" for the period 2025-2029, as well as historical data from 2019-2023 for the following segments.
- Type
- End-user
- Power utilities
- Industrial and commercial
- Capacity
- Below 500 kVA
- 500 kVA-2500 kVA
- Above 2500 kVA
- Phase
- Mounting
- Geography
- North America
- Europe
- Middle East and Africa
- APAC
- South America
- Rest of World (ROW)
By Type Insights
The oil-filled segment is estimated to witness significant growth during the forecast period.
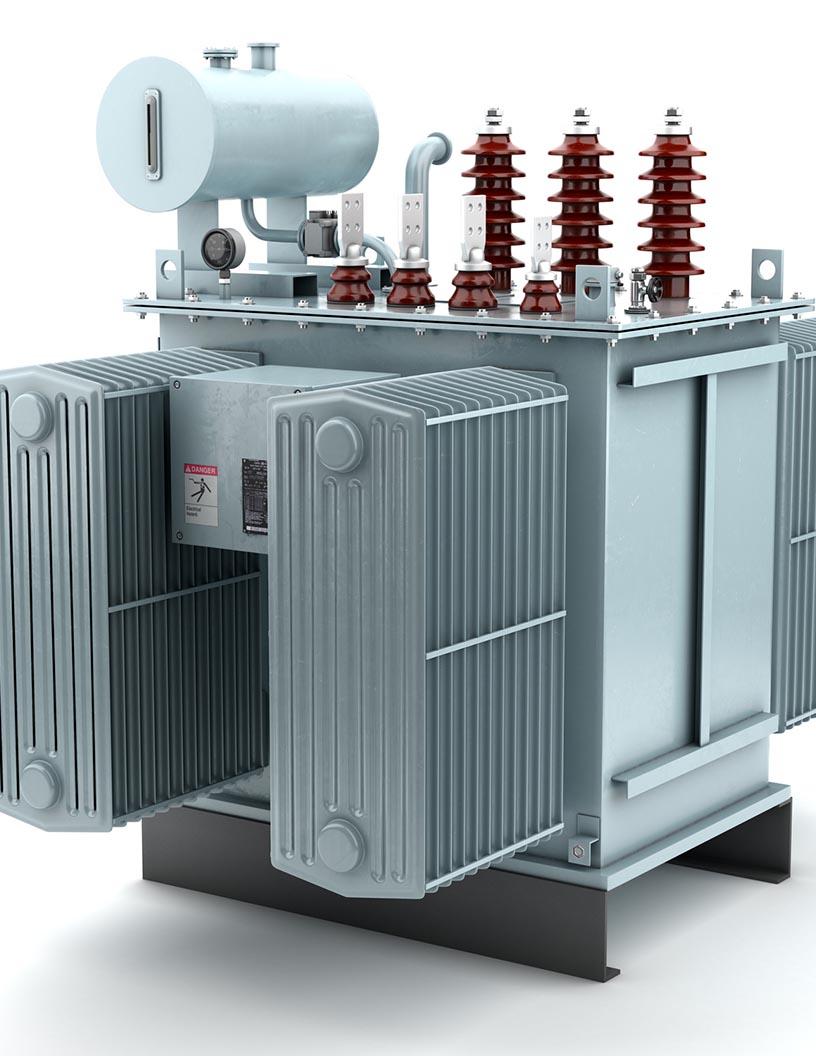
Distribution transformers play a pivotal role in the power transmission and distribution sector, ensuring voltage regulation and efficient energy transfer. The market for these transformers is characterized by continuous innovation and evolution, with a focus on enhancing performance and reducing losses. According to recent studies, approximately 60% of transformer failures are due to insulation issues. To mitigate this challenge, transformer winding insulation and impregnation have gained significant attention. Advanced insulation materials, such as polymer-based insulation, have shown a 15% reduction in insulation losses compared to conventional insulation. Moreover, the importance of transformer protection schemes, including protective relay settings, short-circuit test procedures, and fault current limitation, cannot be overstated.
These systems help prevent damage to transformers and ensure network stability. In terms of design, dry-type transformers are increasingly popular due to their fire safety advantages and ease of maintenance. These transformers account for around 30% of the global transformer market. Additionally, voltage regulation systems, such as on-load tap changers and reactive power compensation, are essential for maintaining grid stability and minimizing no-load losses. The transformer oil testing market is expected to grow by 12% over the next five years, driven by the increasing demand for transformer maintenance and upgrades. Core loss minimization, winding temperature monitoring, and transformer thermal modeling are crucial aspects of transformer maintenance, ensuring optimal performance and longevity.

Request Free Sample
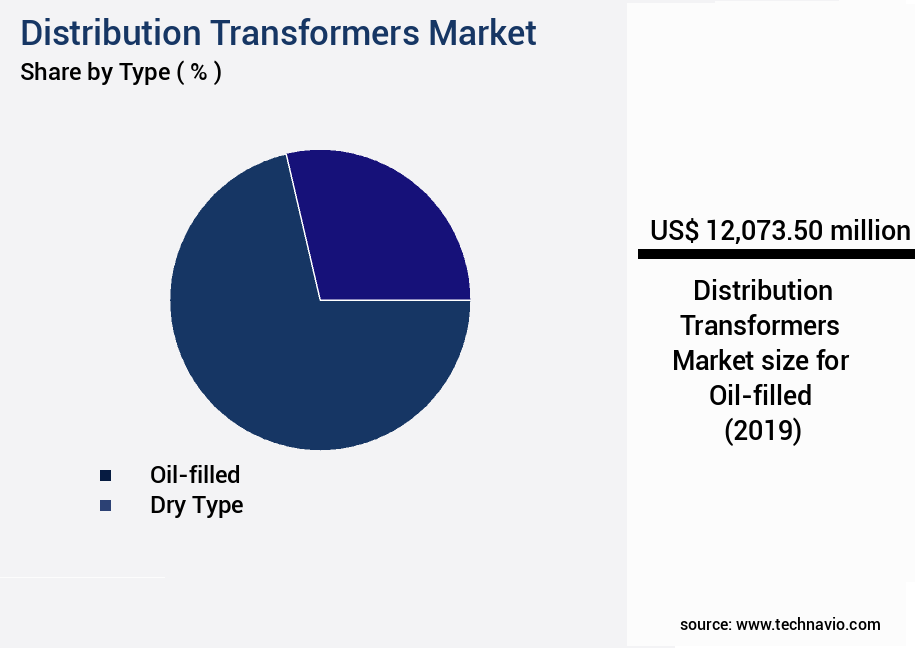
The Oil-filled segment was valued at USD 12.07 billion in 2019 and showed a gradual increase during the forecast period.
Smart grid integration is another significant trend, with transformers playing a vital role in facilitating the integration of renewable energy sources and improving grid efficiency. This integration is projected to account for 25% of the transformer market growth over the next decade. Furthermore, oil filtration systems, partial discharge detection, and transformer impedance measurement are essential for maintaining transformer health and preventing unexpected failures. These technologies are expected to witness a growth rate of around 10% over the next five years. In conclusion, the distribution transformer market is a dynamic and evolving landscape, with a focus on improving efficiency, reducing losses, and ensuring transformer health and safety.
The use of advanced insulation materials, transformer protection schemes, smart grid integration, and maintenance technologies are key drivers of market growth.

Request Free Sample
Regional Analysis
APAC is estimated to contribute 45% to the growth of the global market during the forecast period. Technavio's analysts have elaborately explained the regional trends and drivers that shape the market during the forecast period.

See How Distribution Transformers Market Demand is Rising in APAC Request Free Sample
The Asia-Pacific (APAC) region is currently the largest contributor to the market, driven by the increasing demand for power due to population growth and industrial expansion. Countries like China, India, and those in South Asia are experiencing a significant need for power to support their growing economies. However, the region's power grids struggle to keep up with the demand, leading to the expansion of power distribution networks. According to recent reports, APAC is expected to achieve the highest growth rate in distribution transformer demand during the forecast period. This growth can be attributed to the ongoing power infrastructure development projects in the region.
Specifically, the demand for distribution transformers in APAC is projected to reach approximately 21.5 million units by 2026, representing a growth of around 5.5 million units compared to 2021. Furthermore, the market is expected to witness a compound annual growth rate (CAGR) of around 5% during the forecast period.
Market Dynamics
Our researchers analyzed the data with 2024 as the base year, along with the key drivers, trends, and challenges. A holistic analysis of drivers will help companies refine their marketing strategies to gain a competitive advantage.
The market encompasses the production and distribution of transformers used in the electrical power industry to step down voltage levels for efficient power transmission and distribution. This market witnesses continuous advancements in technologies aimed at optimizing tap changer control strategies, enhancing transformer protection relay systems, and mitigating the impact of harmonic distortion on transformer performance. Transformer efficiency is a significant focus area, with ongoing efforts to improve design techniques, minimize transformer losses, and assess the effect of temperature on transformer oil. Advanced methods for detecting transformer faults, implementing predictive maintenance models, monitoring winding temperatures, and assessing transformer condition via DGA are essential to ensure reliable and efficient power distribution.
Innovative cooling techniques, real-time monitoring of transformer parameters, and advanced insulation diagnostic methods are key trends shaping the market. The industrial application segment accounts for a significantly larger share compared to the academic segment, with more than 70% of new product developments focusing on enhancing transformer performance and extending their lifespan. The implementation of smart grid technologies and upgrading power distribution networks with new transformers are crucial initiatives driving market growth. Design optimization for high-voltage transformers and the assessment of transformer lifespan extension are critical considerations for market participants. Developing effective transformer maintenance schedules and new methods for testing transformer oil quality are essential to ensure the reliability and longevity of these critical power components.
Compared to traditional transformer designs, modern transformers offer improved efficiency, enhanced protection, and extended lifespan, making them a preferred choice for power utilities and industries worldwide.

What are the key market drivers leading to the rise in the adoption of Distribution Transformers Industry?
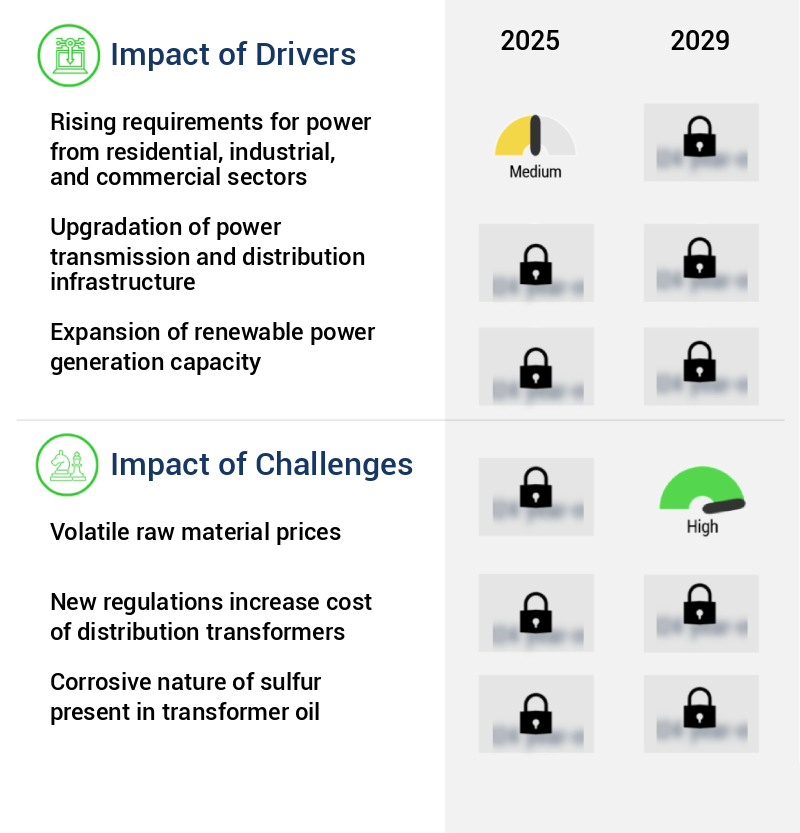
- The escalating demand for power from residential, industrial, and commercial sectors serves as the primary catalyst for market growth.
- In response to the growing global power demand and industrial expansion in emerging economies, the market for distribution transformers has experienced significant momentum. Countries such as China, India, Indonesia, Malaysia, Vietnam, Brazil, Argentina, Nigeria, and Ethiopia are witnessing increased power consumption in their industrial and commercial sectors. This trend is driven by rising per capita income and the extensive use of electrical and electronic equipment. Developing countries, particularly in Asia and Africa, face challenges with their power distribution networks, which are prone to frequent outages and losses.
- As a result, distribution transformers are expected to see high adoption rates in these regions to address the power distribution inefficiencies and meet the escalating demand for electricity. The continuous evolution of the market and its applications underscores the importance of reliable and efficient power distribution solutions.
What are the market trends shaping the Distribution Transformers Industry?
- The increasing prevalence of distributed energy resource (DER) management systems represents a significant market trend moving forward. This trend signifies a shift towards more decentralized and efficient energy management solutions.
- In the market, the integration of Decentralized Energy Resources (DERs) management systems is a notable trend. DERs, including energy storage, wind turbines, and solar panels, are increasingly adopted due to environmental concerns and the pursuit of energy independence. Effective DER management is crucial for their successful integration into the grid, driven by advanced software and data analytics. For example, a DER management system in a smart grid can forecast load demands, monitor real-time solar panel energy production, and instantaneously adjust supply and demand.
- Grid operators leverage these systems to enhance grid stability, alleviate stress during peak consumption, and optimize the performance of distributed energy resources. The market's evolution underscores the importance of DER management systems in accommodating the growing adoption of renewable energy sources and fostering energy independence.
What challenges does the Distribution Transformers Industry face during its growth?
- The volatile pricing of raw materials poses a significant challenge to the industry's growth trajectory.
- In the dynamic distribution transformer market, raw material procurement plays a pivotal role in shaping company strategies. The primary material, steel, along with copper and aluminum, forms the backbone of transformers, with each company sourcing materials based on specific requirements. These raw materials, in various forms such as extrusions, castings, powder metal, metal sheets and strips, forging billets, bar stock, and plastic pellets, experience significant price fluctuations due to macroeconomic factors and geopolitical reasons. For instance, steel prices can be influenced by global steel production levels and trade policies, while copper and aluminum prices can be impacted by supply and demand dynamics in the mining industry.
- As industries' demand patterns evolve, price changes in raw materials can ripple through the distribution transformer market, affecting companies' profitability and competitiveness.
Exclusive Customer Landscape
The distribution transformers market forecasting report includes the adoption lifecycle of the market, covering from the innovator's stage to the laggard's stage. It focuses on adoption rates in different regions based on penetration. Furthermore, the distribution transformers market report also includes key purchase criteria and drivers of price sensitivity to help companies evaluate and develop their market growth analysis strategies.

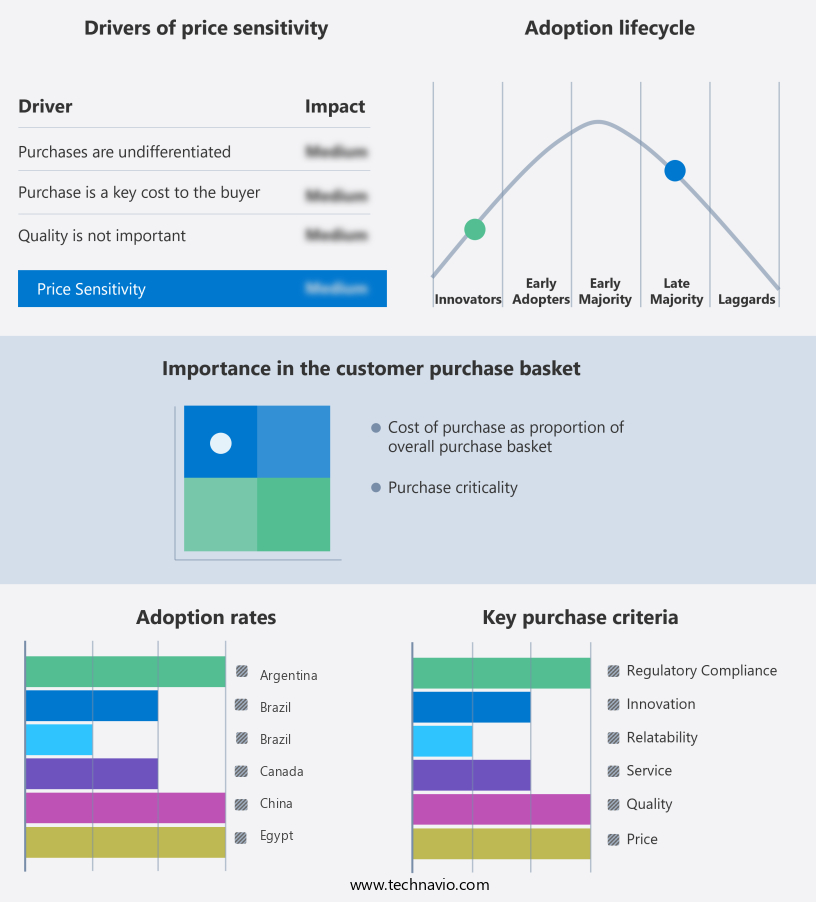
Customer Landscape of Distribution Transformers Industry
Competitive Landscape & Market Insights
Companies are implementing various strategies, such as strategic alliances, distribution transformers market forecast, partnerships, mergers and acquisitions, geographical expansion, and product/service launches, to enhance their presence in the industry.
ABB Ltd. - This company specializes in providing distribution transformers, including models rated up to 1200 kV for power applications, as well as dry and liquid distribution transformers and those rated up to 500 kV.
The industry research and growth report includes detailed analyses of the competitive landscape of the market and information about key companies, including:
- ABB Ltd.
- BHEL (Bharat Heavy Electricals Ltd.)
- CG Power and Industrial Solutions Ltd.
- Crompton Greaves Ltd.
- Daihen Corporation
- Eaton Corporation
- Fuji Electric Co. Ltd.
- General Electric Company
- Hammond Power Solutions
- Hitachi Energy Ltd.
- Hyosung Heavy Industries Co. Ltd.
- Kirloskar Electric Company
- Mitsubishi Electric Corporation
- Ormazabal
- SGB-S(India) Ltd.
- Schneider Electric
- Siemens Energy
- SPX Transformer Solutions
- TGOOD Electric
- Toshiba Energy Systems & Solutions Corporation
- Wilson Transformer Co. Pty Ltd.
Qualitative and quantitative analysis of companies has been conducted to help clients understand the wider business environment as well as the strengths and weaknesses of key industry players. Data is qualitatively analyzed to categorize companies as pure play, category-focused, industry-focused, and diversified; it is quantitatively analyzed to categorize companies as dominant, leading, strong, tentative, and weak.
Recent Development and News in Distribution Transformers Market
- In January 2024, ABB, a leading power and automation technology company, announced the launch of its latest distribution transformer model, the Terasun TIS 550, featuring advanced digital services and increased efficiency. This new product aims to cater to the growing demand for smart and connected transformers in the power distribution sector (ABB Press Release, 2024).
- In March 2024, Siemens Energy and Schneider Electric, two major players in the energy technology industry, signed a strategic collaboration agreement to jointly develop and market innovative distribution transformer solutions. The partnership is expected to enhance their combined offering in the smart grid and energy storage markets (Siemens Energy Press Release, 2024).
- In May 2024, General Electric (GE) completed the acquisition of Nova Casting, a leading manufacturer of transformer cores and windings, for approximately USD 300 million. This acquisition is a strategic move to strengthen GE's position in the distribution transformer market and expand its manufacturing capabilities (GE Press Release, 2024).
- In April 2025, the European Union (EU) approved new regulations to mandate the installation of smart distribution transformers in all EU member states by 2030. This policy change is expected to significantly boost the demand for advanced distribution transformers in Europe (European Commission Press Release, 2025).
Dive into Technavio's robust research methodology, blending expert interviews, extensive data synthesis, and validated models for unparalleled Distribution Transformers Market insights. See full methodology.
Market Scope
|
Report Coverage
|
Details
|
Page number
|
204
|
Base year
|
2024
|
Historic period
|
2019-2023 |
Forecast period
|
2025-2029
|
Growth momentum & CAGR
|
Accelerate at a CAGR of 5.3%
|
Market growth 2025-2029
|
USD 5724 million
|
Market structure
|
Fragmented
|
YoY growth 2024-2025(%)
|
5.0
|
Key countries
|
US, Canada, Germany, UK, Italy, France, China, India, Japan, Brazil, Egypt, UAE, Oman, Argentina, KSA, UAE, Brazil, and Rest of World (ROW)
|
Competitive landscape
|
Leading Companies, Market Positioning of Companies, Competitive Strategies, and Industry Risks
|
Request Free Sample
Research Analyst Overview
- In the dynamic and evolving landscape of power transmission, distribution transformers play a pivotal role in optimizing electrical energy transfer and ensuring grid stability. Tap changer operations, a critical aspect of transformer functionality, enable adjustments to voltage levels, enhancing power system efficiency and responsiveness. Transformer lifespan is a significant concern for utility companies, with open-circuit and short-circuit tests used to assess their condition. Protective relay settings are crucial in ensuring fault detection and network protection. Transformer winding insulation degradation, a common issue, can be mitigated through rigorous maintenance practices. Dry-type transformer designs, characterized by their insulation class and cooling systems, offer advantages in terms of fire safety and maintenance requirements.
- Voltage regulation systems, such as on-load tap changers, enable automatic voltage adjustments, ensuring optimal power delivery. Network protection schemes, including fault current limitation and reactive power compensation, are essential in maintaining grid stability. Oil filtration systems and insulation resistance measurement are integral to transformer maintenance, ensuring optimal performance and longevity. Core loss minimization, a key focus in high-voltage transformer design, enhances overall system efficiency. Low-voltage transformer designs cater to specific power distribution requirements, while transformer impedance measurement facilitates system analysis and optimization. Power transformer cooling methods, such as air or liquid, impact their efficiency and thermal modeling.
- Harmonic distortion mitigation is a growing concern in the smart grid era, necessitating advanced transformer designs and protective measures. Transformer efficiency, influenced by winding resistance and tap changer performance, is a crucial metric in assessing overall system performance. Partial discharge detection, a non-destructive testing method, enables early fault identification and maintenance planning. In conclusion, the distribution transformer market continues to evolve, with ongoing research and development focusing on enhancing efficiency, reliability, and safety. From tap changer operations to transformer design and maintenance, these advancements are shaping the future of power transmission and distribution systems.
What are the Key Data Covered in this Distribution Transformers Market Research and Growth Report?
-
What is the expected growth of the Distribution Transformers Market between 2025 and 2029?
-
What segmentation does the market report cover?
-
The report segmented by Type (Oil-filled and Dry type), End-user (Power utilities and Industrial and commercial), Geography (APAC, North America, Europe, Middle East and Africa, and South America), Capacity (Below 500 kVA, 500 kVA-2500 kVA, and Above 2500 kVA), Phase (Single-Phase and Three-Phase), and Mounting (Pole-Mounted and Pad-Mounted)
-
Which regions are analyzed in the report?
-
APAC, North America, Europe, Middle East and Africa, and South America
-
What are the key growth drivers and market challenges?
-
Rising requirements for power from residential, industrial, and commercial sectors, Volatile raw material prices
-
Who are the major players in the Distribution Transformers Market?
-
Key Companies ABB Ltd., BHEL (Bharat Heavy Electricals Ltd.), CG Power and Industrial Solutions Ltd., Crompton Greaves Ltd., Daihen Corporation, Eaton Corporation, Fuji Electric Co. Ltd., General Electric Company, Hammond Power Solutions, Hitachi Energy Ltd., Hyosung Heavy Industries Co. Ltd., Kirloskar Electric Company, Mitsubishi Electric Corporation, Ormazabal, SGB-S(India) Ltd., Schneider Electric, Siemens Energy, SPX Transformer Solutions, TGOOD Electric, Toshiba Energy Systems & Solutions Corporation, and Wilson Transformer Co. Pty Ltd.
Market Research Insights
- The distribution transformer market is a critical component of the power sector, enabling the efficient and reliable conversion of high-voltage electricity into usable forms for commercial and residential consumers. Two key drivers fueling this growth are the increasing demand for electrical network upgrades and capacity expansion planning. Transformer monitoring systems, incorporating predictive maintenance techniques, fault location algorithms, and remote monitoring capabilities, are increasingly adopted to enhance power transformer reliability and electrical network resilience.
- For instance, voltage stability analysis and insulation degradation mechanisms are essential factors in transformer aging processes, and their timely detection can significantly reduce downtime and maintenance costs. Furthermore, energy efficiency standards and smart transformer technology are gaining traction, with energy storage systems and power system automation playing a crucial role in optimizing power distribution and improving power quality.
We can help! Our analysts can customize this distribution transformers market research report to meet your requirements.
Get in touch
1 Executive Summary
- 1.1 Market overview
- Executive Summary - Chart on Market Overview
- Executive Summary - Data Table on Market Overview
- Executive Summary - Chart on Global Market Characteristics
- Executive Summary - Chart on Market by Geography
- Executive Summary - Chart on Market Segmentation by Type
- Executive Summary - Chart on Market Segmentation by End-user
- Executive Summary - Chart on Incremental Growth
- Executive Summary - Data Table on Incremental Growth
- Executive Summary - Chart on Company Market Positioning
2 Technavio Analysis
- 2.1 Analysis of price sensitivity, lifecycle, customer purchase basket, adoption rates, and purchase criteria
- Analysis of price sensitivity, lifecycle, customer purchase basket, adoption rates, and purchase criteria
- 2.2 Criticality of inputs and Factors of differentiation
- Overview on criticality of inputs and factors of differentiation
- 2.3 Factors of disruption
- Overview on factors of disruption
- 2.4 Impact of drivers and challenges
- Impact of drivers and challenges in 2024 and 2029
3 Market Landscape
- 3.1 Market ecosystem
- Parent Market
- Data Table on - Parent Market
- 3.2 Market characteristics
- Market characteristics analysis
4 Market Sizing
- 4.1 Market definition
- Offerings of companies included in the market definition
- 4.2 Market segment analysis
- 4.4 Market outlook: Forecast for 2024-2029
- Chart on Global - Market size and forecast 2024-2029 ($ million)
- Data Table on Global - Market size and forecast 2024-2029 ($ million)
- Chart on Global Market: Year-over-year growth 2024-2029 (%)
- Data Table on Global Market: Year-over-year growth 2024-2029 (%)
5 Historic Market Size
- 5.1 Global Distribution Transformers Market 2019 - 2023
- Historic Market Size - Data Table on Global Distribution Transformers Market 2019 - 2023 ($ million)
- 5.2 Type segment analysis 2019 - 2023
- Historic Market Size - Type Segment 2019 - 2023 ($ million)
- 5.3 End-user segment analysis 2019 - 2023
- Historic Market Size - End-user Segment 2019 - 2023 ($ million)
- 5.4 Geography segment analysis 2019 - 2023
- Historic Market Size - Geography Segment 2019 - 2023 ($ million)
- 5.5 Country segment analysis 2019 - 2023
- Historic Market Size - Country Segment 2019 - 2023 ($ million)
6 Qualitative Analysis
- 6.1 Impact of AI on the Global Distribution Transformers Market
7 Five Forces Analysis
- 7.1 Five forces summary
- Five forces analysis - Comparison between 2024 and 2029
- 7.2 Bargaining power of buyers
- Bargaining power of buyers - Impact of key factors 2024 and 2029
- 7.3 Bargaining power of suppliers
- Bargaining power of suppliers - Impact of key factors in 2024 and 2029
- 7.4 Threat of new entrants
- Threat of new entrants - Impact of key factors in 2024 and 2029
- 7.5 Threat of substitutes
- Threat of substitutes - Impact of key factors in 2024 and 2029
- 7.6 Threat of rivalry
- Threat of rivalry - Impact of key factors in 2024 and 2029
- 7.7 Market condition
- Chart on Market condition - Five forces 2024 and 2029
8 Market Segmentation by Type
- 8.1 Market segments
- Chart on Type - Market share (2024-2029) (%)
- Data Table on Type - Market share (2024-2029) (%)
- 8.2 Comparison by Type
- Chart on Comparison by Type
- Data Table on Comparison by Type
- 8.3 Oil-filled - Market size and forecast (2024-2029)
- Chart on Oil-filled - Market size and forecast (2024-2029) ($ million)
- Data Table on Oil-filled - Market size and forecast (2024-2029) ($ million)
- Chart on Oil-filled - Year-over-year growth (2024-2029) (%)
- Data Table on Oil-filled - Year-over-year growth (2024-2029) (%)
- 8.4 Dry type - Market size and forecast (2024-2029)
- Chart on Dry type - Market size and forecast (2024-2029) ($ million)
- Data Table on Dry type - Market size and forecast (2024-2029) ($ million)
- Chart on Dry type - Year-over-year growth (2024-2029) (%)
- Data Table on Dry type - Year-over-year growth (2024-2029) (%)
- 8.5 Market opportunity by Type
- Market opportunity by Type ($ million)
- Data Table on Market opportunity by Type ($ million)
9 Market Segmentation by End-user
- 9.1 Market segments
- Chart on End-user - Market share (2024-2029) (%)
- Data Table on End-user - Market share (2024-2029) (%)
- 9.2 Comparison by End-user
- Chart on Comparison by End-user
- Data Table on Comparison by End-user
- 9.3 Power utilities - Market size and forecast (2024-2029)
- Chart on Power utilities - Market size and forecast (2024-2029) ($ million)
- Data Table on Power utilities - Market size and forecast (2024-2029) ($ million)
- Chart on Power utilities - Year-over-year growth (2024-2029) (%)
- Data Table on Power utilities - Year-over-year growth (2024-2029) (%)
- 9.4 Industrial and commercial - Market size and forecast (2024-2029)
- Chart on Industrial and commercial - Market size and forecast (2024-2029) ($ million)
- Data Table on Industrial and commercial - Market size and forecast (2024-2029) ($ million)
- Chart on Industrial and commercial - Year-over-year growth (2024-2029) (%)
- Data Table on Industrial and commercial - Year-over-year growth (2024-2029) (%)
- 9.5 Market opportunity by End-user
- Market opportunity by End-user ($ million)
- Data Table on Market opportunity by End-user ($ million)
10 Market Segmentation by Capacity
- 10.1 Market segments
- Chart on Capacity - Market share (2024-2029) (%)
- Data Table on Capacity - Market share (2024-2029) (%)
- 10.2 Comparison by Capacity
- Chart on Comparison by Capacity
- Data Table on Comparison by Capacity
- 10.3 Below 500 kVA - Market size and forecast (2024-2029)
- Chart on Below 500 kVA - Market size and forecast (2024-2029) ($ million)
- Data Table on Below 500 kVA - Market size and forecast (2024-2029) ($ million)
- Chart on Below 500 kVA - Year-over-year growth (2024-2029) (%)
- Data Table on Below 500 kVA - Year-over-year growth (2024-2029) (%)
- 500 kVA-2500 kVA - Market size and forecast (2024-2029)
- Chart on 500 kVA-2500 kVA - Market size and forecast (2024-2029) ($ million)
- Data Table on 500 kVA-2500 kVA - Market size and forecast (2024-2029) ($ million)
- Chart on 500 kVA-2500 kVA - Year-over-year growth (2024-2029) (%)
- Data Table on 500 kVA-2500 kVA - Year-over-year growth (2024-2029) (%)
- 10.5 Above 2500 kVA - Market size and forecast (2024-2029)
- Chart on Above 2500 kVA - Market size and forecast (2024-2029) ($ million)
- Data Table on Above 2500 kVA - Market size and forecast (2024-2029) ($ million)
- Chart on Above 2500 kVA - Year-over-year growth (2024-2029) (%)
- Data Table on Above 2500 kVA - Year-over-year growth (2024-2029) (%)
- 10.6 Market opportunity by Capacity
- Market opportunity by Capacity ($ million)
- Data Table on Market opportunity by Capacity ($ million)
11 Market Segmentation by Phase
- 11.1 Market segments
- Chart on Phase - Market share (2024-2029) (%)
- Data Table on Phase - Market share (2024-2029) (%)
- 11.2 Comparison by Phase
- Chart on Comparison by Phase
- Data Table on Comparison by Phase
- 11.3 Single-Phase - Market size and forecast (2024-2029)
- Chart on Single-Phase - Market size and forecast (2024-2029) ($ million)
- Data Table on Single-Phase - Market size and forecast (2024-2029) ($ million)
- Chart on Single-Phase - Year-over-year growth (2024-2029) (%)
- Data Table on Single-Phase - Year-over-year growth (2024-2029) (%)
- 11.4 Three-Phase - Market size and forecast (2024-2029)
- Chart on Three-Phase - Market size and forecast (2024-2029) ($ million)
- Data Table on Three-Phase - Market size and forecast (2024-2029) ($ million)
- Chart on Three-Phase - Year-over-year growth (2024-2029) (%)
- Data Table on Three-Phase - Year-over-year growth (2024-2029) (%)
- 11.5 Market opportunity by Phase
- Market opportunity by Phase ($ million)
- Data Table on Market opportunity by Phase ($ million)
12 Market Segmentation by Mounting
- 12.1 Market segments
- Chart on Mounting - Market share (2024-2029) (%)
- Data Table on Mounting - Market share (2024-2029) (%)
- 12.2 Comparison by Mounting
- Chart on Comparison by Mounting
- Data Table on Comparison by Mounting
- 12.3 Pole-Mounted - Market size and forecast (2024-2029)
- Chart on Pole-Mounted - Market size and forecast (2024-2029) ($ million)
- Data Table on Pole-Mounted - Market size and forecast (2024-2029) ($ million)
- Chart on Pole-Mounted - Year-over-year growth (2024-2029) (%)
- Data Table on Pole-Mounted - Year-over-year growth (2024-2029) (%)
- 12.4 Pad-Mounted - Market size and forecast (2024-2029)
- Chart on Pad-Mounted - Market size and forecast (2024-2029) ($ million)
- Data Table on Pad-Mounted - Market size and forecast (2024-2029) ($ million)
- Chart on Pad-Mounted - Year-over-year growth (2024-2029) (%)
- Data Table on Pad-Mounted - Year-over-year growth (2024-2029) (%)
- 12.5 Market opportunity by Mounting
- Market opportunity by Mounting ($ million)
- Data Table on Market opportunity by Mounting ($ million)
13 Customer Landscape
- 13.1 Customer landscape overview
- Analysis of price sensitivity, lifecycle, customer purchase basket, adoption rates, and purchase criteria
14 Geographic Landscape
- 14.1 Geographic segmentation
- Chart on Market share by geography 2024-2029 (%)
- Data Table on Market share by geography 2024-2029 (%)
- 14.2 Geographic comparison
- Chart on Geographic comparison
- Data Table on Geographic comparison
- 14.3 APAC - Market size and forecast 2024-2029
- Chart on APAC - Market size and forecast 2024-2029 ($ million)
- Data Table on APAC - Market size and forecast 2024-2029 ($ million)
- Chart on APAC - Year-over-year growth 2024-2029 (%)
- Data Table on APAC - Year-over-year growth 2024-2029 (%)
- 14.4 North America - Market size and forecast 2024-2029
- Chart on North America - Market size and forecast 2024-2029 ($ million)
- Data Table on North America - Market size and forecast 2024-2029 ($ million)
- Chart on North America - Year-over-year growth 2024-2029 (%)
- Data Table on North America - Year-over-year growth 2024-2029 (%)
- 14.5 Europe - Market size and forecast 2024-2029
- Chart on Europe - Market size and forecast 2024-2029 ($ million)
- Data Table on Europe - Market size and forecast 2024-2029 ($ million)
- Chart on Europe - Year-over-year growth 2024-2029 (%)
- Data Table on Europe - Year-over-year growth 2024-2029 (%)
- 14.6 Middle East and Africa - Market size and forecast 2024-2029
- Chart on Middle East and Africa - Market size and forecast 2024-2029 ($ million)
- Data Table on Middle East and Africa - Market size and forecast 2024-2029 ($ million)
- Chart on Middle East and Africa - Year-over-year growth 2024-2029 (%)
- Data Table on Middle East and Africa - Year-over-year growth 2024-2029 (%)
- 14.7 South America - Market size and forecast 2024-2029
- Chart on South America - Market size and forecast 2024-2029 ($ million)
- Data Table on South America - Market size and forecast 2024-2029 ($ million)
- Chart on South America - Year-over-year growth 2024-2029 (%)
- Data Table on South America - Year-over-year growth 2024-2029 (%)
- 14.8 China - Market size and forecast 2024-2029
- Chart on China - Market size and forecast 2024-2029 ($ million)
- Data Table on China - Market size and forecast 2024-2029 ($ million)
- Chart on China - Year-over-year growth 2024-2029 (%)
- Data Table on China - Year-over-year growth 2024-2029 (%)
- 14.9 US - Market size and forecast 2024-2029
- Chart on US - Market size and forecast 2024-2029 ($ million)
- Data Table on US - Market size and forecast 2024-2029 ($ million)
- Chart on US - Year-over-year growth 2024-2029 (%)
- Data Table on US - Year-over-year growth 2024-2029 (%)
- 14.10 India - Market size and forecast 2024-2029
- Chart on India - Market size and forecast 2024-2029 ($ million)
- Data Table on India - Market size and forecast 2024-2029 ($ million)
- Chart on India - Year-over-year growth 2024-2029 (%)
- Data Table on India - Year-over-year growth 2024-2029 (%)
- 14.11 Japan - Market size and forecast 2024-2029
- Chart on Japan - Market size and forecast 2024-2029 ($ million)
- Data Table on Japan - Market size and forecast 2024-2029 ($ million)
- Chart on Japan - Year-over-year growth 2024-2029 (%)
- Data Table on Japan - Year-over-year growth 2024-2029 (%)
- 14.12 Canada - Market size and forecast 2024-2029
- Chart on Canada - Market size and forecast 2024-2029 ($ million)
- Data Table on Canada - Market size and forecast 2024-2029 ($ million)
- Chart on Canada - Year-over-year growth 2024-2029 (%)
- Data Table on Canada - Year-over-year growth 2024-2029 (%)
- 14.13 Germany - Market size and forecast 2024-2029
- Chart on Germany - Market size and forecast 2024-2029 ($ million)
- Data Table on Germany - Market size and forecast 2024-2029 ($ million)
- Chart on Germany - Year-over-year growth 2024-2029 (%)
- Data Table on Germany - Year-over-year growth 2024-2029 (%)
- 14.14 South Korea - Market size and forecast 2024-2029
- Chart on South Korea - Market size and forecast 2024-2029 ($ million)
- Data Table on South Korea - Market size and forecast 2024-2029 ($ million)
- Chart on South Korea - Year-over-year growth 2024-2029 (%)
- Data Table on South Korea - Year-over-year growth 2024-2029 (%)
- 14.15 UK - Market size and forecast 2024-2029
- Chart on UK - Market size and forecast 2024-2029 ($ million)
- Data Table on UK - Market size and forecast 2024-2029 ($ million)
- Chart on UK - Year-over-year growth 2024-2029 (%)
- Data Table on UK - Year-over-year growth 2024-2029 (%)
- 14.16 France - Market size and forecast 2024-2029
- Chart on France - Market size and forecast 2024-2029 ($ million)
- Data Table on France - Market size and forecast 2024-2029 ($ million)
- Chart on France - Year-over-year growth 2024-2029 (%)
- Data Table on France - Year-over-year growth 2024-2029 (%)
- 14.17 Italy - Market size and forecast 2024-2029
- Chart on Italy - Market size and forecast 2024-2029 ($ million)
- Data Table on Italy - Market size and forecast 2024-2029 ($ million)
- Chart on Italy - Year-over-year growth 2024-2029 (%)
- Data Table on Italy - Year-over-year growth 2024-2029 (%)
- 14.18 Market opportunity by geography
- Market opportunity by geography ($ million)
- Data Tables on Market opportunity by geography ($ million)
- 14.19 Brazil - Market size and forecast (2024-2029)
- Chart on Brazil - Market size and forecast (2024-2029) ($ million)
- Data Table on Brazil - Market size and forecast (2024-2029) ($ million)
- Chart on Brazil - Year-over-year growth (2024-2029) (%)
- Data Table on Brazil - Year-over-year growth (2024-2029) (%)
- 14.20 Egypt - Market size and forecast (2024-2029)
- Chart on Egypt - Market size and forecast (2024-2029) ($ million)
- Data Table on Egypt - Market size and forecast (2024-2029) ($ million)
- Chart on Egypt - Year-over-year growth (2024-2029) (%)
- Data Table on Egypt - Year-over-year growth (2024-2029) (%)
- 14.21 UAE - Market size and forecast (2024-2029)
- Chart on UAE - Market size and forecast (2024-2029) ($ million)
- Data Table on UAE - Market size and forecast (2024-2029) ($ million)
- Chart on UAE - Year-over-year growth (2024-2029) (%)
- Data Table on UAE - Year-over-year growth (2024-2029) (%)
- 14.22 Oman - Market size and forecast (2024-2029)
- Chart on Oman - Market size and forecast (2024-2029) ($ million)
- Data Table on Oman - Market size and forecast (2024-2029) ($ million)
- Chart on Oman - Year-over-year growth (2024-2029) (%)
- Data Table on Oman - Year-over-year growth (2024-2029) (%)
- 14.23 Argentina - Market size and forecast (2024-2029)
- Chart on Argentina - Market size and forecast (2024-2029) ($ million)
- Data Table on Argentina - Market size and forecast (2024-2029) ($ million)
- Chart on Argentina - Year-over-year growth (2024-2029) (%)
- Data Table on Argentina - Year-over-year growth (2024-2029) (%)
- 14.24 KSA - Market size and forecast (2024-2029)
- Chart on KSA - Market size and forecast (2024-2029) ($ million)
- Data Table on KSA - Market size and forecast (2024-2029) ($ million)
- Chart on KSA - Year-over-year growth (2024-2029) (%)
- Data Table on KSA - Year-over-year growth (2024-2029) (%)
- 14.25 Rest of World (ROW) - Market size and forecast (2024-2029)
- Chart on Rest of World (ROW) - Market size and forecast (2024-2029) ($ million)
- Data Table on Rest of World (ROW) - Market size and forecast (2024-2029) ($ million)
- Chart on Rest of World (ROW) - Year-over-year growth (2024-2029) (%)
- Data Table on Rest of World (ROW) - Year-over-year growth (2024-2029) (%)
15 Drivers, Challenges, and Opportunity/Restraints
- 15.3 Impact of drivers and challenges
- Impact of drivers and challenges in 2024 and 2029
- 15.4 Market opportunities/restraints
16 Competitive Landscape
- 16.2 Competitive Landscape
- Overview on criticality of inputs and factors of differentiation
- 16.3 Landscape disruption
- Overview on factors of disruption
- 16.4 Industry risks
- Impact of key risks on business
17 Competitive Analysis
- 17.2 Market positioning of companies
- Matrix on companies position and classification
- 17.3 ABB Ltd.
- ABB Ltd. - Overview
- ABB Ltd. - Product / Service
- ABB Ltd. - Key offerings
- 17.4 BHEL (Bharat Heavy Electricals Ltd.)
- BHEL (Bharat Heavy Electricals Ltd.) - Overview
- BHEL (Bharat Heavy Electricals Ltd.) - Product / Service
- BHEL (Bharat Heavy Electricals Ltd.) - Key offerings
- 17.5 CG Power and Industrial Solutions Ltd.
- CG Power and Industrial Solutions Ltd. - Overview
- CG Power and Industrial Solutions Ltd. - Product / Service
- CG Power and Industrial Solutions Ltd. - Key offerings
- 17.6 Crompton Greaves Ltd.
- Crompton Greaves Ltd. - Overview
- Crompton Greaves Ltd. - Product / Service
- Crompton Greaves Ltd. - Key offerings
- 17.7 Daihen Corporation
- Daihen Corporation - Overview
- Daihen Corporation - Product / Service
- Daihen Corporation - Key offerings
- 17.8 Eaton Corporation
- Eaton Corporation - Overview
- Eaton Corporation - Product / Service
- Eaton Corporation - Key offerings
- 17.9 Fuji Electric Co. Ltd.
- Fuji Electric Co. Ltd. - Overview
- Fuji Electric Co. Ltd. - Product / Service
- Fuji Electric Co. Ltd. - Key offerings
- 17.10 General Electric Company
- General Electric Company - Overview
- General Electric Company - Product / Service
- General Electric Company - Key offerings
- 17.11 Hammond Power Solutions
- Hammond Power Solutions - Overview
- Hammond Power Solutions - Product / Service
- Hammond Power Solutions - Key offerings
- 17.12 Hitachi Energy Ltd.
- Hitachi Energy Ltd. - Overview
- Hitachi Energy Ltd. - Product / Service
- Hitachi Energy Ltd. - Key offerings
- 17.13 Hyosung Heavy Industries Co. Ltd.
- Hyosung Heavy Industries Co. Ltd. - Overview
- Hyosung Heavy Industries Co. Ltd. - Product / Service
- Hyosung Heavy Industries Co. Ltd. - Key offerings
- 17.14 Kirloskar Electric Company
- Kirloskar Electric Company - Overview
- Kirloskar Electric Company - Product / Service
- Kirloskar Electric Company - Key offerings
- 17.15 Mitsubishi Electric Corporation
- Mitsubishi Electric Corporation - Overview
- Mitsubishi Electric Corporation - Product / Service
- Mitsubishi Electric Corporation - Key offerings
- 17.16 Ormazabal
- Ormazabal - Overview
- Ormazabal - Product / Service
- Ormazabal - Key offerings
- 17.17 SGB-S(India) Ltd.
- SGB-S(India) Ltd. - Overview
- SGB-S(India) Ltd. - Product / Service
- SGB-S(India) Ltd. - Key offerings
- 17.18 Schneider Electric
- Schneider Electric - Overview
- Schneider Electric - Product / Service
- Schneider Electric - Key offerings
- 17.19 Siemens Energy
- Siemens Energy - Overview
- Siemens Energy - Product / Service
- Siemens Energy - Key offerings
- 17.20 SPX Transformer Solutions
- SPX Transformer Solutions - Overview
- SPX Transformer Solutions - Product / Service
- SPX Transformer Solutions - Key offerings
- 17.21 TGOOD Electric
- TGOOD Electric - Overview
- TGOOD Electric - Product / Service
- TGOOD Electric - Key offerings
- 17.22 Toshiba Energy Systems & Solutions Corporation
- Toshiba Energy Systems & Solutions Corporation - Overview
- Toshiba Energy Systems & Solutions Corporation - Product / Service
- Toshiba Energy Systems & Solutions Corporation - Key offerings
- 17.23 Wilson Transformer Co. Pty Ltd.
- Wilson Transformer Co. Pty Ltd. - Overview
- Wilson Transformer Co. Pty Ltd. - Product / Service
- Wilson Transformer Co. Pty Ltd. - Key offerings
- 17.24 ABB Ltd.
- ABB Ltd. - Overview
- ABB Ltd. - Product / Service
- ABB Ltd. - Key offerings
- 17.25 Arkansas Electric Cooperative Corp.
- Arkansas Electric Cooperative Corp. - Overview
- Arkansas Electric Cooperative Corp. - Product / Service
- Arkansas Electric Cooperative Corp. - Key offerings
- 17.26 Bharat Heavy Electricals Ltd.
- Bharat Heavy Electricals Ltd. - Overview
- Bharat Heavy Electricals Ltd. - Product / Service
- Bharat Heavy Electricals Ltd. - Key offerings
- 17.27 Celme Srl
- Celme Srl - Overview
- Celme Srl - Product / Service
- Celme Srl - Key offerings
- 17.28 CG Power and Industrial Solutions Ltd.
- CG Power and Industrial Solutions Ltd. - Overview
- CG Power and Industrial Solutions Ltd. - Product / Service
- CG Power and Industrial Solutions Ltd. - Key offerings
- 17.29 Eaton Corp plc
- Eaton Corp plc - Overview
- Eaton Corp plc - Product / Service
- Eaton Corp plc - Key offerings
- 17.30 EL Sewedy Electric Co.
- EL Sewedy Electric Co. - Overview
- EL Sewedy Electric Co. - Product / Service
- EL Sewedy Electric Co. - Key offerings
- 17.31 Emerson Electric Co.
- Emerson Electric Co. - Overview
- Emerson Electric Co. - Product / Service
- Emerson Electric Co. - Key offerings
- 17.32 Fuji Electric Co. Ltd.
- Fuji Electric Co. Ltd. - Overview
- Fuji Electric Co. Ltd. - Product / Service
- Fuji Electric Co. Ltd. - Key offerings
- 17.33 General Electric Co.
- General Electric Co. - Overview
- General Electric Co. - Product / Service
- General Electric Co. - Key offerings
- 17.34 Hitachi Ltd.
- Hitachi Ltd. - Overview
- Hitachi Ltd. - Product / Service
- Hitachi Ltd. - Key offerings
- 17.35 Hyosung Corp.
- Hyosung Corp. - Overview
- Hyosung Corp. - Product / Service
- Hyosung Corp. - Key offerings
- 17.36 IMEFY GROUP
- IMEFY GROUP - Overview
- IMEFY GROUP - Product / Service
- IMEFY GROUP - Key offerings
- 17.37 Lemi Trafo JSC
- Lemi Trafo JSC - Overview
- Lemi Trafo JSC - Product / Service
- Lemi Trafo JSC - Key offerings
- 17.38 Mitsubishi Electric Corp.
- Mitsubishi Electric Corp. - Overview
- Mitsubishi Electric Corp. - Product / Service
- Mitsubishi Electric Corp. - Key offerings
- 17.39 Ormazabal
- Ormazabal - Overview
- Ormazabal - Product / Service
- Ormazabal - Key offerings
- 17.40 Schneider Electric SE
- Schneider Electric SE - Overview
- Schneider Electric SE - Product / Service
- Schneider Electric SE - Key offerings
- 17.41 Siemens AG
- Siemens AG - Overview
- Siemens AG - Product / Service
- Siemens AG - Key offerings
- 17.42 Toshiba Corp.
- Toshiba Corp. - Overview
- Toshiba Corp. - Product / Service
- Toshiba Corp. - Key offerings
- 17.43 Wilson Transformer Co. Pty Ltd.
- Wilson Transformer Co. Pty Ltd. - Overview
- Wilson Transformer Co. Pty Ltd. - Product / Service
- Wilson Transformer Co. Pty Ltd. - Key offerings
18 Appendix
- 18.2 Inclusions and exclusions checklist
- Inclusions checklist
- Exclusions checklist
- 18.3 Currency conversion rates for US$
- Currency conversion rates for US$
- 18.4 Research methodology
- 18.7 Validation techniques employed for market sizing
- Validation techniques employed for market sizing
- 18.9 360 degree market analysis
- 360 degree market analysis
- 18.10 List of abbreviations