
Oligonucleotide Synthesis Market Size 2026-2030
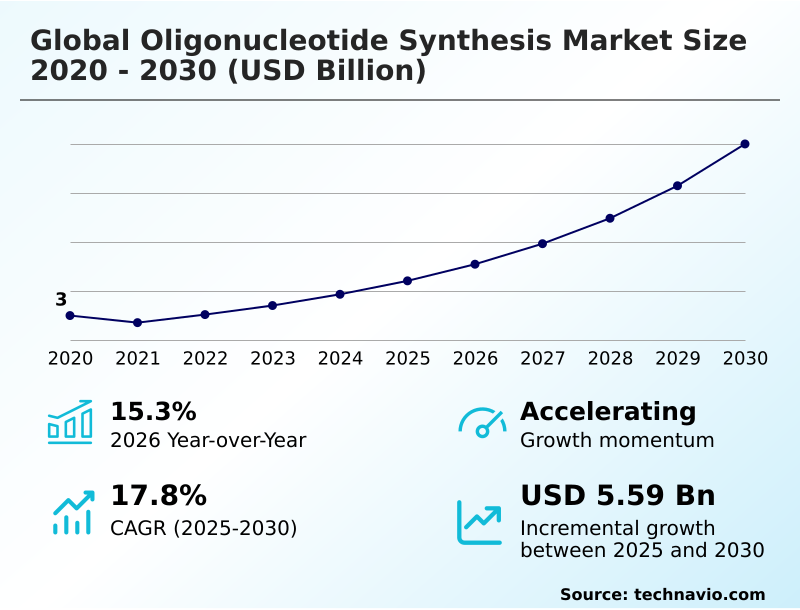
The Oligonucleotide Synthesis Market size was valued at USD 4.43 billion in 2025, growing at a CAGR of 17.8% during the forecast period 2026-2030.
Major Market Trends & Insights
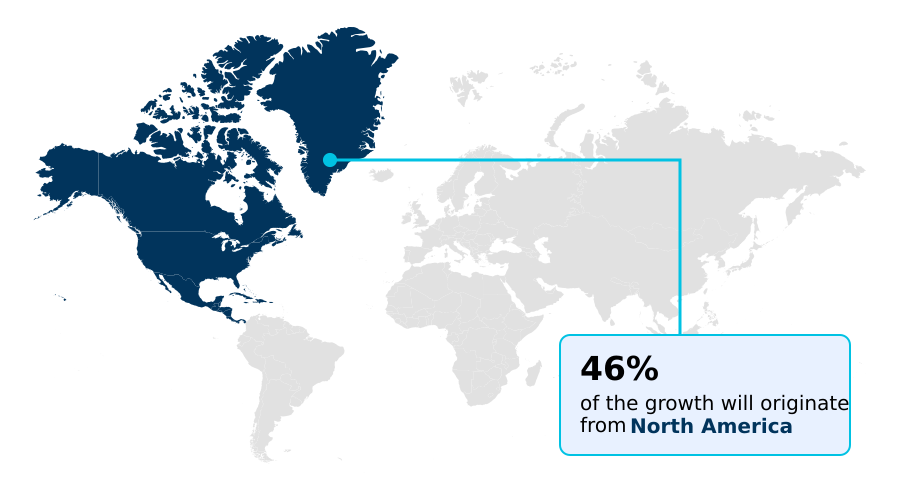
- North America dominated the market and accounted for a 46.1% growth during the forecast period.
- By Application - PCR primers segment was valued at USD 1.01 billion in 2024
- By End-user - Pharmaceutical and biotechnology companies segment accounted for the largest market revenue share in 2024
Market Size & Forecast
- Historic Market Opportunities 2020-2024: USD 7.01 billion
- Market Future Opportunities 2025-2030: USD 5.59 billion
- CAGR from 2025 to 2030 : 17.8%
Market Summary
- The oligonucleotide synthesis market is defined by rapid technological evolution, with year-over-year growth reaching 15.3% as applications expand. Demand is primarily driven by the escalating pipeline of nucleic acid therapeutics, which require large volumes of high-purity, GMP-compliant material.
- A key business scenario involves CDMOs navigating complex supply chains for specialized reagents like phosphoramidites, where a 5% price fluctuation can significantly impact the cost of goods for a large-scale therapeutic batch.
- While this therapeutic demand propels the market, growth is constrained by the significant challenge of high manufacturing costs and scalability limitations, particularly for longer or chemically modified sequences where production yields can decrease by up to 20% compared to shorter, standard sequences. Innovations in enzymatic synthesis and process automation are critical for mitigating these cost and scalability hurdles.
- The market's trajectory depends on balancing the high-value demand from precision medicine with the need for more cost-effective and scalable production technologies.
What will be the Size of the Oligonucleotide Synthesis Market during the forecast period?
Get Key Insights on Market Forecast (PDF) Request Free Sample
How is the Oligonucleotide Synthesis Market Segmented?
The oligonucleotide synthesis industry research report provides comprehensive data (region-wise segment analysis), with forecasts and analysis for the period 2026-2030, as well as historical data from 2020-2024 for the following segments.
- Application
- PCR primers
- PCR assays and panels
- DNA microarrays
- Fluorescence in situ hybridization
- Others
- End-user
- Pharmaceutical and biotechnology companies
- Research and academic institutes
- Diagnostic laboratories
- Hospitals
- Product
- Oligonucleotide products
- Reagents and consumables
- Synthesis equipment
- Geography
- North America
- US
- Canada
- Mexico
- Europe
- Germany
- UK
- France
- Asia
- Rest of World (ROW)
- North America
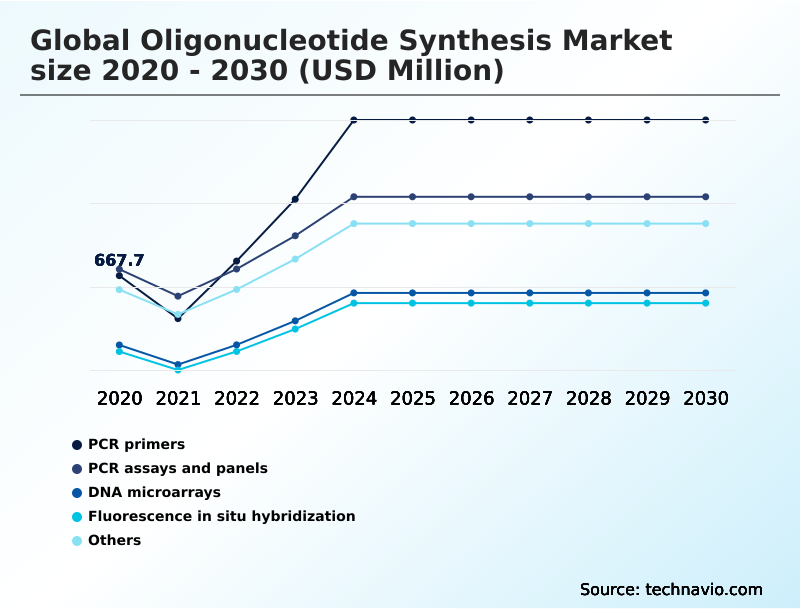
How is the Oligonucleotide Synthesis Market Segmented by Application?
The pcr primers segment is estimated to witness significant growth during the forecast period.
PCR primers are a foundational component, with demand growing 15.3% year-over-year, driven by the expansion of molecular diagnostics and genomic research.
These short, synthetic DNA fragments are essential for initiating DNA amplification, and their sequence-specific design enables precise targeting in diagnostic assays, ensuring detection accuracy greater than 99%.
The production of research-grade oligonucleotides for this segment requires stringent quality control to ensure high fidelity and minimal batch-to-batch variability.
Advancements in synthesis platforms have allowed for faster turnaround times on custom oligo services, enabling rapid development of new molecular cloning and testing protocols.
As applications for PCR expand into new areas of molecular diagnostics and synthetic biology, the need for reliable, high-purity PCR primers and sequence-specific probes continues to underpin market growth.
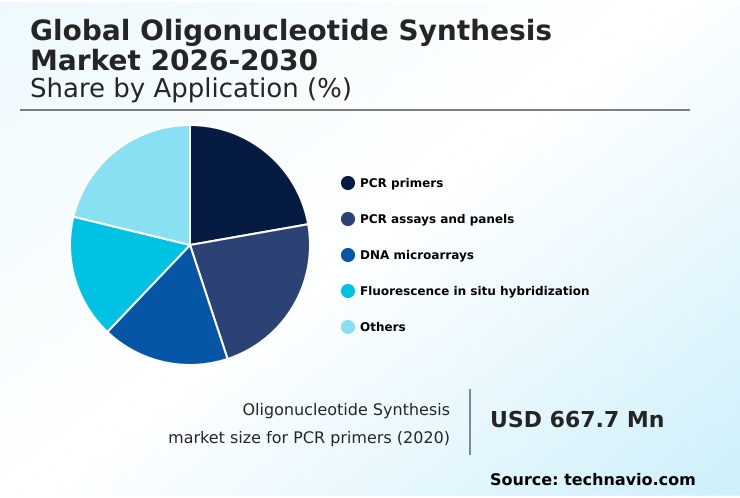
The PCR primers segment was valued at USD 1.01 billion in 2024 and showed a gradual increase during the forecast period.
How demand for the Oligonucleotide Synthesis market is rising in the leading region?
North America is estimated to contribute 46.1% to the growth of the global market during the forecast period.Technavio’s analysts have elaborately explained the regional trends and drivers that shape the market during the forecast period.
See How Oligonucleotide Synthesis Market demand is rising in North America Request Free Sample
The global oligonucleotide synthesis market is geographically dominated by North America, which is projected to contribute 46.1% of the market's incremental growth, outpacing Europe's 27.3%.
This leadership is driven by the United States, home to a dense ecosystem of biotechnology firms and research institutions that collectively fuel demand for genomic research and molecular diagnostics.
The region's advanced infrastructure supports complex GMP production, with US-based facilities often achieving 15% higher throughput on automated workflows compared to facilities in other regions.
In contrast, the Asia Pacific market is characterized by rapid capacity expansion, particularly in China and India, focused on providing cost-effective custom oligo services and research-grade oligonucleotides.
While North America leads in therapeutic-grade material, Asia Pacific's supply chain is optimized for high-volume research and diagnostic assays, reflecting different regional priorities and cost structures.
What are the key Drivers, Trends, and Challenges in the Oligonucleotide Synthesis Market?
Our researchers analyzed the data with 2025 as the base year, along with the key drivers, trends, and challenges. A holistic analysis of drivers will help companies refine their marketing strategies to gain a competitive advantage.
- Evaluating oligonucleotide synthesis for therapeutic use requires a detailed assessment of production methodologies and their impact on final product quality, with current trends showing a 10% annual increase in the adoption of advanced platforms.
- When considering enzymatic vs chemical oligonucleotide synthesis, enzymatic methods are gaining favor for producing long or complex sequences, offering a potential 15-20% improvement in fidelity over traditional phosphoramidite chemistry, although the latter remains dominant for short-mer production. The challenges in GMP oligonucleotide manufacturing are a central concern for therapeutic applications, focusing on robust downstream processing and stringent regulatory compliance.
- For instance, scaling from research to commercial-grade material often introduces purification bottlenecks that can increase project timelines by up to 30%. Consequently, effective oligonucleotide purification and analysis methods are critical for ensuring safety and efficacy, representing a significant portion of the overall production cost.
- A thorough custom oligonucleotide synthesis cost analysis reveals that while raw material expenses are a factor, the investment in quality control metrics and process validation for regulatory submission constitutes a larger share of the total cost-of-goods, particularly for novel nucleic acid-based therapies.
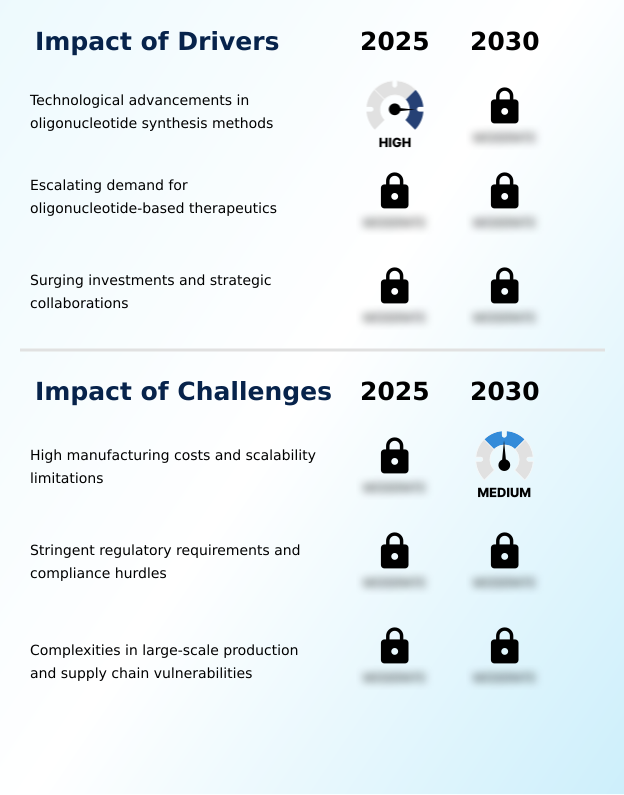
What are the key market drivers leading to the rise in the adoption of Oligonucleotide Synthesis Industry?
- Technological advancements in oligonucleotide synthesis methods are a key driver, enhancing production efficiency, purity, and scalability for diverse applications.
- The escalating demand for nucleic acid therapeutics is a primary market driver, with the pipeline for antisense oligonucleotides and siRNAs growing by over 20% annually.
- This expansion directly fuels the need for high-quality, therapeutic-grade material to support clinical trials and commercialization, pushing manufacturers to scale up GMP production capabilities.
- The rise of precision medicine necessitates the development of highly specific oligonucleotides for targeted gene modulation in treating genetic disorders and oncology.
- As a result, investments are flowing into advanced synthesis technologies capable of producing complex, chemically modified bases with high sequence fidelity.
- This alignment between therapeutic innovation and manufacturing advancement ensures a sustained growth trajectory, as the demand for reliable, large-scale synthesis becomes critical for delivering next-generation medicines.
What are the market trends shaping the Oligonucleotide Synthesis Industry?
- A prominent market trend is the shift toward enzymatic and sustainable synthesis methods. This move addresses environmental concerns and limitations associated with traditional chemical processes.
- A significant trend shaping the oligonucleotide synthesis market is the industry-wide shift toward enzymatic synthesis and high-throughput synthesis methods, which collectively improve production efficiency by over 30% compared to traditional manual processes. The adoption of automated workflows is accelerating, enabling the parallel production of thousands of custom sequences and reducing turnaround times for complex orders.
- For example, certain advanced synthesis platforms can now produce functional RNA oligonucleotides with higher fidelity in aqueous solutions, a key advancement for RNA therapeutic development. This move away from solvent-heavy phosphoramidite chemistry not only addresses environmental concerns but also enhances yield optimization for longer, more complex synthetic genes required for cutting-edge synthetic biology applications and gene editing research.
What challenges does the Oligonucleotide Synthesis Industry face during its growth?
- High manufacturing costs and scalability limitations represent a key challenge, affecting the broader accessibility and cost-effectiveness of oligonucleotide-based products.
- High manufacturing costs and scalability issues remain a significant challenge, with complex downstream processing for high-purity oligonucleotides accounting for up to 60% of total production expenses. Traditional solid-phase synthesis methods face inherent limitations, as yield can decrease by as much as 1-2% with each nucleotide addition, making the cost-effective production of long sequences difficult.
- These scalability limitations and the high cost of raw materials create barriers for smaller research entities and can delay the development of novel nucleic acid therapeutics.
- Overcoming these hurdles requires breakthroughs in yield optimization and the adoption of more efficient manufacturing technologies to align production capabilities with the growing demand from both research and clinical sectors, particularly for large-scale GMP production.
Exclusive Technavio Analysis on Customer Landscape
The oligonucleotide synthesis market forecasting report includes the adoption lifecycle of the market, covering from the innovator’s stage to the laggard’s stage. It focuses on adoption rates in different regions based on penetration. Furthermore, the oligonucleotide synthesis market report also includes key purchase criteria and drivers of price sensitivity to help companies evaluate and develop their market growth analysis strategies.
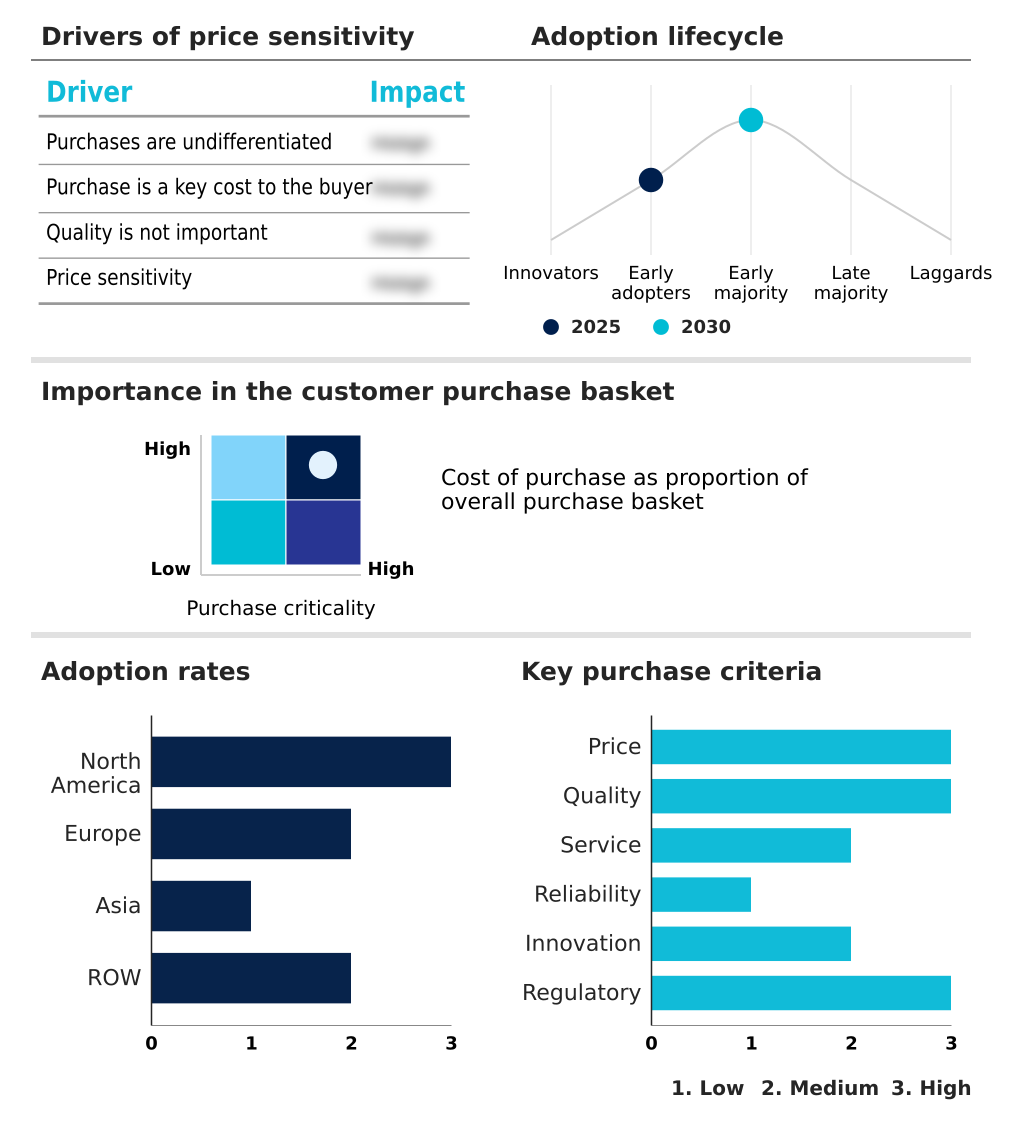
Customer Landscape of Oligonucleotide Synthesis Industry
Competitive Landscape
Companies are implementing various strategies, such as strategic alliances, oligonucleotide synthesis market forecast, partnerships, mergers and acquisitions, geographical expansion, and product/service launches, to enhance their presence in the industry.
Agilent Technologies Inc. - Providing high-quality custom DNA and RNA oligos tailored for advanced research, diagnostic, and therapeutic workflows.
The industry research and growth report includes detailed analyses of the competitive landscape of the market and information about key companies, including:
- Agilent Technologies Inc.
- Ajinomoto Bio Pharma Services
- Ansa Biotechnologies
- Azenta Inc.
- Bio Synthesis Inc
- Biogen Inc.
- Biotage AB
- Danaher Corp.
- GenScript Biotech Corp.
- Kaneka Corp.
- LGC Ltd.
- Merck KGaA
- Nitto Denko Corp.
- QIAGEN N.V.
- Synbio Technologies LLC
- Syngene International Ltd.
- Thermo Fisher Scientific Inc.
- Twist Bioscience Corp.
- WuXi AppTec Co. Ltd.
Qualitative and quantitative analysis of companies has been conducted to help clients understand the wider business environment as well as the strengths and weaknesses of key industry players. Data is qualitatively analyzed to categorize companies as pure play, category-focused, industry-focused, and diversified; it is quantitatively analyzed to categorize companies as dominant, leading, strong, tentative, and weak.
Market Intelligence Radar: High-Impact Developments & Growth Signals
- In the Biotechnology industry, the rise of precision medicine has created substantial demand for custom nucleic acid sequences, directly driving innovation and capacity expansion in oligonucleotide synthesis for personalized therapeutics and companion diagnostics.
- In the Biotechnology industry, tightening regulatory frameworks for advanced therapy medicinal products (ATMPs) are mandating more rigorous purity, safety, and manufacturing standards, compelling oligonucleotide synthesis providers to invest heavily in GMP production and advanced analytical capabilities for therapeutic-grade material.
- In the Biotechnology industry, a strategic shift toward securing domestic supply chains for critical raw materials and APIs is fueling investment in regional oligonucleotide synthesis facilities, enhancing supply chain resilience and reducing dependence on a concentrated number of suppliers.
- In the Biotechnology industry, the push for sustainable manufacturing and green chemistry, influenced by corporate ESG goals, is accelerating the adoption of enzymatic synthesis methods over traditional phosphoramidite chemistry to reduce hazardous waste and solvent use in oligonucleotide production.
Dive into Technavio’s robust research methodology, blending expert interviews, extensive data synthesis, and validated models for unparalleled Oligonucleotide Synthesis Market insights. See full methodology.
| Market Scope | |
|---|---|
| Page number | 309 |
| Base year | 2025 |
| Historic period | 2020-2024 |
| Forecast period | 2026-2030 |
| Growth momentum & CAGR | Accelerate at a CAGR of 17.8% |
| Market growth 2026-2030 | USD 5593.6 million |
| Market structure | Fragmented |
| YoY growth 2025-2026(%) | 15.3% |
| Key countries | US, Canada, Mexico, Germany, UK, France, Italy, Spain, The Netherlands, China, India, Japan, South Korea, Thailand, Indonesia, Brazil, UAE, Saudi Arabia, Israel, South Africa, Turkey, Argentina and Colombia |
| Competitive landscape | Leading Companies, Market Positioning of Companies, Competitive Strategies, and Industry Risks |
Research Analyst Overview
- The oligonucleotide synthesis market ecosystem is a multi-tiered value chain, where specialized suppliers of raw materials like phosphoramidites and enzymes provide foundational inputs to equipment and synthesis platform manufacturers.
- These technology providers, in turn, supply both in-house R&D labs and large-scale Contract Development and Manufacturing Organizations (CDMOs), which handle a significant portion of GMP production, accounting for over 40% of therapeutic oligo manufacturing. The output—custom oligonucleotides—is consumed by a diverse end-user base, with pharmaceutical and biotechnology companies comprising the largest segment.
- These end-users utilize the products for applications ranging from discovery research to clinical diagnostics and the development of nucleic acid therapeutics. Regulatory bodies and supporting R&D institutions influence the entire chain by setting quality standards and driving innovation, creating a dynamic interplay between technological advancement, manufacturing capability, and end-user demand.
What are the Key Data Covered in this Oligonucleotide Synthesis Market Research and Growth Report?
-
What is the expected growth of the Oligonucleotide Synthesis Market between 2026 and 2030?
-
The Oligonucleotide Synthesis Market is expected to grow by USD 5.59 billion during 2026-2030, registering a CAGR of 17.8%. Year-over-year growth in 2026 is estimated at 15.3%%. This acceleration is shaped by technological advancements in oligonucleotide synthesis methods, which is intensifying demand across multiple end-use verticals covered in the report.
-
-
What segmentation does the market report cover?
-
The report is segmented by Application (PCR primers, PCR assays and panels, DNA microarrays, Fluorescence in situ hybridization, and Others), End-user (Pharmaceutical and biotechnology companies, Research and academic institutes, Diagnostic laboratories, and Hospitals), Product (Oligonucleotide products, Reagents and consumables, and Synthesis equipment) and Geography (North America, Europe, Asia, Rest of World (ROW)). Among these, the PCR primers segment is estimated to witness significant growth during the forecast period, driven by rising adoption across key application areas. Each segment includes detailed qualitative and quantitative analysis, along with historical data from 2020-2024 and forecasts through 2030 with year-over-year growth rates.
-
-
Which regions are analyzed in the report?
-
The report covers North America, Europe, Asia and Rest of World (ROW). North America is estimated to contribute 46.1% to market growth during the forecast period. Country-level analysis includes US, Canada, Mexico, Germany, UK, France, Italy, Spain, The Netherlands, China, India, Japan, South Korea, Thailand, Indonesia, Brazil, UAE, Saudi Arabia, Israel, South Africa, Turkey, Argentina and Colombia, with dedicated market size tables and year-over-year growth for each.
-
-
What are the key growth drivers and market challenges?
-
The primary driver is technological advancements in oligonucleotide synthesis methods, which is accelerating investment and industry demand. The main challenge is high manufacturing costs and scalability limitations, creating operational barriers for key market participants. The report quantifies the impact of each driver and challenge across 2026 and 2030 with comparative analysis.
-
-
Who are the major players in the Oligonucleotide Synthesis Market?
-
Key vendors include Agilent Technologies Inc., Ajinomoto Bio Pharma Services, Ansa Biotechnologies, Azenta Inc., Bio Synthesis Inc, Biogen Inc., Biotage AB, Danaher Corp., GenScript Biotech Corp., Kaneka Corp., LGC Ltd., Merck KGaA, Nitto Denko Corp., QIAGEN N.V., Synbio Technologies LLC, Syngene International Ltd., Thermo Fisher Scientific Inc., Twist Bioscience Corp. and WuXi AppTec Co. Ltd.. The report provides qualitative and quantitative analysis categorizing companies as dominant, leading, strong, tentative, and weak based on their market positioning. Company profiles include business segment analysis, SWOT assessment, key offerings, and recent strategic developments.
-
Market Research Insights
- The competitive landscape features a diverse group of companies, with the top ten players accounting for over 60% of the market share through strategic initiatives. Leading vendors like Thermo Fisher Scientific and Twist Bioscience are shaping the market by expanding high-throughput synthesis capabilities to meet escalating demand.
- For example, collaborations are enhancing synthetic biology offerings, including the production of complex oligonucleotide libraries, which accelerates therapeutic candidate discovery by as much as 30%. Innovations in automation now enable the synthesis of custom DNA sequences up to 500 nucleotides with greater complexity. These advancements directly address the industry's need for longer, higher-fidelity constructs for gene editing and synthetic biology.
- However, companies face the persistent challenge of managing supply chain vulnerabilities for critical reagents, prompting investments in diversifying sourcing and building regional manufacturing resilience.
We can help! Our analysts can customize this oligonucleotide synthesis market research report to meet your requirements.
 RIA -
RIA - 
