Drilling Rig Market Size 2026-2030
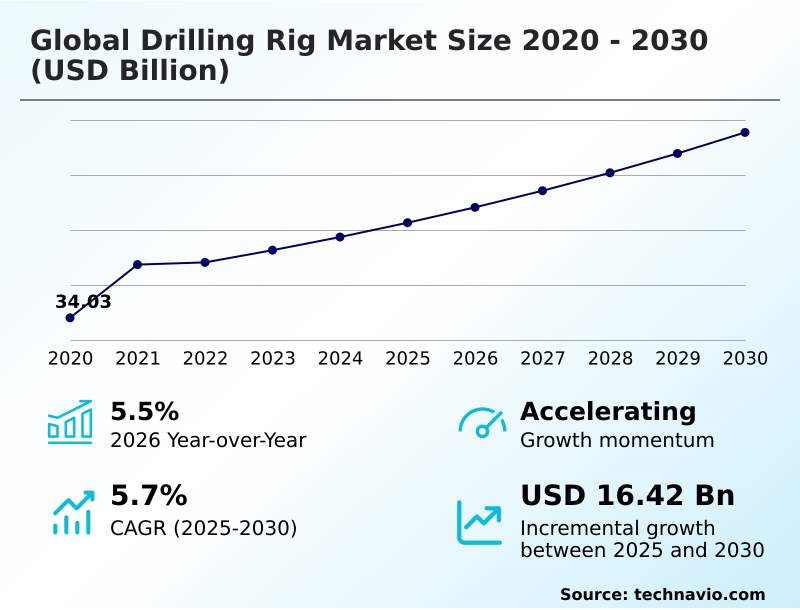
The drilling rig market size is valued to increase by USD 16.42 billion, at a CAGR of 5.7% from 2025 to 2030. Escalating global energy demand propels drilling rig growth will drive the drilling rig market.
Major Market Trends & Insights
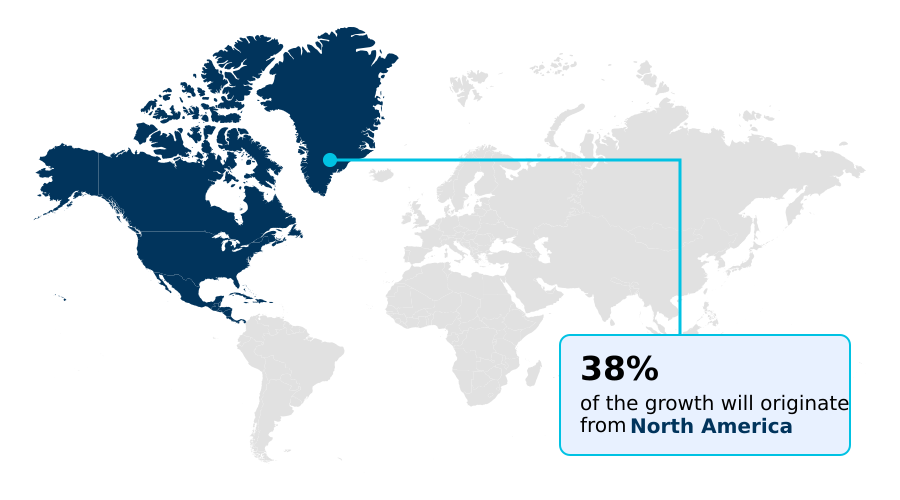
- North America dominated the market and accounted for a 38.3% growth during the forecast period.
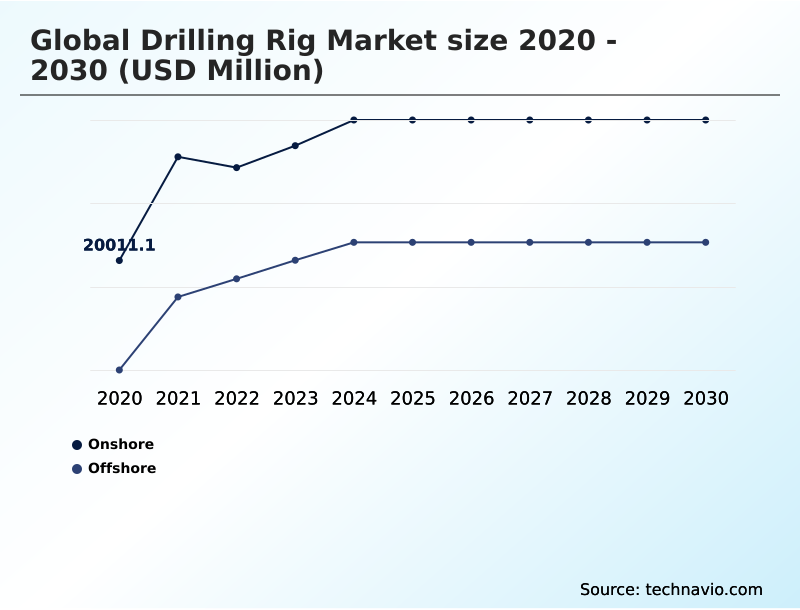
- By Application - Onshore segment was valued at USD 27.71 billion in 2024
- By Type - Crude oil segment accounted for the largest market revenue share in 2024
Market Size & Forecast
- Market Opportunities: USD 33.71 billion
- Market Future Opportunities: USD 16.42 billion
- CAGR from 2025 to 2030 : 5.7%
Market Summary
- The drilling rig market is navigating a complex landscape defined by the dual imperatives of meeting sustained energy demand and adapting to the global energy transition. Growth is closely tied to upstream capital expenditure, which remains sensitive to commodity price fluctuations and geopolitical shifts.
- A significant trend is the increasing diversification of drilling applications, with notable expansion into geothermal energy and carbon capture, utilization, and storage (CCUS) projects, reflecting a strategic pivot toward a lower-carbon future. Technologically, the industry is undergoing a profound transformation with the adoption of automation, AI, and IoT-enabled monitoring to enhance operational efficiency and safety.
- For instance, an operator of a deepwater fleet might deploy predictive maintenance algorithms to monitor the health of critical downhole tools and top drives, reducing unplanned downtime and optimizing maintenance schedules. This data-driven approach allows for improved asset performance and cost control.
- While the resurgence in deepwater and ultra-deepwater exploration continues, the onshore sector is focused on manufacturing efficiencies through highly automated rigs, underscoring the market's ability to innovate amidst competing pressures.
What will be the Size of the Drilling Rig Market during the forecast period?
Get Key Insights on Market Forecast (PDF) Get Free Sample
How is the Drilling Rig Market Segmented?
The drilling rig industry research report provides comprehensive data (region-wise segment analysis), with forecasts and estimates in "USD million" for the period 2026-2030, as well as historical data from 2020-2024 for the following segments.
- Application
- Onshore
- Offshore
- Type
- Crude oil
- Natural gas
- End-user
- Oil and gas
- Mining
- Construction
- Geography
- North America
- US
- Canada
- Mexico
- Middle East and Africa
- Saudi Arabia
- UAE
- APAC
- China
- India
- Indonesia
- Europe
- UK
- Germany
- Italy
- South America
- Brazil
- Argentina
- Colombia
- Rest of World (ROW)
- North America
By Application Insights
The onshore segment is estimated to witness significant growth during the forecast period.
The onshore segment remains a cornerstone of the market, defined by operational resilience and rapid adaptation to market dynamics.
This sector is characterized by activities targeting conventional reservoirs, unconventional shale plays, and geothermal resources, with distinct advantages in logistical simplicity and shorter project timelines.
Key advancements focus on enhancing rig mobility and efficiency through walking and skidding designs, which are critical for large-scale development.
The integration of automated drilling systems and remote operating centers for well construction is fundamentally reshaping operations toward a data-centric model.
For instance, the adoption of advanced automation in pipe handling systems has improved operational safety and reduced well construction times by up to 20%, a critical metric for optimizing capital expenditure on well intervention and completion.
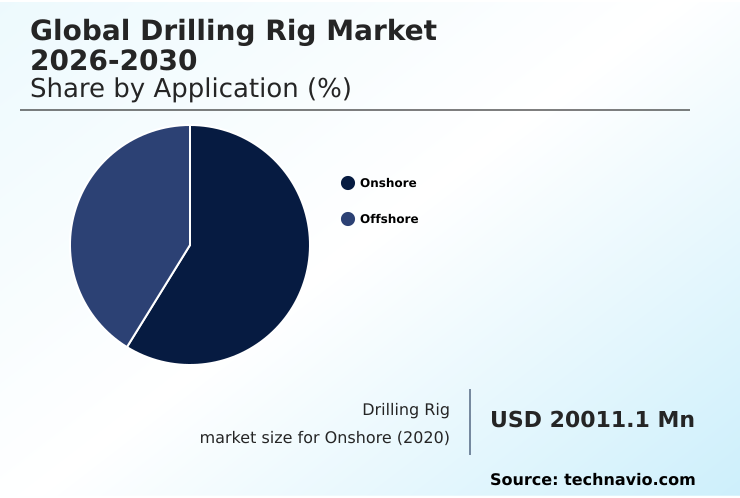
The Onshore segment was valued at USD 27.71 billion in 2024 and showed a gradual increase during the forecast period.
Regional Analysis
North America is estimated to contribute 38.3% to the growth of the global market during the forecast period.Technavio’s analysts have elaborately explained the regional trends and drivers that shape the market during the forecast period.
See How Drilling Rig Market Demand is Rising in North America Get Free Sample
The geographic landscape of the drilling rig market is diverse, with North America leading incremental growth, accounting for over 38% of the market's expansion potential.
This region's activity is dominated by onshore unconventional resources, where operators use advanced horizontal drilling and infill drilling techniques to maximize output. In contrast, APAC is projected to be the fastest-growing region, driven by countries seeking to bolster energy security.
South America, particularly the pre-salt basins, is a key hub for deepwater activity, demanding high-specification drillships and semi-submersibles. The Middle East continues to invest heavily in both onshore and offshore projects to maintain production capacity.
Across these regions, the adoption of technology to improve reservoir management and production optimization is a common theme, with leading operators reducing drilling days by over 25% in certain shale plays through factory-drilling models.
Market Dynamics
Our researchers analyzed the data with 2025 as the base year, along with the key drivers, trends, and challenges. A holistic analysis of drivers will help companies refine their marketing strategies to gain a competitive advantage.
- The future of the drilling rig market is being shaped by the impact of automation on offshore drilling and the implementation of advanced drilling techniques for deepwater environments. A key area of growth involves diversification into geothermal energy drilling applications, where specialized rigs are required to access high-temperature reservoirs.
- The industry is increasingly focused on optimizing drilling parameters with AI, which enables real-time adjustments to improve performance and reduce costs. A critical operational goal is reducing downtime with predictive maintenance, using sensor data to anticipate equipment failures before they occur. The cost-effectiveness of automated drilling systems is a major driver, as these technologies enhance safety and efficiency.
- However, significant challenges in ultra-deepwater exploration persist, requiring sophisticated solutions to manage pressure in complex reservoirs. Navigating environmental regulations in drilling operations remains a top priority, influencing technology choices and project viability. The role of digitalization in rig efficiency is undeniable, with the integration of IoT in drilling equipment providing valuable data for decision-making.
- This trend fuels the demand for high-specification drillships capable of operating in harsh environments. Technology for harsh environment operations is crucial for accessing resources in remote locations. Firms that leverage AI for drilling optimization report a project success rate nearly double that of those using conventional methods, directly impacting operational planning.
- Enhancing safety with robotic pipe handling and offering contract drilling services for shale plays are also key trends. The market is also seeing a push for drilling solutions for unconventional resources, improving wellbore quality with analytics, navigating fiscal policies in oil exploration, and diversifying into carbon capture drilling and drilling for mineral extraction in mining.
What are the key market drivers leading to the rise in the adoption of Drilling Rig Industry?
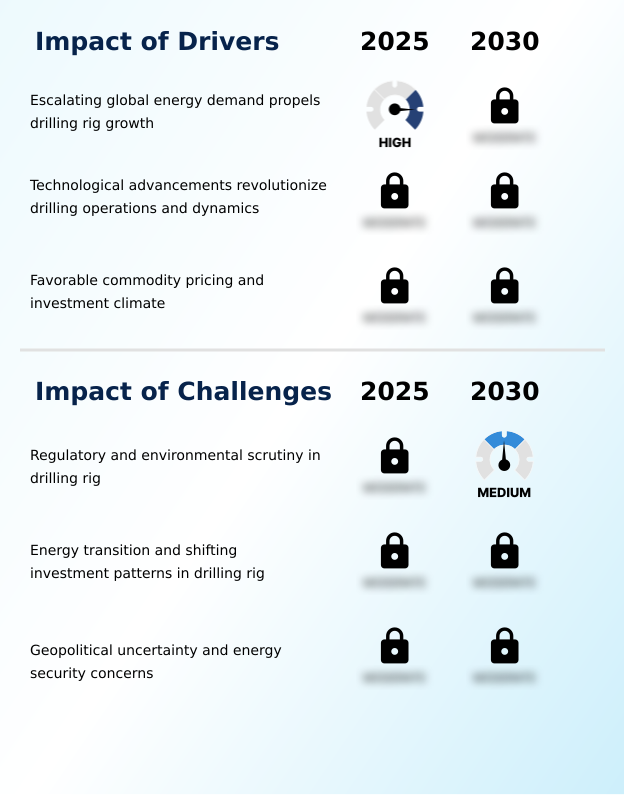
- Escalating global energy demand is a key driver propelling growth in the drilling rig market.
- Growth in the global drilling rig market is propelled by the escalating global energy demand, which necessitates continuous exploration and production (E&P) activities. This sustained demand provides a stable foundation for capital expenditure (CAPEX) in both onshore and offshore operations.
- Technological advancements are a critical driver, with innovations in directional drilling and hydraulic fracturing unlocking vast unconventional resources like shale gas and tight oil. These techniques have increased reservoir contact by over 30%, maximizing resource extraction and improving project economics.
- Favorable commodity pricing further stimulates drilling activity, directly impacting rig utilization rates and day rates for oilfield services.
- In response to price signals, operators can quickly ramp up short-cycle onshore projects, leading to periods of rapid growth in rig counts, sometimes increasing by 25% in key basins within a year.
What are the market trends shaping the Drilling Rig Industry?
- The accelerated adoption of automation and digitalization technologies is a significant trend shaping both onshore and offshore drilling operations, driving efficiency and safety improvements.
- The global drilling rig market is increasingly defined by technological innovation and diversification. The accelerated adoption of automated drilling systems and digital twins is transforming both onshore operations and deepwater exploration. These technologies enable predictive maintenance algorithms that reduce non-productive time and enhance equipment health monitoring, with some operators reporting a 15% improvement in well construction times.
- Simultaneously, a resurgence in demand for high-specification semi-submersibles and drillships is evident as companies target untapped reserves in challenging offshore environments. Another significant trend is the strategic pivot towards non-traditional applications, including geothermal drilling and carbon capture and storage (CCUS) projects.
- This diversification allows contractors to leverage their expertise in new growth sectors, with early geothermal projects demonstrating drilling efficiency gains of up to 20% compared to initial forecasts.
What challenges does the Drilling Rig Industry face during its growth?
- Increasing regulatory and environmental scrutiny presents a key challenge to the growth of the drilling rig industry.
- The global drilling rig market faces significant headwinds from stringent regulatory and environmental scrutiny. Heightened requirements for environmental impact assessments and emissions standards can increase rig compliance costs by 10-15%, extending project timelines.
- The accelerating energy transition is causing a fundamental shift in investment patterns, with capital increasingly flowing toward renewables and away from fossil fuels, impacting both brownfield and greenfield projects. This trend, coupled with geopolitical uncertainty, creates a complex risk environment. High import dependency in major consuming regions amplifies energy security concerns and affects long-term investment decisions in domestic E&P.
- Consequently, project deferral rates have doubled in some regions compared to five years ago, challenging the demand for drilling rigs and related subsea equipment.
Exclusive Technavio Analysis on Customer Landscape
The drilling rig market forecasting report includes the adoption lifecycle of the market, covering from the innovator’s stage to the laggard’s stage. It focuses on adoption rates in different regions based on penetration. Furthermore, the drilling rig market report also includes key purchase criteria and drivers of price sensitivity to help companies evaluate and develop their market growth analysis strategies.
Customer Landscape of Drilling Rig Industry
Competitive Landscape
Companies are implementing various strategies, such as strategic alliances, drilling rig market forecast, partnerships, mergers and acquisitions, geographical expansion, and product/service launches, to enhance their presence in the industry.
Archer Ltd. - Delivering specialized well integrity and intervention expertise through comprehensive land and offshore drilling services, enhancing operational performance and asset reliability across diverse environments.
The industry research and growth report includes detailed analyses of the competitive landscape of the market and information about key companies, including:
- Archer Ltd.
- China Oilfield Services Ltd.
- Helmerich and Payne Inc.
- Nabors Industries Ltd.
- Noble Corp. Plc
- NOV Inc.
- Parker Drilling Co.
- Patterson UTI Energy Inc.
- PR Marriott Drilling Ltd.
- Precision Drilling Corp.
- Saipem S.p.A.
- Schlumberger Ltd.
- Seadrill Ltd.
- Transocean Ltd.
- Valaris Ltd.
- Weatherford International Plc
Qualitative and quantitative analysis of companies has been conducted to help clients understand the wider business environment as well as the strengths and weaknesses of key industry players. Data is qualitatively analyzed to categorize companies as pure play, category-focused, industry-focused, and diversified; it is quantitatively analyzed to categorize companies as dominant, leading, strong, tentative, and weak.
Recent Development and News in Drilling rig market
- In September, 2024, Nabors Industries Ltd. announced a strategic initiative to adapt its advanced drilling technologies for geothermal energy projects, aiming to leverage its expertise to enhance the economic viability of geothermal well construction.
- In March, 2025, Shell Plc announced its final investment decision for the Gato do Mato ultra-deepwater field development in the Santos Basin offshore Brazil, a project expected to require a high-specification floating production, storage, and offloading (FPSO) unit.
- In April, 2025, Brazil's national oil company, Petrobras, unveiled an ambitious plan to significantly expand its deepwater exploration and production activities in the pre-salt basins, signaling a major catalyst for the offshore drilling market in South America.
- In May, 2025, ADNOC Drilling confirmed its acquisition of a majority stake in SLB's land rig business in Kuwait and Oman, a move designed to consolidate control over key service assets and ensure long-term operational efficiency.
Dive into Technavio’s robust research methodology, blending expert interviews, extensive data synthesis, and validated models for unparalleled Drilling Rig Market insights. See full methodology.
| Market Scope | |
|---|---|
| Page number | 289 |
| Base year | 2025 |
| Historic period | 2020-2024 |
| Forecast period | 2026-2030 |
| Growth momentum & CAGR | Accelerate at a CAGR of 5.7% |
| Market growth 2026-2030 | USD 16416.8 million |
| Market structure | Fragmented |
| YoY growth 2025-2026(%) | 5.5% |
| Key countries | US, Canada, Mexico, Saudi Arabia, UAE, Iraq, Egypt, Algeria, China, India, Indonesia, Australia, Malaysia, Thailand, Russia, Norway, UK, Germany, Italy, The Netherlands, Brazil, Argentina and Colombia |
| Competitive landscape | Leading Companies, Market Positioning of Companies, Competitive Strategies, and Industry Risks |
Research Analyst Overview
- The drilling rig market is undergoing a significant technological evolution, moving beyond traditional operational models to embrace advanced digital solutions. The industry's trajectory is heavily influenced by the adoption of automated drilling systems, which are becoming standard for both onshore and offshore operations. This shift is driven by the need for greater efficiency in well construction and well completion.
- A central trend is the integration of predictive maintenance algorithms and digital twins, which allow operators to simulate drilling scenarios and monitor equipment health in real time. This capability is critical for managing complex assets like drillships and semi-submersibles used in deepwater exploration and ultra-deepwater exploration.
- For boardroom decision-making, the key consideration is the capital allocation for upgrading existing fleets with technologies such as managed pressure drilling (MPD) and rotary steerable systems versus acquiring new, fully automated assets. The adoption of predictive maintenance has been shown to reduce critical equipment failures by over 40%, directly impacting project timelines and profitability.
- This push toward data-driven operations, encompassing everything from seismic imaging to downhole tools and top drives, is redefining competitive advantages in the industry.
What are the Key Data Covered in this Drilling Rig Market Research and Growth Report?
-
What is the expected growth of the Drilling Rig Market between 2026 and 2030?
-
USD 16.42 billion, at a CAGR of 5.7%
-
-
What segmentation does the market report cover?
-
The report is segmented by Application (Onshore, and Offshore), Type (Crude oil, and Natural gas), End-user (Oil and gas, Mining, and Construction) and Geography (North America, Middle East and Africa, APAC, Europe, South America)
-
-
Which regions are analyzed in the report?
-
North America, Middle East and Africa, APAC, Europe and South America
-
-
What are the key growth drivers and market challenges?
-
Escalating global energy demand propels drilling rig growth, Regulatory and environmental scrutiny in drilling rig
-
-
Who are the major players in the Drilling Rig Market?
-
Archer Ltd., China Oilfield Services Ltd., Helmerich and Payne Inc., Nabors Industries Ltd., Noble Corp. Plc, NOV Inc., Parker Drilling Co., Patterson UTI Energy Inc., PR Marriott Drilling Ltd., Precision Drilling Corp., Saipem S.p.A., Schlumberger Ltd., Seadrill Ltd., Transocean Ltd., Valaris Ltd. and Weatherford International Plc
-
Market Research Insights
- The drilling rig market is shaped by dynamic economic and operational factors. Rig utilization rates and day rates are heavily influenced by exploration and production companies' capital expenditure (CAPEX) cycles, which respond to energy security concerns and commodity price volatility. To mitigate financial risk, operators are leveraging real-time data analytics to achieve significant drilling efficiency gains.
- The application of these technologies has been shown to reduce non-productive time (NPT) by over 15% in complex wellbores. Furthermore, strategic asset performance solutions focused on predictive equipment health monitoring have improved operational uptime, with some contractors reporting a 10% increase in fleet availability.
- This focus on optimizing wellbore assurance and production optimization through technology underscores a structural shift toward more resilient and data-driven business models across the industry.
We can help! Our analysts can customize this drilling rig market research report to meet your requirements.
 RIA -
RIA - 
