
Enhanced Oil Recovery Market Analysis, Size, and Forecast 2026-2030: North America (US, Canada, and Mexico), Europe (UK, Germany, and France), APAC (China, India, and Japan), Middle East and Africa (Saudi Arabia, UAE, and Turkey), South America (Brazil, Argentina, and Chile), and Rest of World (ROW)

Enhanced Oil Recovery Market Analysis, Size, and Forecast 2026-2030:
North America (US, Canada, and Mexico), Europe (UK, Germany, and France), APAC (China, India, and Japan), Middle East and Africa (Saudi Arabia, UAE, and Turkey), South America (Brazil, Argentina, and Chile), and Rest of World (ROW)

Published: Oct 2026 308 Pages SKU: IRTNTR73618

Market Overview at a Glance

$30.10 B
Market Opportunity
9.1%
CAGR 2025 - 2030
38.4%
North America Growth
$27.41 B
Thermal injection segment 2024

Enhanced Oil Recovery Market Size 2026-2030

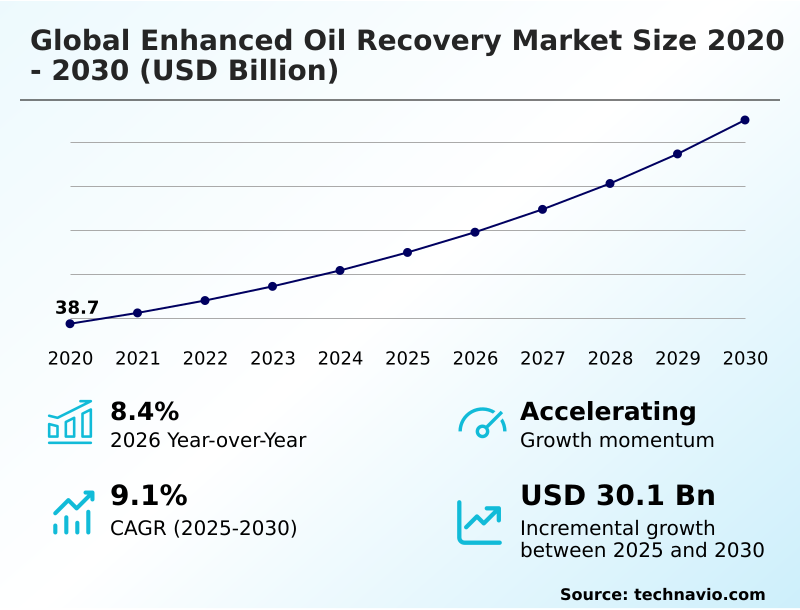
The enhanced oil recovery market size is valued to increase by USD 30.10 billion, at a CAGR of 9.1% from 2025 to 2030. Maximizing mature field production potential will drive the enhanced oil recovery market.

Major Market Trends & Insights

  • North America dominated the market and accounted for a 38.4% growth during the forecast period.
  • By Technology - Thermal injection segment was valued at USD 27.41 billion in 2024
  • By Application - Onshore segment accounted for the largest market revenue share in 2024

Market Size & Forecast

  • Market Opportunities: USD 46.29 billion
  • Market Future Opportunities: USD 30.10 billion
  • CAGR from 2025 to 2030 : 9.1%

Market Summary

  • The Enhanced Oil Recovery Market represents a critical technological bridge for operators seeking to extend the economic lifecycle of mature hydrocarbon assets. Operators increasingly deploy tertiary extraction methods to mobilize trapped crude, achieving recovery factors up to 20% higher than traditional secondary waterflooding techniques.
  • In a practical business scenario, an onshore facility utilizing captured industrial emissions for miscible flooding not only repressurizes declining reservoirs but also permanently sequesters greenhouse gases, effectively aligning production targets with stringent decarbonization mandates.
  • The primary driver propelling this sector is the urgent economic necessity to extract maximum value from existing infrastructure, as revitalizing brownfield assets is significantly more cost-effective than funding high-risk frontier exploration. Conversely, the market faces severe constraints due to the massive capital expenditures required for specialized thermal generation and chemical injection systems.
  • Because continuous injection of expensive polymers demands heavy upfront investment, independent operators often struggle to maintain project profitability during periods of commodity price volatility. Ultimately, the successful deployment of these advanced systems secures vital energy supplies while deferring billion-dollar field decommissioning costs.

What will be the Size of the Enhanced Oil Recovery Market during the forecast period?
Get Key Insights on Market Forecast (PDF) Get Free Sample

How is the Enhanced Oil Recovery Market Segmented?

The enhanced oil recovery industry research report provides comprehensive data (region-wise segment analysis), with forecasts and estimates in "USD million" for the period 2026-2030, as well as historical data from 2020-2024 for the following segments.

  • Technology
    • Thermal injection
    • Gas injection
    • Chemical injection
    • Others
  • Application
    • Onshore
    • Offshore
  • Type
    • Sandstone reservoirs
    • Carbonate reservoirs
    • Shale formations
  • Geography
    • North America
      • US
      • Canada
      • Mexico
    • Europe
      • UK
      • Germany
      • France
      • Italy
      • Spain
      • The Netherlands
    • APAC
      • China
      • India
      • Japan
      • South Korea
      • Australia
      • Indonesia
    • Middle East and Africa
      • Saudi Arabia
      • UAE
      • Turkey
      • South Africa
      • Israel
    • South America
      • Brazil
      • Argentina
      • Chile

By Technology Insights

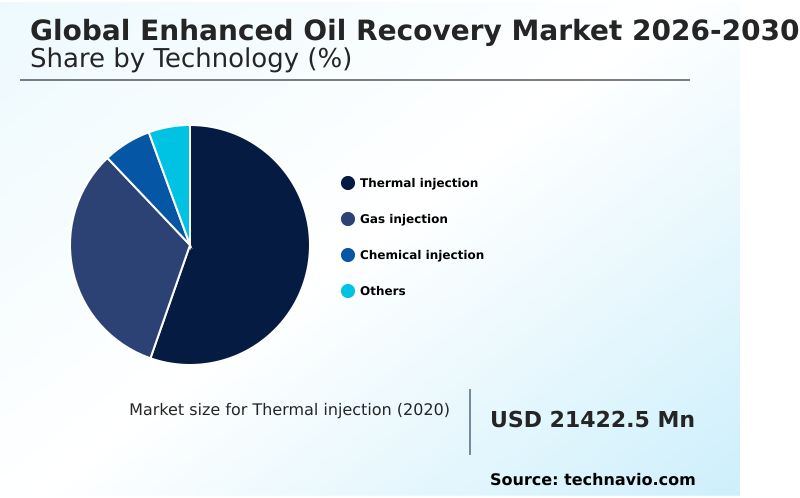
The thermal injection segment is estimated to witness significant growth during the forecast period.

The thermal injection segment of the Enhanced Oil Recovery market focuses on reducing the viscosity of heavy crude to facilitate flow toward production wellbores. Operations utilizing thermal methods achieve a 45% higher extraction yield compared to conventional primary depletion.

This efficiency gain occurs because heat application fundamentally alters fluid dynamics, allowing operators to overcome resistance in heterogeneous carbonate strata. Advanced subsea separation units and continuous reservoir surveillance technology ensure optimal heat distribution across complex subterranean layers.

Consequently, macroscopic displacement efficiency improves significantly, minimizing wasted thermal energy. Furthermore, the strategic hydraulic fracturing integration with thermal cycling maximizes macroscopic sweep efficiency, directing targeted heat fronts through impermeable zones.

Recent innovations incorporate biodegradable chemical agents and ionic composition modification to prevent wellbore scaling during high-temperature operations, sustaining production rates while reducing surface facility maintenance downtime by nearly 20%.
Get Free Sample

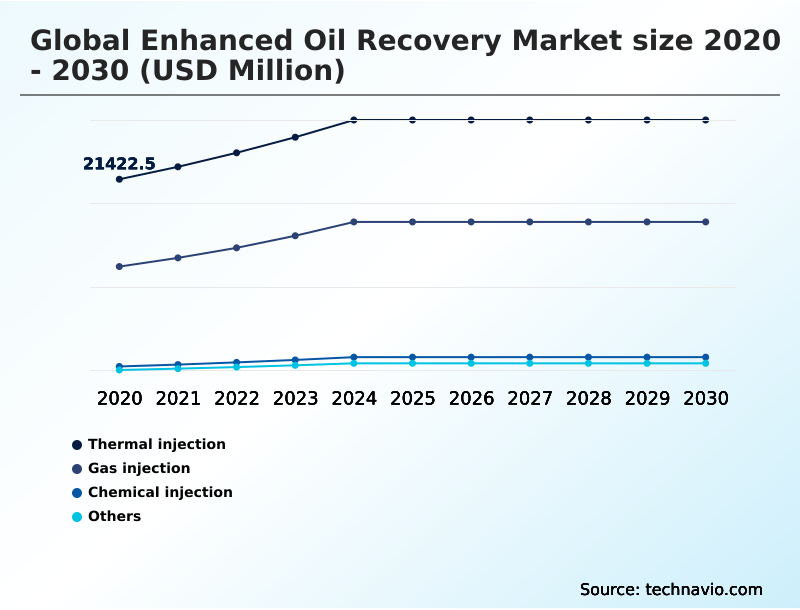
The Thermal injection segment was valued at USD 27.41 billion in 2024 and showed a gradual increase during the forecast period.
Get Free Sample

Regional Analysis

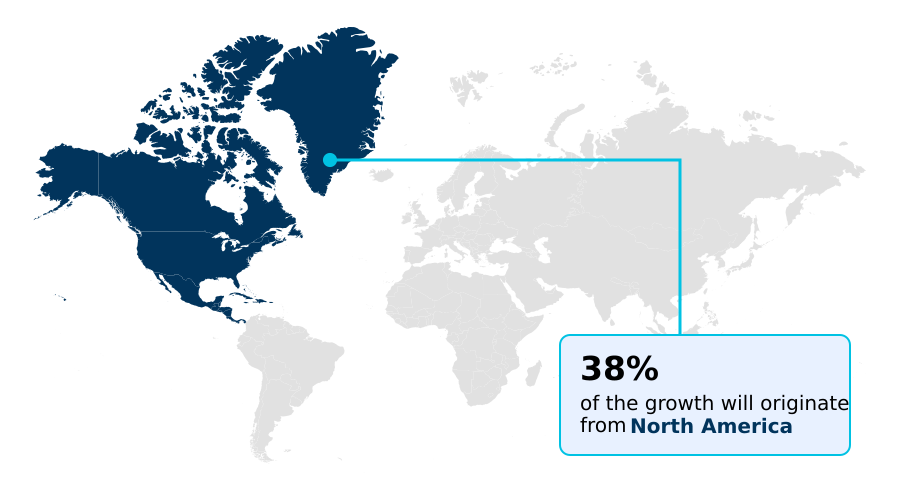
North America is estimated to contribute 38.4% to the growth of the global market during the forecast period.Technavio’s analysts have elaborately explained the regional trends and drivers that shape the market during the forecast period.
See How Enhanced Oil Recovery Market Demand is Rising in North America Get Free Sample

The geographic landscape of the Enhanced Oil Recovery market reveals significant technical disparities between North America and APAC. North America dominates miscible gas deployment, exhibiting a 35% higher adoption rate of supercritical carbon dioxide injection compared to APAC.

This regional superiority is driven by the extensive application of digital rock physics and smart well architecture, which allows operators to master complex fluid rock interaction.

Consequently, North American facilities achieve a 20% improvement in viscous fingering prevention, maximizing sweep efficiency. In contrast, APAC operators prioritize thermal methods and artificial lift systems to target shallow, viscous crude deposits.

By focusing on capillary force reduction across the oil wet rock surface, Asian facilities have improved water cut management by 18%.

Furthermore, both regions enforce strict environmental protocols, driving a 25% increase in capital allocation toward induced seismicity mitigation monitoring networks during high-pressure injection operations.

Market Dynamics

Our researchers analyzed the data with 2025 as the base year, along with the key drivers, trends, and challenges. A holistic analysis of drivers will help companies refine their marketing strategies to gain a competitive advantage.

  • The operational paradigm within the Enhanced Oil Recovery sector heavily relies on the strategic deployment of targeted tertiary extraction frameworks to optimize the lifespan of mature assets. To counter rapid production declines, energy companies increasingly prioritize carbon dioxide miscible gas flooding, which effectively swells trapped crude and significantly lowers oil viscosity to enhance flow dynamics.
  • When managing complex geological structures, the implementation of high temperature carbonate stimulation solutions becomes critical for altering natural rock wettability, allowing operators to mobilize residual hydrocarbons efficiently. This chemical interaction ensures that previously bypassed oil pockets are systematically swept toward production wellbores.
  • Furthermore, extraction strategies in ultra-viscous fields depend on cyclic steam stimulation heavy oil applications, fundamentally improving recovery profiles by reducing friction within porous media. Compared to standard secondary recovery operations, these advanced thermal and gas techniques yield a 25% improvement in overall volumetric displacement, greatly enhancing the return on invested capital.
  • In addition, marine and offshore operators are rapidly integrating low salinity water injection techniques to modify ionic compositions, significantly reducing operational water treatment overhead. Concurrently, the deployment of alkaline surfactant polymer chemical flooding in complex sandstone formations neutralizes acidic crude components and drastically reduces interfacial tension.
  • By combining these advanced methodologies, enterprise operators optimize supply chain logistics for chemical procurement and drastically lower long-term lifting costs, ensuring continuous production stability across globally distributed legacy assets.
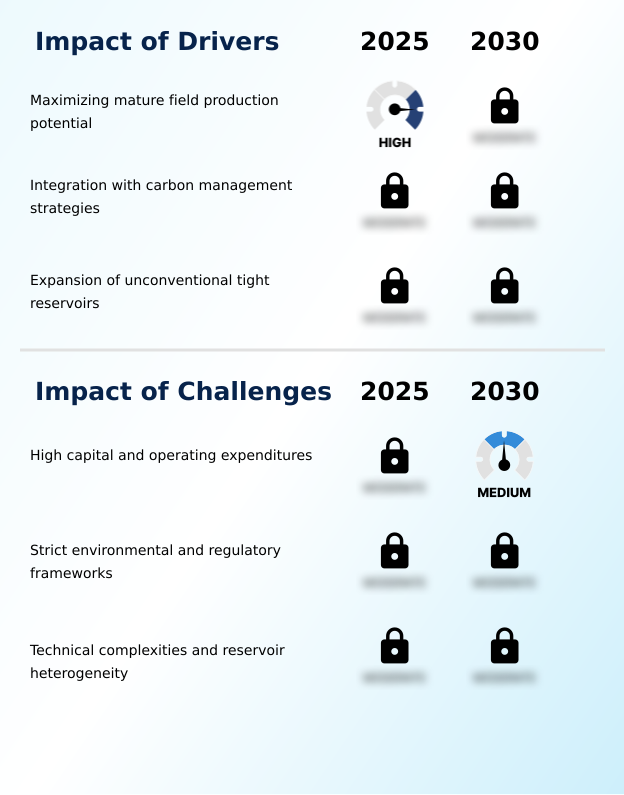
What are the key market drivers leading to the rise in the adoption of Enhanced Oil Recovery Industry?

  • The continuous drive to maximize production potential from mature and aging oilfields acts as a primary catalyst for advanced extraction technology adoption.

  • The escalating necessity to maximize economic yields from aging petroleum assets acts as a profound driver for the Enhanced Oil Recovery sector.
  • Energy producers rapidly deploy low salinity waterflooding and alkaline surfactant polymer frameworks to extract residual crude trapped within complex rock matrices.
  • This operational urgency stems from the severe limitation of natural fracture network connectivity, which historically strands millions of barrels underground.
  • By analyzing continuous subsurface telemetry data, operators pinpoint optimal zones for microbial enhanced recovery and in situ combustion, driving extraction efficiency up by 18%.
  • To facilitate these harsh chemical and thermal environments, companies invest heavily in corrosion resistant metallurgy, ensuring robust wellbore integrity preservation over decades of operation.
  • Consequently, integrated carbon capture utilization strategies drastically improve lifecycle asset returns, while parallel innovations in produced water treatment reduce overhead fluid management costs by 25%.

What are the market trends shaping the Enhanced Oil Recovery Industry?

  • Advancements in chemical surfactant and polymer formulations constitute a primary trend shaping the modern extraction landscape. These sophisticated chemical agents significantly improve sweep efficiency and lower interfacial tension in mature reservoirs.

  • A definitive trend transforming the Enhanced Oil Recovery landscape is the integration of advanced digital diagnostics with targeted chemical and thermal extraction methods. Operators increasingly utilize real-time permeability distribution mapping to optimize thermal injection and gas miscible flooding across depleted basins.
  • This technological shift is necessitated by the complex geology of unconventional tight reservoirs, where traditional waterflooding fails to achieve sufficient hydrocarbon mobilization. By deploying specialized surfactant polymer formulation and precision wettability alteration techniques, engineers manipulate fluid properties, reducing bypass ratios and enhancing sweep efficiency by 22%.
  • Furthermore, the refinement of cyclic steam stimulation minimizes thermal energy waste, lowering surface operating costs by 15%. Crucially, modern injection strategies seamlessly incorporate anthropogenic emissions sequestration, ensuring that critical reservoir pressure maintenance is achieved while aligning with stringent global decarbonization mandates.

What challenges does the Enhanced Oil Recovery Industry face during its growth?

  • Prohibitive capital requirements and escalating operating expenditures present formidable barriers to the widespread deployment of advanced tertiary recovery infrastructure.

  • The widespread execution of Enhanced Oil Recovery operations faces substantial challenges stemming from unpredictable subterranean geology and extreme capital requirements. Complex multiphase fluid flow within depleted strata frequently causes premature channeling during subsurface fluid injection, severely undercutting project economics. This unpredictability occurs because traditional extraction models fail to account for the erratic spontaneous imbibition process within heterogeneous formations.
  • Although operators employ advanced geochemical modeling simulation to understand the viscosity reduction mechanism, optimizing heavy oil upgrading remains highly energy-intensive. Furthermore, the deployment of specialized techniques like steam assisted gravity drainage and nanoparticle stabilized foam demands massive upfront financial investments in specialized surface generators.
  • While integrating geothermal heat co-production offers theoretical energy savings, the practical execution of interfacial tension reduction programs frequently escalates chemical procurement costs by 30%, limiting the adoption of these sophisticated recovery frameworks among independent, resource-constrained energy firms.

Exclusive Technavio Analysis on Customer Landscape

The enhanced oil recovery market forecasting report includes the adoption lifecycle of the market, covering from the innovator’s stage to the laggard’s stage. It focuses on adoption rates in different regions based on penetration. Furthermore, the enhanced oil recovery market report also includes key purchase criteria and drivers of price sensitivity to help companies evaluate and develop their market growth analysis strategies.
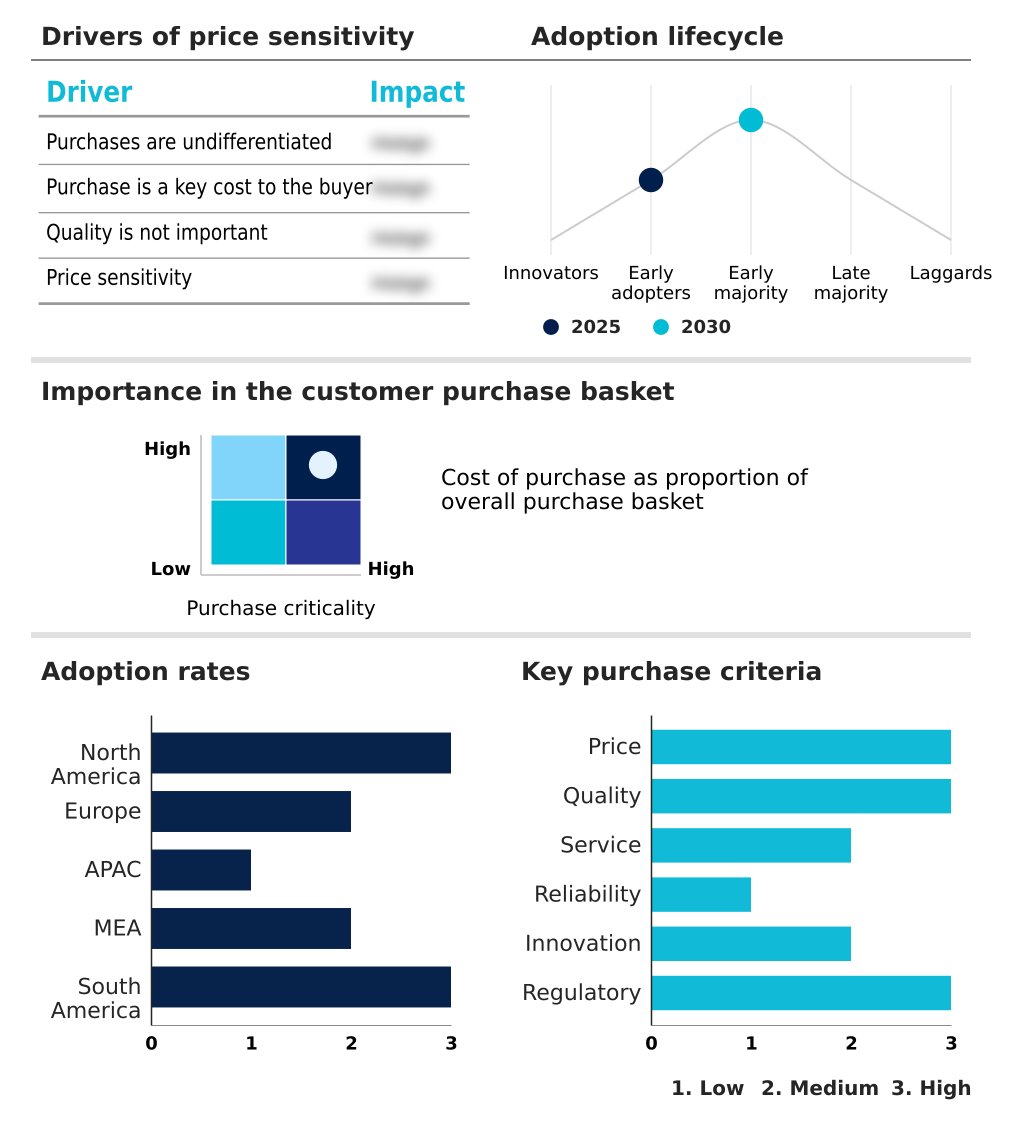
Customer Landscape of Enhanced Oil Recovery Industry

Competitive Landscape

Companies are implementing various strategies, such as strategic alliances, enhanced oil recovery market forecast, partnerships, mergers and acquisitions, geographical expansion, and product/service launches, to enhance their presence in the industry.

Abu Dhabi National Oil Co. - The vendor provides comprehensive enhanced oil recovery solutions encompassing thermal injection, carbon dioxide flooding, and advanced chemical treatments like polymer formulations, ensuring optimized hydrocarbon extraction and robust flow-assurance.

The industry research and growth report includes detailed analyses of the competitive landscape of the market and information about key companies, including:

  • Abu Dhabi National Oil Co.
  • Baker Hughes Co.
  • BASF SE
  • BY ZL GROUP
  • ChampionX Corp.
  • Chevron Corp.
  • China National Petroleum Corp.
  • Clariant International Ltd.
  • Core Laboratories NV
  • Dow Chemical Co.
  • Equinor ASA
  • Exxon Mobil Corp.
  • Halliburton Co.
  • Occidental Petroleum Corp.
  • Petroleo Brasileiro SA
  • Petroliam Nasional Berhad
  • Saudi Arabian Oil Co.
  • Shell plc
  • SNF Group
  • TechnipFMC plc
  • Weatherford International Plc

Qualitative and quantitative analysis of companies has been conducted to help clients understand the wider business environment as well as the strengths and weaknesses of key industry players. Data is qualitatively analyzed to categorize companies as pure play, category-focused, industry-focused, and diversified; it is quantitatively analyzed to categorize companies as dominant, leading, strong, tentative, and weak.

Recent Development and News in Enhanced oil recovery market

  • In the Oil and Gas Drilling industry, the widespread integration of carbon capture and storage technologies at processing facilities has generated substantial volumes of captured industrial carbon dioxide, directly impacting Enhanced Oil Recovery demand by providing a cost-effective, abundant injection fluid for mature field revitalization.
  • Strict regulatory limits on freshwater consumption for onshore hydraulic fracturing have accelerated the adoption of produced water recycling systems, directly impacting Enhanced Oil Recovery demand by enabling sustainable low-salinity waterflooding operations without depleting local aquifers.
  • The deployment of high-temperature, corrosion-resistant flexible subsea piping has reduced deepwater equipment failure rates by 30%, directly impacting Enhanced Oil Recovery demand by making continuous high-pressure gas injection commercially viable in harsh marine environments.
  • Advancements in digital twin and 4D seismic modeling software have improved subsurface fluid tracking accuracy by over 25%, directly impacting Enhanced Oil Recovery demand by allowing engineers to precisely target bypassed oil pockets and prevent premature chemical breakthrough.

Dive into Technavio’s robust research methodology, blending expert interviews, extensive data synthesis, and validated models for unparalleled Enhanced Oil Recovery Market insights. See full methodology.

Market Scope
Page number 308
Base year 2025
Historic period 2020-2024
Forecast period 2026-2030
Growth momentum & CAGR Accelerate at a CAGR of 9.1%
Market growth 2026-2030 USD 30098.8 million
Market structure Fragmented
YoY growth 2025-2026(%) 8.4%
Key countries US, Canada, Mexico, UK, Germany, France, Italy, Spain, The Netherlands, China, India, Japan, South Korea, Australia, Indonesia, Saudi Arabia, UAE, Turkey, South Africa, Israel, Brazil, Argentina and Chile
Competitive landscape Leading Companies, Market Positioning of Companies, Competitive Strategies, and Industry Risks

Request Free Sample

Research Analyst Overview

  • The Enhanced Oil Recovery landscape is undergoing a profound structural shift as operators pivot from conventional depletion to sophisticated tertiary extraction frameworks. The accelerating deployment of thermal injection and gas flooding enables facilities to mobilize vast reserves of previously unrecoverable crude.
  • In response to tightening environmental mandates, boardroom executives are aggressively linking production strategy with carbon capture, effectively transforming industrial emissions into valuable injection fluids. This strategic alignment allows operators to achieve a 30% reduction in surface emissions intensity while simultaneously repressurizing mature reservoirs. Furthermore, breakthroughs in surfactant formulation and alkaline applications dramatically enhance microscopic displacement by reducing capillary forces.
  • The precise calibration of wettability alteration ensures optimal fluid-rock interactions, mitigating premature water breakthrough. Additionally, offshore operators increasingly implement low salinity waterflooding to modify ionic environments, lowering operational footprint requirements. For heavy crude assets, the refined application of cyclic steam stimulation maximizes heat transfer within the subterranean matrix.
  • Ultimately, these advanced engineering interventions empower energy producers to secure supply chain resilience and extend the economic viability of legacy infrastructure.

What are the Key Data Covered in this Enhanced Oil Recovery Market Research and Growth Report?

  • What is the expected growth of the Enhanced Oil Recovery Market between 2026 and 2030?

    • USD 30.10 billion, at a CAGR of 9.1%

  • What segmentation does the market report cover?

    • The report is segmented by Technology (Thermal injection, Gas injection, Chemical injection, and Others), Application (Onshore, and Offshore), Type (Sandstone reservoirs, Carbonate reservoirs, and Shale formations) and Geography (North America, Europe, APAC, Middle East and Africa, South America)

  • Which regions are analyzed in the report?

    • North America, Europe, APAC, Middle East and Africa and South America

  • What are the key growth drivers and market challenges?

    • Maximizing mature field production potential, High capital and operating expenditures

  • Who are the major players in the Enhanced Oil Recovery Market?

    • Abu Dhabi National Oil Co., Baker Hughes Co., BASF SE, BY ZL GROUP, ChampionX Corp., Chevron Corp., China National Petroleum Corp., Clariant International Ltd., Core Laboratories NV, Dow Chemical Co., Equinor ASA, Exxon Mobil Corp., Halliburton Co., Occidental Petroleum Corp., Petroleo Brasileiro SA, Petroliam Nasional Berhad, Saudi Arabian Oil Co., Shell plc, SNF Group, TechnipFMC plc and Weatherford International Plc

Market Research Insights

  • The Enhanced Oil Recovery Market continually evolves as operators integrate advanced tertiary techniques to optimize reservoir pressure maintenance and maximize hydrocarbon mobilization in aging fields. By deploying specialized injection methodologies, extraction facilities have successfully reduced premature well abandonment by 15% while improving overall volumetric sweep efficiency by up to 22%.
  • Furthermore, the strategic application of these technologies in unconventional tight reservoirs allows operators to overcome severe permeability constraints, elevating ultimate recovery rates by nearly 18%. This operational shift frequently incorporates anthropogenic emissions sequestration, enabling businesses to meet strict environmental compliance standards while actively boosting output.
  • Consequently, energy producers achieve significant operational cost reductions and enhanced lifecycle profitability across mature onshore and offshore assets.

We can help! Our analysts can customize this enhanced oil recovery market research report to meet your requirements.

Get in touch

1. Executive Summary

1.1 Market overview

Executive Summary - Chart on Market Overview
Executive Summary - Data Table on Market Overview
Executive Summary - Chart on Global Market Characteristics
Executive Summary - Chart on Market by Geography
Executive Summary - Chart on Market Segmentation by Technology
Executive Summary - Chart on Market Segmentation by Application
Executive Summary - Chart on Market Segmentation by Type
Executive Summary - Chart on Incremental Growth
Executive Summary - Data Table on Incremental Growth
Executive Summary - Chart on Company Market Positioning

2. Technavio Analysis

2.1 Analysis of price sensitivity, lifecycle, customer purchase basket, adoption rates, and purchase criteria

2.2 Criticality of inputs and Factors of differentiation

Chart on Overview on criticality of inputs and factors of differentiation

2.3 Factors of disruption

Chart on Overview on factors of disruption

2.4 Impact of drivers and challenges

Chart on Impact of drivers and challenges in 2025 and 2030

3. Market Landscape

3.1 Market ecosystem

Chart on Parent Market
Data Table on - Parent Market

3.2 Market characteristics

Chart on Market characteristics analysis

3.3 Value chain analysis

Chart on Value chain analysis

4. Market Sizing

4.1 Market definition

Data Table on Offerings of companies included in the market definition

4.2 Market segment analysis

Market segments

4.3 Market size 2025

4.4 Market outlook: Forecast for 2025-2030

Chart on Global - Market size and forecast 2025-2030 ($ million)
Data Table on Global - Market size and forecast 2025-2030 ($ million)
Chart on Global Market: Year-over-year growth 2025-2030 (%)
Data Table on Global Market: Year-over-year growth 2025-2030 (%)

5. Historic Market Size

5.1 Global Enhanced Oil Recovery Market 2020 - 2024

Historic Market Size - Data Table on Global Enhanced Oil Recovery Market 2020 - 2024 ($ million)

5.2 Technology segment analysis 2020 - 2024

Historic Market Size - Technology Segment 2020 - 2024 ($ million)

5.3 Application segment analysis 2020 - 2024

Historic Market Size - Application Segment 2020 - 2024 ($ million)

5.4 Type segment analysis 2020 - 2024

Historic Market Size - Type Segment 2020 - 2024 ($ million)

5.5 Geography segment analysis 2020 - 2024

Historic Market Size - Geography Segment 2020 - 2024 ($ million)

5.6 Country segment analysis 2020 - 2024

Historic Market Size - Country Segment 2020 - 2024 ($ million)

6. Qualitative Analysis

6.1 Impact of AI on Global Enhanced Oil Recovery Market

6.2 Impact of geopolitical conflicts on Global Enhanced Oil Recovery Market

7. Five Forces Analysis

7.1 Five forces summary

Five forces analysis - Comparison between 2025 and 2030

7.2 Bargaining power of buyers

Bargaining power of buyers - Impact of key factors 2025 and 2030

7.3 Bargaining power of suppliers

Bargaining power of suppliers - Impact of key factors in 2025 and 2030

7.4 Threat of new entrants

Threat of new entrants - Impact of key factors in 2025 and 2030

7.5 Threat of substitutes

Threat of substitutes - Impact of key factors in 2025 and 2030

7.6 Threat of rivalry

Threat of rivalry - Impact of key factors in 2025 and 2030

7.7 Market condition

Chart on Market condition - Five forces 2025 and 2030

8. Market Segmentation by Technology

8.1 Market segments

Chart on Technology - Market share 2025-2030 (%)
Data Table on Technology - Market share 2025-2030 (%)

8.2 Comparison by Technology

Chart on Comparison by Technology
Data Table on Comparison by Technology

8.3 Thermal injection - Market size and forecast 2025-2030

Chart on Thermal injection - Market size and forecast 2025-2030 ($ million)
Data Table on Thermal injection - Market size and forecast 2025-2030 ($ million)
Chart on Thermal injection - Year-over-year growth 2025-2030 (%)
Data Table on Thermal injection - Year-over-year growth 2025-2030 (%)

8.4 Gas injection - Market size and forecast 2025-2030

Chart on Gas injection - Market size and forecast 2025-2030 ($ million)
Data Table on Gas injection - Market size and forecast 2025-2030 ($ million)
Chart on Gas injection - Year-over-year growth 2025-2030 (%)
Data Table on Gas injection - Year-over-year growth 2025-2030 (%)

8.5 Chemical injection - Market size and forecast 2025-2030

Chart on Chemical injection - Market size and forecast 2025-2030 ($ million)
Data Table on Chemical injection - Market size and forecast 2025-2030 ($ million)
Chart on Chemical injection - Year-over-year growth 2025-2030 (%)
Data Table on Chemical injection - Year-over-year growth 2025-2030 (%)

8.6 Others - Market size and forecast 2025-2030

Chart on Others - Market size and forecast 2025-2030 ($ million)
Data Table on Others - Market size and forecast 2025-2030 ($ million)
Chart on Others - Year-over-year growth 2025-2030 (%)
Data Table on Others - Year-over-year growth 2025-2030 (%)

8.7 Market opportunity by Technology

Market opportunity by Technology ($ million)
Data Table on Market opportunity by Technology ($ million)

9. Market Segmentation by Application

9.1 Market segments

Chart on Application - Market share 2025-2030 (%)
Data Table on Application - Market share 2025-2030 (%)

9.2 Comparison by Application

Chart on Comparison by Application
Data Table on Comparison by Application

9.3 Onshore - Market size and forecast 2025-2030

Chart on Onshore - Market size and forecast 2025-2030 ($ million)
Data Table on Onshore - Market size and forecast 2025-2030 ($ million)
Chart on Onshore - Year-over-year growth 2025-2030 (%)
Data Table on Onshore - Year-over-year growth 2025-2030 (%)

9.4 Offshore - Market size and forecast 2025-2030

Chart on Offshore - Market size and forecast 2025-2030 ($ million)
Data Table on Offshore - Market size and forecast 2025-2030 ($ million)
Chart on Offshore - Year-over-year growth 2025-2030 (%)
Data Table on Offshore - Year-over-year growth 2025-2030 (%)

9.5 Market opportunity by Application

Market opportunity by Application ($ million)
Data Table on Market opportunity by Application ($ million)

10. Market Segmentation by Type

10.1 Market segments

Chart on Type - Market share 2025-2030 (%)
Data Table on Type - Market share 2025-2030 (%)

10.2 Comparison by Type

Chart on Comparison by Type
Data Table on Comparison by Type

10.3 Sandstone reservoirs - Market size and forecast 2025-2030

Chart on Sandstone reservoirs - Market size and forecast 2025-2030 ($ million)
Data Table on Sandstone reservoirs - Market size and forecast 2025-2030 ($ million)
Chart on Sandstone reservoirs - Year-over-year growth 2025-2030 (%)
Data Table on Sandstone reservoirs - Year-over-year growth 2025-2030 (%)

10.4 Carbonate reservoirs - Market size and forecast 2025-2030

Chart on Carbonate reservoirs - Market size and forecast 2025-2030 ($ million)
Data Table on Carbonate reservoirs - Market size and forecast 2025-2030 ($ million)
Chart on Carbonate reservoirs - Year-over-year growth 2025-2030 (%)
Data Table on Carbonate reservoirs - Year-over-year growth 2025-2030 (%)

10.5 Shale formations - Market size and forecast 2025-2030

Chart on Shale formations - Market size and forecast 2025-2030 ($ million)
Data Table on Shale formations - Market size and forecast 2025-2030 ($ million)
Chart on Shale formations - Year-over-year growth 2025-2030 (%)
Data Table on Shale formations - Year-over-year growth 2025-2030 (%)

10.6 Market opportunity by Type

Market opportunity by Type ($ million)
Data Table on Market opportunity by Type ($ million)

11. Customer Landscape

11.1 Customer landscape overview

Analysis of price sensitivity, lifecycle, customer purchase basket, adoption rates, and purchase criteria

12. Geographic Landscape

12.1 Geographic segmentation

Chart on Market share by geography 2025-2030 (%)
Data Table on Market share by geography 2025-2030 (%)

12.2 Geographic comparison

Chart on Geographic comparison
Data Table on Geographic comparison

12.3 North America - Market size and forecast 2025-2030

Chart on North America - Market size and forecast 2025-2030 ($ million)
Data Table on North America - Market size and forecast 2025-2030 ($ million)
Chart on North America - Year-over-year growth 2025-2030 (%)
Data Table on North America - Year-over-year growth 2025-2030 (%)
Chart on Regional Comparison - North America
Data Table on Regional Comparison - North America

12.3.1 US - Market size and forecast 2025-2030

Chart on US - Market size and forecast 2025-2030 ($ million)
Data Table on US - Market size and forecast 2025-2030 ($ million)
Chart on US - Year-over-year growth 2025-2030 (%)
Data Table on US - Year-over-year growth 2025-2030 (%)

12.3.2 Canada - Market size and forecast 2025-2030

Chart on Canada - Market size and forecast 2025-2030 ($ million)
Data Table on Canada - Market size and forecast 2025-2030 ($ million)
Chart on Canada - Year-over-year growth 2025-2030 (%)
Data Table on Canada - Year-over-year growth 2025-2030 (%)

12.3.3 Mexico - Market size and forecast 2025-2030

Chart on Mexico - Market size and forecast 2025-2030 ($ million)
Data Table on Mexico - Market size and forecast 2025-2030 ($ million)
Chart on Mexico - Year-over-year growth 2025-2030 (%)
Data Table on Mexico - Year-over-year growth 2025-2030 (%)

12.4 Europe - Market size and forecast 2025-2030

Chart on Europe - Market size and forecast 2025-2030 ($ million)
Data Table on Europe - Market size and forecast 2025-2030 ($ million)
Chart on Europe - Year-over-year growth 2025-2030 (%)
Data Table on Europe - Year-over-year growth 2025-2030 (%)
Chart on Regional Comparison - Europe
Data Table on Regional Comparison - Europe

12.4.1 UK - Market size and forecast 2025-2030

Chart on UK - Market size and forecast 2025-2030 ($ million)
Data Table on UK - Market size and forecast 2025-2030 ($ million)
Chart on UK - Year-over-year growth 2025-2030 (%)
Data Table on UK - Year-over-year growth 2025-2030 (%)

12.4.2 Germany - Market size and forecast 2025-2030

Chart on Germany - Market size and forecast 2025-2030 ($ million)
Data Table on Germany - Market size and forecast 2025-2030 ($ million)
Chart on Germany - Year-over-year growth 2025-2030 (%)
Data Table on Germany - Year-over-year growth 2025-2030 (%)

12.4.3 France - Market size and forecast 2025-2030

Chart on France - Market size and forecast 2025-2030 ($ million)
Data Table on France - Market size and forecast 2025-2030 ($ million)
Chart on France - Year-over-year growth 2025-2030 (%)
Data Table on France - Year-over-year growth 2025-2030 (%)

12.4.4 Italy - Market size and forecast 2025-2030

Chart on Italy - Market size and forecast 2025-2030 ($ million)
Data Table on Italy - Market size and forecast 2025-2030 ($ million)
Chart on Italy - Year-over-year growth 2025-2030 (%)
Data Table on Italy - Year-over-year growth 2025-2030 (%)

12.4.5 Spain - Market size and forecast 2025-2030

Chart on Spain - Market size and forecast 2025-2030 ($ million)
Data Table on Spain - Market size and forecast 2025-2030 ($ million)
Chart on Spain - Year-over-year growth 2025-2030 (%)
Data Table on Spain - Year-over-year growth 2025-2030 (%)

12.4.6 The Netherlands - Market size and forecast 2025-2030

Chart on The Netherlands - Market size and forecast 2025-2030 ($ million)
Data Table on The Netherlands - Market size and forecast 2025-2030 ($ million)
Chart on The Netherlands - Year-over-year growth 2025-2030 (%)
Data Table on The Netherlands - Year-over-year growth 2025-2030 (%)

12.5 APAC - Market size and forecast 2025-2030

Chart on APAC - Market size and forecast 2025-2030 ($ million)
Data Table on APAC - Market size and forecast 2025-2030 ($ million)
Chart on APAC - Year-over-year growth 2025-2030 (%)
Data Table on APAC - Year-over-year growth 2025-2030 (%)
Chart on Regional Comparison - APAC
Data Table on Regional Comparison - APAC

12.5.1 China - Market size and forecast 2025-2030

Chart on China - Market size and forecast 2025-2030 ($ million)
Data Table on China - Market size and forecast 2025-2030 ($ million)
Chart on China - Year-over-year growth 2025-2030 (%)
Data Table on China - Year-over-year growth 2025-2030 (%)

12.5.2 India - Market size and forecast 2025-2030

Chart on India - Market size and forecast 2025-2030 ($ million)
Data Table on India - Market size and forecast 2025-2030 ($ million)
Chart on India - Year-over-year growth 2025-2030 (%)
Data Table on India - Year-over-year growth 2025-2030 (%)

12.5.3 Japan - Market size and forecast 2025-2030

Chart on Japan - Market size and forecast 2025-2030 ($ million)
Data Table on Japan - Market size and forecast 2025-2030 ($ million)
Chart on Japan - Year-over-year growth 2025-2030 (%)
Data Table on Japan - Year-over-year growth 2025-2030 (%)

12.5.4 South Korea - Market size and forecast 2025-2030

Chart on South Korea - Market size and forecast 2025-2030 ($ million)
Data Table on South Korea - Market size and forecast 2025-2030 ($ million)
Chart on South Korea - Year-over-year growth 2025-2030 (%)
Data Table on South Korea - Year-over-year growth 2025-2030 (%)

12.5.5 Australia - Market size and forecast 2025-2030

Chart on Australia - Market size and forecast 2025-2030 ($ million)
Data Table on Australia - Market size and forecast 2025-2030 ($ million)
Chart on Australia - Year-over-year growth 2025-2030 (%)
Data Table on Australia - Year-over-year growth 2025-2030 (%)

12.5.6 Indonesia - Market size and forecast 2025-2030

Chart on Indonesia - Market size and forecast 2025-2030 ($ million)
Data Table on Indonesia - Market size and forecast 2025-2030 ($ million)
Chart on Indonesia - Year-over-year growth 2025-2030 (%)
Data Table on Indonesia - Year-over-year growth 2025-2030 (%)

12.6 Middle East and Africa - Market size and forecast 2025-2030

Chart on Middle East and Africa - Market size and forecast 2025-2030 ($ million)
Data Table on Middle East and Africa - Market size and forecast 2025-2030 ($ million)
Chart on Middle East and Africa - Year-over-year growth 2025-2030 (%)
Data Table on Middle East and Africa - Year-over-year growth 2025-2030 (%)
Chart on Regional Comparison - Middle East and Africa
Data Table on Regional Comparison - Middle East and Africa

12.6.1 Saudi Arabia - Market size and forecast 2025-2030

Chart on Saudi Arabia - Market size and forecast 2025-2030 ($ million)
Data Table on Saudi Arabia - Market size and forecast 2025-2030 ($ million)
Chart on Saudi Arabia - Year-over-year growth 2025-2030 (%)
Data Table on Saudi Arabia - Year-over-year growth 2025-2030 (%)

12.6.2 UAE - Market size and forecast 2025-2030

Chart on UAE - Market size and forecast 2025-2030 ($ million)
Data Table on UAE - Market size and forecast 2025-2030 ($ million)
Chart on UAE - Year-over-year growth 2025-2030 (%)
Data Table on UAE - Year-over-year growth 2025-2030 (%)

12.6.3 Turkey - Market size and forecast 2025-2030

Chart on Turkey - Market size and forecast 2025-2030 ($ million)
Data Table on Turkey - Market size and forecast 2025-2030 ($ million)
Chart on Turkey - Year-over-year growth 2025-2030 (%)
Data Table on Turkey - Year-over-year growth 2025-2030 (%)

12.6.4 South Africa - Market size and forecast 2025-2030

Chart on South Africa - Market size and forecast 2025-2030 ($ million)
Data Table on South Africa - Market size and forecast 2025-2030 ($ million)
Chart on South Africa - Year-over-year growth 2025-2030 (%)
Data Table on South Africa - Year-over-year growth 2025-2030 (%)

12.6.5 Israel - Market size and forecast 2025-2030

Chart on Israel - Market size and forecast 2025-2030 ($ million)
Data Table on Israel - Market size and forecast 2025-2030 ($ million)
Chart on Israel - Year-over-year growth 2025-2030 (%)
Data Table on Israel - Year-over-year growth 2025-2030 (%)

12.7 South America - Market size and forecast 2025-2030

Chart on South America - Market size and forecast 2025-2030 ($ million)
Data Table on South America - Market size and forecast 2025-2030 ($ million)
Chart on South America - Year-over-year growth 2025-2030 (%)
Data Table on South America - Year-over-year growth 2025-2030 (%)
Chart on Regional Comparison - South America
Data Table on Regional Comparison - South America

12.7.1 Brazil - Market size and forecast 2025-2030

Chart on Brazil - Market size and forecast 2025-2030 ($ million)
Data Table on Brazil - Market size and forecast 2025-2030 ($ million)
Chart on Brazil - Year-over-year growth 2025-2030 (%)
Data Table on Brazil - Year-over-year growth 2025-2030 (%)

12.7.2 Argentina - Market size and forecast 2025-2030

Chart on Argentina - Market size and forecast 2025-2030 ($ million)
Data Table on Argentina - Market size and forecast 2025-2030 ($ million)
Chart on Argentina - Year-over-year growth 2025-2030 (%)
Data Table on Argentina - Year-over-year growth 2025-2030 (%)

12.7.3 Chile - Market size and forecast 2025-2030

Chart on Chile - Market size and forecast 2025-2030 ($ million)
Data Table on Chile - Market size and forecast 2025-2030 ($ million)
Chart on Chile - Year-over-year growth 2025-2030 (%)
Data Table on Chile - Year-over-year growth 2025-2030 (%)

12.8 Market opportunity by geography

Market opportunity by geography ($ million)
Data Tables on Market opportunity by geography ($ million)

13. Drivers, Challenges, and Opportunity

13.1 Market drivers

Maximizing mature field production potential
Integration with carbon management strategies
Expansion of unconventional tight reservoirs

13.2 Market challenges

High capital and operating expenditures
Strict environmental and regulatory frameworks
Technical complexities and reservoir heterogeneity

13.3 Impact of drivers and challenges

Impact of drivers and challenges in 2025 and 2030

13.4 Market opportunities

Advancements in chemical surfactant polymer
Expansion of low salinity waterflooding
Growth of geothermal enhanced oil recovery

14. Competitive Landscape

14.1 Overview

14.2

Overview on criticality of inputs and factors of differentiation

14.3 Landscape disruption

Overview on factors of disruption

14.4 Industry risks

Impact of key risks on business

15. Competitive Analysis

15.1 Companies profiled

Companies covered

15.2 Company ranking index

15.3 Market positioning of companies

Matrix on companies position and classification

15.4 Baker Hughes Co.

Baker Hughes Co. - Overview
Baker Hughes Co. - Business segments
Baker Hughes Co. - Key news
Baker Hughes Co. - Key offerings
Baker Hughes Co. - Segment focus
SWOT

15.5 BASF SE

BASF SE - Overview
BASF SE - Business segments
BASF SE - Key news
BASF SE - Key offerings
BASF SE - Segment focus
SWOT

15.6 Chevron Corp.

Chevron Corp. - Overview
Chevron Corp. - Business segments
Chevron Corp. - Key news
Chevron Corp. - Key offerings
Chevron Corp. - Segment focus
SWOT

15.7 Clariant International Ltd.

Clariant International Ltd. - Overview
Clariant International Ltd. - Business segments
Clariant International Ltd. - Key offerings
Clariant International Ltd. - Segment focus
SWOT

15.8 Dow Chemical Co.

Dow Chemical Co. - Overview
Dow Chemical Co. - Business segments
Dow Chemical Co. - Key news
Dow Chemical Co. - Key offerings
Dow Chemical Co. - Segment focus
SWOT

15.9 Equinor ASA

Equinor ASA - Overview
Equinor ASA - Business segments
Equinor ASA - Key offerings
Equinor ASA - Segment focus
SWOT

15.10 Exxon Mobil Corp.

Exxon Mobil Corp. - Overview
Exxon Mobil Corp. - Business segments
Exxon Mobil Corp. - Key news
Exxon Mobil Corp. - Key offerings
Exxon Mobil Corp. - Segment focus
SWOT

15.11 Halliburton Co.

Halliburton Co. - Overview
Halliburton Co. - Business segments
Halliburton Co. - Key news
Halliburton Co. - Key offerings
Halliburton Co. - Segment focus
SWOT

15.12 Occidental Petroleum Corp.

Occidental Petroleum Corp. - Overview
Occidental Petroleum Corp. - Business segments
Occidental Petroleum Corp. - Key offerings
Occidental Petroleum Corp. - Segment focus
SWOT

15.13 Petroleo Brasileiro SA

Petroleo Brasileiro SA - Overview
Petroleo Brasileiro SA - Business segments
Petroleo Brasileiro SA - Key offerings
Petroleo Brasileiro SA - Segment focus
SWOT

15.14 Petroliam Nasional Berhad

Petroliam Nasional Berhad - Overview
Petroliam Nasional Berhad - Business segments
Petroliam Nasional Berhad - Key offerings
Petroliam Nasional Berhad - Segment focus
SWOT

15.15 Saudi Arabian Oil Co.

Saudi Arabian Oil Co. - Overview
Saudi Arabian Oil Co. - Business segments
Saudi Arabian Oil Co. - Key offerings
Saudi Arabian Oil Co. - Segment focus
SWOT

15.16 Shell plc

Shell plc - Overview
Shell plc - Business segments
Shell plc - Key offerings
Shell plc - Segment focus
SWOT

15.17 TechnipFMC plc

TechnipFMC plc - Overview
TechnipFMC plc - Business segments
TechnipFMC plc - Key offerings
TechnipFMC plc - Segment focus
SWOT

15.18 Weatherford International Plc

Weatherford International Plc - Overview
Weatherford International Plc - Business segments
Weatherford International Plc - Key offerings
Weatherford International Plc - Segment focus
SWOT

16. Appendix

16.1 Scope of the report

Market definition
Objectives
Notes and caveats

16.2 Inclusions and exclusions checklist

Inclusions checklist
Exclusions checklist

16.3 Currency conversion rates for US$

16.4 Research methodology

16.5 Data procurement

Information sources

16.6 Data validation

16.7 Validation techniques employed for market sizing

16.8 Data synthesis

16.9 360 degree market analysis

16.10 List of abbreviations

Research Methodology

Technavio presents a detailed picture of the market by way of study, synthesis, and summation of data from multiple sources. The analysts have presented the various facets of the market with a particular focus on identifying the key industry influencers. The data thus presented is comprehensive, reliable, and the result of extensive research, both primary and secondary.

INFORMATION SOURCES

Primary sources

  • Manufacturers and suppliers
  • Channel partners
  • Industry experts
  • Strategic decision makers

Secondary sources

  • Industry journals and periodicals
  • Government data
  • Financial reports of key industry players
  • Historical data
  • Press releases

DATA ANALYSIS

Data Synthesis

  • Collation of data
  • Estimation of key figures
  • Analysis of derived insights

Data Validation

  • Triangulation with data models
  • Reference against proprietary databases
  • Corroboration with industry experts

REPORT WRITING

Qualitative

  • Market drivers
  • Market challenges
  • Market trends
  • Five forces analysis

Quantitative

  • Market size and forecast
  • Market segmentation
  • Geographical insights
  • Competitive landscape

Interested in this report?

Get your sample now to see our research methodology and insights!

Download Now

Frequently Asked Questions

Enhanced Oil Recovery market growth will increase by USD 30098.8 million during 2026-2030.

The Enhanced Oil Recovery market is expected to grow at a CAGR of 9.1% during 2026-2030.

Enhanced Oil Recovery market is segmented by Technology (Thermal injection, Gas injection, Chemical injection, Others) Application (Onshore, Offshore) Type (Sandstone reservoirs, Carbonate reservoirs, Shale formations)

Abu Dhabi National Oil Co., Baker Hughes Co., BASF SE, BY ZL GROUP, ChampionX Corp., Chevron Corp., China National Petroleum Corp., Clariant International Ltd., Core Laboratories NV, Dow Chemical Co., Equinor ASA, Exxon Mobil Corp., Halliburton Co., Occidental Petroleum Corp., Petroleo Brasileiro SA, Petroliam Nasional Berhad, Saudi Arabian Oil Co., Shell plc, SNF Group, TechnipFMC plc, Weatherford International Plc are a few of the key vendors in the Enhanced Oil Recovery market.

North America will register the highest growth rate of 38.4% among the other regions. Therefore, the Enhanced Oil Recovery market in North America is expected to garner significant business opportunities for the vendors during the forecast period.

US, Canada, Mexico, UK, Germany, France, Italy, Spain, The Netherlands, China, India, Japan, South Korea, Australia, Indonesia, Saudi Arabia, UAE, Turkey, South Africa, Israel, Brazil, Argentina, Chile

  • Maximizing mature field production potential is the driving factor this market.

The Enhanced Oil Recovery market vendors should focus on grabbing business opportunities from the Technology segment as it accounted for the largest market share in the base year.
RIA - Research AI Assistant
Ask RIA