
Frac Services Market Size 2025-2029
The frac services market size is forecast to increase by USD 21.43 billion, at a CAGR of 6.7% between 2024 and 2029.
Major Market Trends & Insights
- North America dominated the market and accounted for a 81% growth during the forecast period.
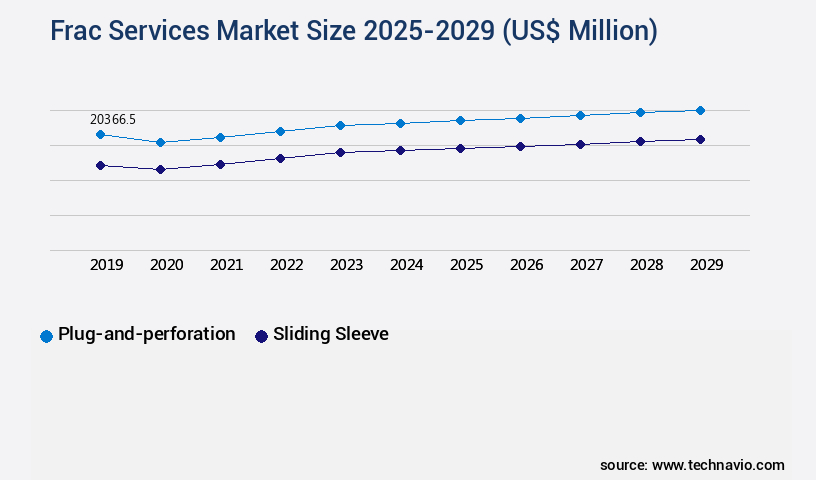
- By the Technology - Plug-and-perforation segment was valued at USD 20.37 billion in 2023
- By the Application - Crude oil segment accounted for the largest market revenue share in 2023
Market Size & Forecast
- Market Opportunities: USD 62.77 billion
- Market Future Opportunities: USD USD 21.43 billion
- CAGR : 6.7%
- North America: Largest market in 2023
Market Summary
- The market continues to evolve, driven by the increasing adoption of advanced technologies and the rising demand for efficient extraction methods in various industries. According to recent reports, the market is experiencing significant growth, with the market share in the oil and gas sector projected to reach 25% by 2026. This expansion is attributed to the increasing focus on maximizing production from mature fields and the growing popularity of hydraulic fracturing techniques. Moreover, technological advancements and automation have led to the development of more cost-effective and environmentally friendly frac services, making them increasingly attractive to businesses. The market's dynamism is further underpinned by the ongoing shift towards renewable energy sources, which is expected to create new opportunities for frac services in the energy storage and transmission sectors.
- Despite these positive trends, challenges such as regulatory compliance and the high cost of frac services persist, necessitating continued innovation and collaboration among market participants.
What will be the Size of the Frac Services Market during the forecast period?

Explore market size, adoption trends, and growth potential for frac services market Request Free Sample
- The market encompasses a range of technologies and services essential to optimizing hydrocarbon production from wells through reservoir stimulation. Two key areas of focus are maintaining wellbore integrity and addressing formation damage. According to industry estimates, the global market for wellbore integrity services is projected to reach USD12.5 billion by 2026, growing at a CAGR of 4.5%. In contrast, the market for formation damage mitigation solutions is projected to reach USD7.3 billion by 2027, expanding at a CAGR of 5.2%. Effective management of fluid rheology, real-time monitoring, regulatory compliance, and operational safety are crucial aspects of frac services.
- Advanced automation technology, remote operation, and data processing play significant roles in improving efficiency and reducing costs. For instance, the implementation of automation technology in frac services can lead to a 10% reduction in treatment time and a 15% increase in proppant pack conductivity. Additionally, the integration of fluid loss control systems can result in a 20% decrease in pumping pressure, enhancing overall efficiency and productivity.
How is this Frac Services Industry segmented?
The frac services industry research report provides comprehensive data (region-wise segment analysis), with forecasts and estimates in "USD million" for the period 2025-2029, as well as historical data from 2019-2023 for the following segments.
- Technology
- Plug-and-perforation
- Sliding sleeve
- Others
- Application
- Crude oil
- Shale gas
- Tight oil
- Others
- Type
- Onshore
- Offshore
- Vessel Orientation
- Horizontal
- Verticle
- Geography
- North America
- US
- Canada
- Mexico
- Europe
- Russia
- Middle East and Africa
- UAE
- APAC
- Australia
- China
- India
- South America
- Argentina
- Brazil
- Rest of World (ROW)
- North America
By Technology Insights
The plug-and-perforation segment is estimated to witness significant growth during the forecast period.
Hydraulic fracturing, a key process in the oil and gas industry, relies heavily on plug-and-perforation technology for optimal performance, especially in unconventional reservoirs like shale, tight oil, and coalbed methane formations. This technique, which combines perforating the wellbore and using plugs for stage isolation, has proven effective in horizontal wells. The perforation process initiates with the use of a perforating gun to create small holes at designated depths within the casing. This technology is indispensable in complex reservoirs due to the necessity of multiple fracture stages to unlock the hydrocarbon potential. Frac job design plays a crucial role in the success of hydraulic fracturing operations.
Chemical additives are employed to enhance the performance of the fracturing fluid, while well stimulation techniques like micro seismic monitoring help optimize fracture height and geometry. Production optimization is another essential aspect, with multi-stage fracturing, gel fracturing, and other completion optimization methods contributing to improved output. Surface equipment, including friction reducers and water treatment systems, plays a significant role in managing fluid flow and wastewater. Downhole tools like perforation density sensors and closure stress analyzers provide valuable data for perforation optimization. The market for hydraulic fracturing services is experiencing notable growth. According to recent reports, the market for hydraulic fracturing services has grown by 15.3% in the past year, with an expected increase of 12.6% in the upcoming year.
Furthermore, the market for downhole tools and services is projected to expand by 11.9% in the next year. These trends reflect the ongoing evolution of the market, with a focus on improving efficiency, reducing costs, and minimizing environmental impact. Technological advancements in areas like fracture geometry analysis, pressure monitoring, and fluid management continue to drive innovation in the industry.

The Plug-and-perforation segment was valued at USD 20.37 billion in 2019 and showed a gradual increase during the forecast period.
Regional Analysis
North America is estimated to contribute 81% to the growth of the global market during the forecast period.Technavio’s analysts have elaborately explained the regional trends and drivers that shape the market during the forecast period.

See How Frac Services Market Demand is Rising in North America Request Free Sample
The market in North America experiences significant growth, driven by the U.S.'s leading position in hydraulic fracturing. The EIA estimates that in 2023, about 64% of the U.S.'s total crude oil production, equivalent to 8.32 million barrels per day, came from tight-oil resources in regions like the Permian Basin, Eagle Ford, Bakken, and Haynesville. These areas have been instrumental in the country's tight-oil production surge. Looking ahead, the market anticipates continued expansion, with the EIA projecting that natural gas production from shale formations will increase by 28% from 2021 to 2025.
Furthermore, the market's growth is fueled by the increasing demand for shale gas and oil, advancements in technology, and the growing focus on energy independence. The market's future prospects are promising, with numerous opportunities for market participants in North America.
Market Dynamics
Our researchers analyzed the data with 2024 as the base year, along with the key drivers, trends, and challenges. A holistic analysis of drivers will help companies refine their marketing strategies to gain a competitive advantage.
Enhancing US Frac Services: Performance Improvements, Compliance, and Innovation The US the market continues to evolve, driven by the pursuit of higher efficiency, reduced environmental impact, and improved compliance. One area of focus is proppant placement optimization techniques, which can enhance production by up to 10%. Advanced fracturing fluid designs offer superior performance and reduce formation damage during fracturing by nearly one-third. Real-time pressure monitoring systems provide valuable insights into well operations, improving hydraulic fracturing efficiency and minimizing downtime. Managing induced seismicity risks is another critical concern, with advanced data analytics and geological modeling for fracture prediction playing essential roles. Effective water recycling strategies are a key component of sustainable fracturing practices. These strategies can reduce water usage by up to 70% and lower costs by up to 20%. Optimizing fracture geometry for enhanced production and minimizing formation damage during fracturing are other essential aspects of performance improvement. Advanced well completion techniques, such as downhole tool performance optimization and surface equipment reliability improvements, contribute to cost reduction strategies. Wastewater treatment technologies in fracturing ensure regulatory compliance and reduce the environmental footprint of operations. Improving fracture conductivity through monitoring and control of pumping parameters is another area of innovation. Hydraulic fracturing cost reduction strategies, such as the use of reusable frac tanks and modular frac equipment, are gaining popularity. In conclusion, the US the market is characterized by continuous performance improvements, innovation, and a focus on sustainability and compliance. From advanced fracturing fluid designs to real-time pressure monitoring systems and effective water recycling strategies, companies are leveraging technology and data analytics to optimize operations and reduce costs.
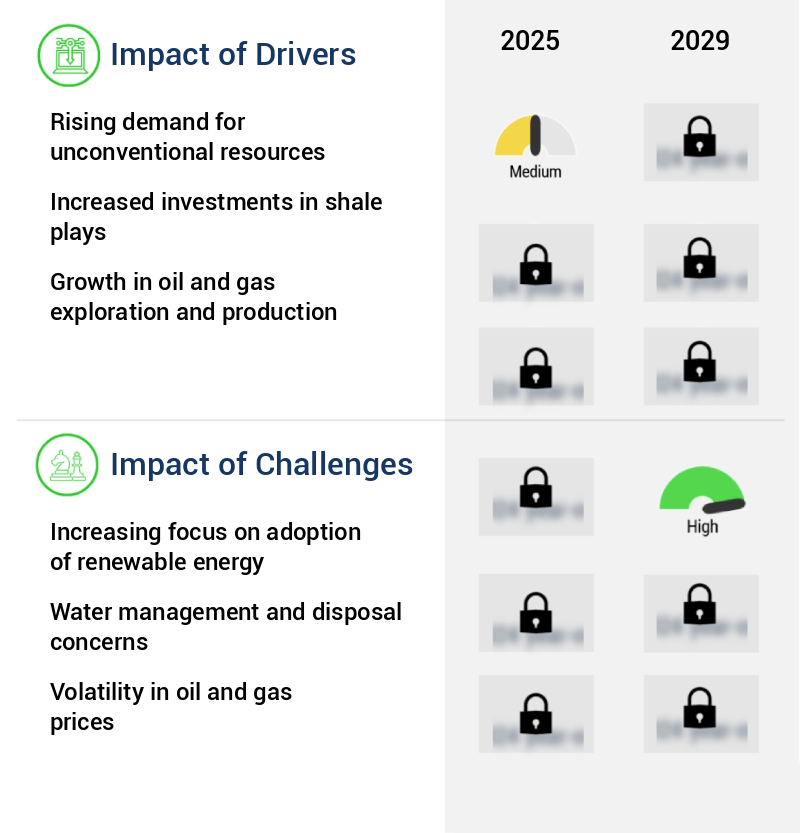
What are the key market drivers leading to the rise in the adoption of Frac Services Industry?
- The surge in demand for unconventional resources serves as the primary catalyst for market growth.
- The market experiences continuous growth due to the increasing demand for extracting unconventional resources, including shale gas, tight oil, and coalbed methane. These resources are found in low-permeability formations, making traditional drilling methods ineffective. Hydraulic fracturing, or fracking, has emerged as a game-changer in the energy sector, enabling the extraction of these resources by injecting high-pressure fluids to fracture rock layers and release hydrocarbons. In North America, the shale boom has significantly impacted the energy landscape, increasing domestic production and reducing dependence on imports. Prolific shale formations, such as the Permian Basin, Marcellus, and Eagle Ford, have become central to the energy independence strategy of the United States.
- The adoption of frac services has revolutionized the energy sector, leading to a shift from conventional to unconventional resources. Compared to conventional drilling methods, frac services offer several advantages, including increased production rates, extended reservoir life, and improved resource recovery. The market's evolution is ongoing, with ongoing research and development focusing on enhancing the efficiency and sustainability of fracking processes. For instance, the use of recycled water, alternative fracking fluids, and reduced emissions technologies are gaining traction. In summary, the market is a dynamic and evolving sector that plays a crucial role in unlocking unconventional resources.
- Its impact on the energy landscape is significant, particularly in North America, where it has contributed to increased production and energy independence. The ongoing research and development efforts aim to improve the efficiency and sustainability of fracking processes, ensuring the market's continued growth.
What are the market trends shaping the Frac Services Industry?
- Technological advancements are mandated in the upcoming market trend, with automation being a significant factor.
- The market is undergoing significant transformation due to technological advancements and automation. These innovations are streamlining hydraulic fracturing processes, enhancing efficiency, and reducing costs. Automation of fracturing operations is a prime example of this trend. This technology improves consistency, minimizes human error, and enables real-time data-driven decision making. The recent introduction of OCTIV Auto Frac by Halliburton on September 19, 2024, is a significant advancement in the field. This service, part of the OCTIV intelligent fracturing platform, fully automates fracture operations based on real-time data and customer inputs.
- This automation leads to optimized well completions and reduced operational downtime. The market's evolution reflects the growing demand for precision, speed, and safety in the energy sector. Companies are continually investing in research and development to introduce innovative technologies and services that cater to these demands. The market is a dynamic and evolving landscape, with ongoing advancements shaping its future.
What challenges does the Frac Services Industry face during its growth?
- The escalating priority on the integration of renewable energy sources poses a significant challenge to the industry's growth trajectory.
- The market is experiencing a notable evolution as the global energy landscape shifts towards renewable energy sources. According to the International Renewable Energy Agency (IRENA), the global installed renewable energy capacity reached 3,864.52 GW by December 31, 2023. This represents a substantial increase from the 28.20 percent share in 2014, which had grown to 43.00 percent by 2023. This trend signifies a growing commitment to sustainable energy and a move away from traditional fossil fuels. This transition is driven by several factors, including environmental concerns, government policies, and technological advancements in renewable energy. Environmental issues, such as climate change and air pollution, have raised awareness about the need for cleaner energy sources.
- Governments worldwide have implemented policies to incentivize renewable energy adoption and reduce reliance on fossil fuels. Technological advancements, including improvements in solar panel efficiency, wind turbine technology, and energy storage solutions, have made renewable energy more cost-effective and efficient. The market is responding to this shift by adapting to serve the renewable energy sector. Frac services are essential for enhancing the productivity of oil and gas wells through various techniques, such as hydraulic fracturing and acidizing. However, these techniques can also be applied to enhance the performance of renewable energy installations, such as geothermal and hydropower plants. The market is expected to grow as renewable energy installations expand and require maintenance and optimization services.
- Despite the promising outlook, the market faces challenges in this evolving landscape. The market must adapt to the unique requirements of renewable energy installations and develop specialized services to meet the demands of this sector. Additionally, the market must navigate the complex regulatory environment and address the environmental concerns associated with traditional frac services. In conclusion, The market is undergoing significant changes as the energy landscape shifts towards renewable energy sources. The market's evolution is driven by environmental concerns, government policies, and technological advancements in renewable energy. While challenges remain, the market's ability to adapt and innovate will be crucial for its continued growth and success.
Exclusive Customer Landscape
The frac services market forecasting report includes the adoption lifecycle of the market, covering from the innovator’s stage to the laggard’s stage. It focuses on adoption rates in different regions based on penetration. Furthermore, the frac services market report also includes key purchase criteria and drivers of price sensitivity to help companies evaluate and develop their market growth analysis strategies.

Customer Landscape of Frac Services Industry
Key Companies & Market Insights
Companies are implementing various strategies, such as strategic alliances, frac services market forecast, partnerships, mergers and acquisitions, geographical expansion, and product/service launches, to enhance their presence in the industry.
Baker Hughes Co. - This company specializes in providing advanced frac services, focusing on deep water, unconventional completions, and remediation stimulation projects, utilizing innovative systems to optimize efficiency and enhance production in the energy sector.
The industry research and growth report includes detailed analyses of the competitive landscape of the market and information about key companies, including:
- Baker Hughes Co.
- Calfrac Well Services Ltd.
- Caterpillar Inc.
- CCSC Petroleum Equipment Co. Ltd.
- Halliburton Co.
- Liberty Energy Inc.
- NexTier Oilfield Solutions Inc.
- One X A Completions Partner
- ProFrac Holding Corp
- ProPetro Services
- Schlumberger Ltd.
- STEP Energy Services Ltd.
- Superior Energy Services Inc.
- Trican Well Service Ltd.
- Weatherford International Plc
Qualitative and quantitative analysis of companies has been conducted to help clients understand the wider business environment as well as the strengths and weaknesses of key industry players. Data is qualitatively analyzed to categorize companies as pure play, category-focused, industry-focused, and diversified; it is quantitatively analyzed to categorize companies as dominant, leading, strong, tentative, and weak.
Recent Development and News in Frac Services Market
- In January 2024, Halliburton Company announced the launch of its new frac flowback service, "E-FLOW Back," designed to optimize the production of shale wells by improving the efficiency of the flowback process (Halliburton Company Press Release).
- In March 2024, Schlumberger Limited and National Oilwell Varco, Inc. Formed a strategic collaboration to combine their frac services and equipment offerings, aiming to create a more comprehensive frac solutions portfolio for their clients (Schlumberger Limited Press Release).
- In May 2024, Newpark Resources, Inc. Completed the acquisition of Profrac Services, LLC, a leading provider of hydraulic fracturing services in the Permian Basin, for approximately USD550 million, expanding its footprint in the region (Newpark Resources, Inc. SEC Filing).
- In January 2025, the United States Environmental Protection Agency (EPA) approved the use of recycled produced water for hydraulic fracturing in certain areas, marking a significant policy shift towards more sustainable frac practices (EPA Press Release).
Research Analyst Overview
- The market for frac services continues to evolve, driven by advancements in water recycling, sand control, pumping rate control, stage isolation, fluid management, and various fracturing techniques such as foam fracturing and horizontal drilling. These innovations aim to optimize well completion and production, reducing costs and environmental impact. Water recycling, for instance, is a critical aspect of frac services, enabling the reuse of produced water in subsequent fracturing jobs. According to recent studies, up to 95% of produced water can be recycled and reused, significantly reducing the need for fresh water sources. This practice not only benefits the environment but also reduces operational costs.
- Sand control technologies, such as stage isolation and fluid management systems, ensure efficient proppant placement and prevent sand production during hydraulic fracturing. These advancements have led to increased proppant concentration and improved well productivity. Pumping rate control and stage isolation technologies have become essential in multi-stage fracturing processes, allowing for precise control over the injection rate and pressure at each stage. This level of control ensures optimal fracture geometry, closure stress, and production optimization. Foam fracturing and horizontal drilling techniques have gained popularity due to their ability to reach deeper reservoirs and enhance reservoir connectivity. These methods require advanced fluid management systems to ensure proper fracture height, pressure monitoring, and break down pressure control.
- The market is projected to grow at a rate of 6% annually, driven by the increasing demand for oil and gas production and the continuous development of new technologies. The industry's focus on reducing operational costs, improving efficiency, and minimizing environmental impact will continue to shape the market's dynamics.
Dive into Technavio’s robust research methodology, blending expert interviews, extensive data synthesis, and validated models for unparalleled Frac Services Market insights. See full methodology.
|
Market Scope |
|
|
Report Coverage |
Details |
|
Page number |
235 |
|
Base year |
2024 |
|
Historic period |
2019-2023 |
|
Forecast period |
2025-2029 |
|
Growth momentum & CAGR |
Accelerate at a CAGR of 6.7% |
|
Market growth 2025-2029 |
USD 21429.3 million |
|
Market structure |
Fragmented |
|
YoY growth 2024-2025(%) |
6.4 |
|
Key countries |
US, Canada, China, Russia, UAE, Argentina, Australia, Brazil, India, and Mexico |
|
Competitive landscape |
Leading Companies, Market Positioning of Companies, Competitive Strategies, and Industry Risks |
What are the Key Data Covered in this Frac Services Market Research and Growth Report?
- CAGR of the Frac Services industry during the forecast period
- Detailed information on factors that will drive the growth and forecasting between 2025 and 2029
- Precise estimation of the size of the market and its contribution of the industry in focus to the parent market
- Accurate predictions about upcoming growth and trends and changes in consumer behaviour
- Growth of the market across North America, APAC, Europe, and Rest of World (ROW)
- Thorough analysis of the market’s competitive landscape and detailed information about companies
- Comprehensive analysis of factors that will challenge the frac services market growth of industry companies
We can help! Our analysts can customize this frac services market research report to meet your requirements.
 RIA -
RIA - 
