Driver Assistance Systems Market Analysis, Size, and Forecast 2026-2030: North America (US, Canada, and Mexico), APAC (China, Japan, and India), Europe (Germany, UK, and France), Middle East and Africa (Saudi Arabia, UAE, and South Africa), South America (Brazil, Argentina, and Colombia), and Rest of World (ROW)

Driver Assistance Systems Market Analysis, Size, and Forecast 2026-2030:
North America (US, Canada, and Mexico), APAC (China, Japan, and India), Europe (Germany, UK, and France), Middle East and Africa (Saudi Arabia, UAE, and South Africa), South America (Brazil, Argentina, and Colombia), and Rest of World (ROW)

Published: Jan 2026 306 Pages SKU: IRTNTR81233

Market Overview at a Glance

$45.49 B
Market Opportunity
11.8%
CAGR 2025 - 2030
35.4%
North America Growth
$40.41 B
Hardware segment 2024

Driver Assistance Systems Market Size 2026-2030

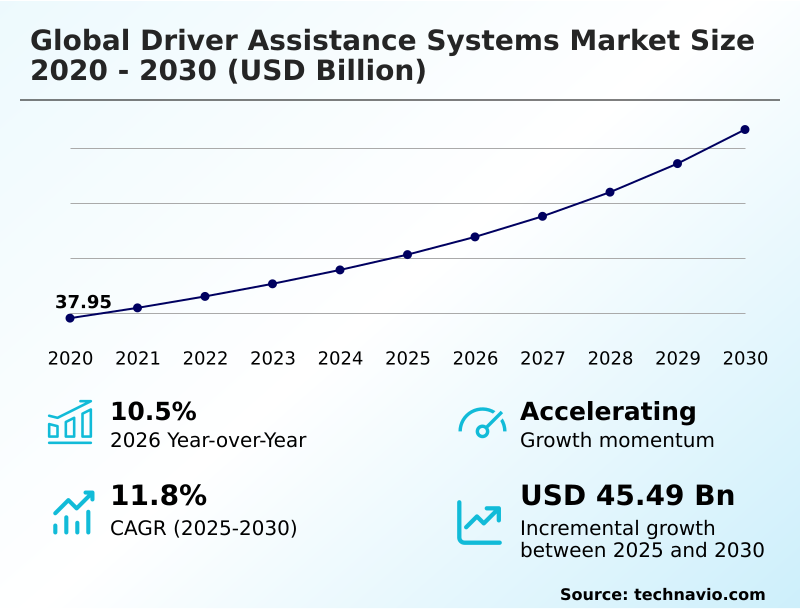
The driver assistance systems market size is valued to increase by USD 45.49 billion, at a CAGR of 11.8% from 2025 to 2030. Stringent government regulations and evolving safety standards will drive the driver assistance systems market.

Major Market Trends & Insights

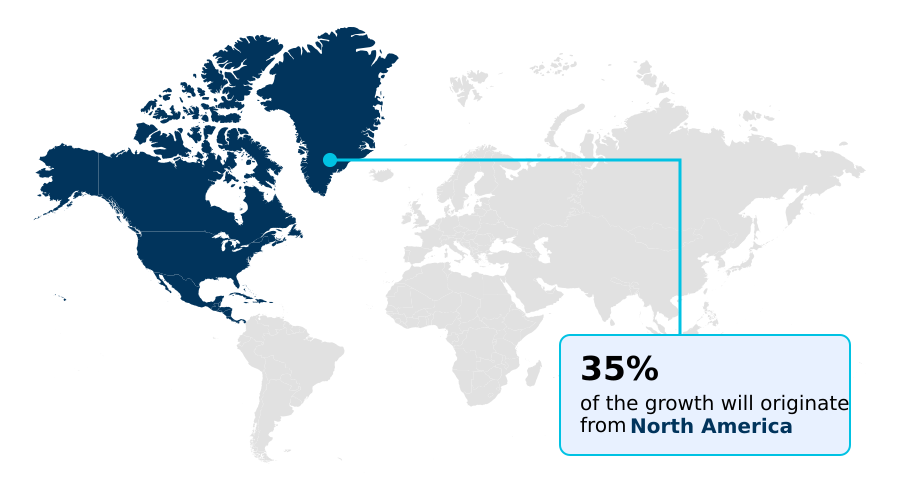
  • North America dominated the market and accounted for a 35.4% growth during the forecast period.
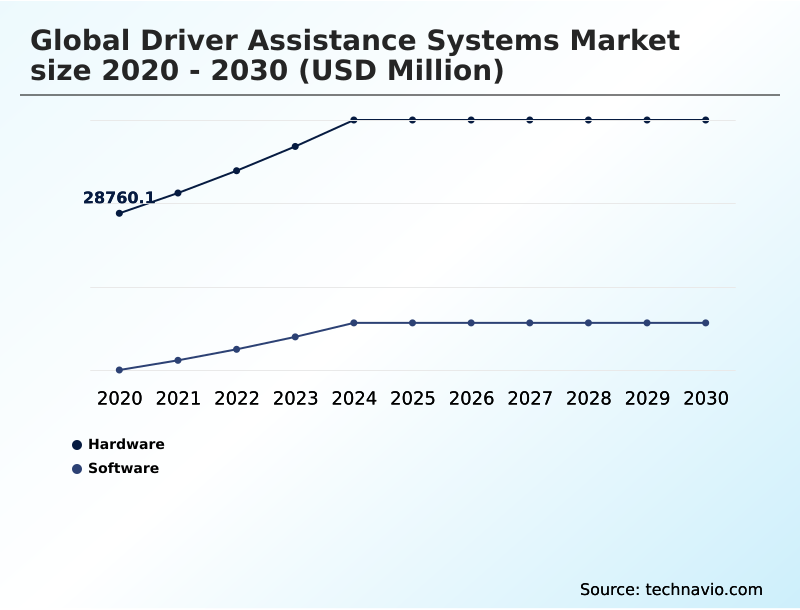
  • By Component - Hardware segment was valued at USD 40.41 billion in 2024
  • By Type - Adaptive cruise control segment accounted for the largest market revenue share in 2024

Market Size & Forecast

  • Market Opportunities: USD 68.60 billion
  • Market Future Opportunities: USD 45.49 billion
  • CAGR from 2025 to 2030 : 11.8%

Market Summary

  • The driver assistance systems market is undergoing a significant transformation, moving beyond basic warnings to active vehicle control and predictive intervention. This evolution is driven by the convergence of stringent safety regulations and rising consumer demand for intelligent, convenient features.
  • A pivotal trend is the architectural shift toward software-defined vehicles, which rely on centralized domain controllers and high-performance system-on-chips to process vast amounts of sensor data in real time. This enables the continuous improvement of functions like highway piloting and automated parking through over-the-air updates.
  • However, the industry grapples with challenges related to the high cost of implementation and the complexity of sensor recalibration after minor accidents. For instance, logistics companies are navigating this by adopting modular active safety technologies that enhance fleet safety and operational efficiency by reducing accident-related downtime, balancing the initial investment against long-term risk mitigation and lower insurance premiums.
  • The integration of deep learning algorithms is critical for overcoming these hurdles, particularly in validating system performance against unpredictable edge cases and ensuring reliability in adverse weather conditions.

What will be the Size of the Driver Assistance Systems Market during the forecast period?

Get Key Insights on Market Forecast (PDF) Request Free Sample

How is the Driver Assistance Systems Market Segmented?

The driver assistance systems industry research report provides comprehensive data (region-wise segment analysis), with forecasts and estimates in "USD million" for the period 2026-2030, as well as historical data from 2020-2024 for the following segments.

  • Component
    • Hardware
    • Software
  • Type
    • Adaptive cruise control
    • Automatic emergency braking
    • Lane departure warning
    • Blind spot detection
    • Others
  • Vehicle type
    • Passenger cars
    • Commercial vehicles
  • Geography
    • North America
      • US
      • Canada
      • Mexico
    • APAC
      • China
      • Japan
      • India
    • Europe
      • Germany
      • UK
      • France
    • Middle East and Africa
      • Saudi Arabia
      • UAE
      • South Africa
    • South America
      • Brazil
      • Argentina
      • Colombia
    • Rest of World (ROW)

By Component Insights

The hardware segment is estimated to witness significant growth during the forecast period.

The hardware segment forms the physical backbone, including a suite of sensors such as high-definition cameras, ultrasonic sensors, and increasingly, light detection and ranging (LiDAR).

The evolution from distributed electronic control units (ECU) to centralized domain controllers is reshaping vehicle architecture, demanding greater processing power for real-time data analysis.

Advancements in 4D imaging radar and solid-state LiDAR are expanding the total addressable market by improving perception capabilities.

However, this complexity affects the total cost of ownership, as the need for precise sensor recalibration following minor incidents has driven repair expenses up by over 30% for some equipped models.

OEMs focus on managing bill-of-materials costs through economies of scale, balancing the integration of advanced hardware with consumer price sensitivity and the need for high safety ratings.

Request Free Sample

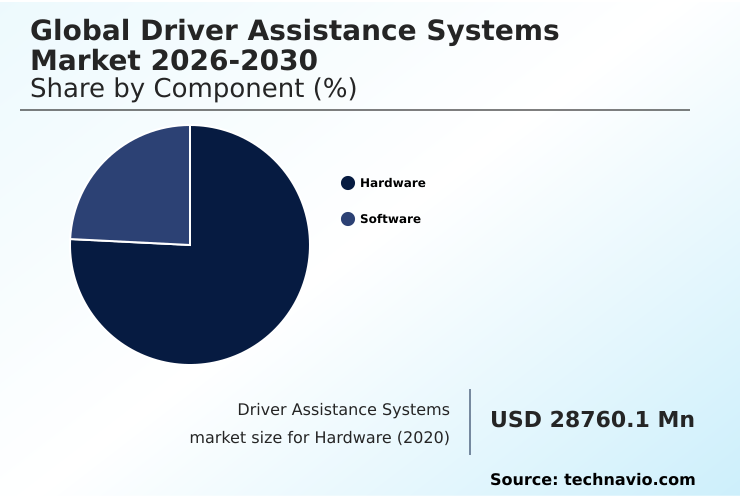
The Hardware segment was valued at USD 40.41 billion in 2024 and showed a gradual increase during the forecast period.

Request Free Sample

Regional Analysis

North America is estimated to contribute 35.4% to the growth of the global market during the forecast period.Technavio’s analysts have elaborately explained the regional trends and drivers that shape the market during the forecast period.

See How Driver Assistance Systems Market Demand is Rising in North America Request Free Sample

The geographic landscape is diverse, with regions prioritizing different active safety technologies. Europe leads in mandating vulnerable road user protection and driver monitoring systems, fostering the development of Level 3 autonomy within a defined operational design domain.

In North America, consumer demand for convenience drives high adoption of hands-free driving. APAC is a hub for rapid innovation, using synthetic data training to adapt automatic emergency braking for dense urban traffic.

In commercial sectors, features like active side guard assist and trailer sway control are crucial, with adoption in some fleets reducing side-collision incidents by 20%.

In contrast, markets in South America are standardizing foundational systems like electronic stability control and hill-start assist, while specialized features like pro trailer backup assist gain traction in utility vehicle segments.

Market Dynamics

Our researchers analyzed the data with 2025 as the base year, along with the key drivers, trends, and challenges. A holistic analysis of drivers will help companies refine their marketing strategies to gain a competitive advantage.

  • Strategic decisions within the global driver assistance systems market 2026-2030 are increasingly influenced by nuanced technical and operational factors. The discussion around lane departure warning vs lane keeping highlights the industry's progression from passive alerts to active intervention, a shift mirrored in the development of automatic emergency braking for pedestrians and adaptive cruise control with stop-and-go functionality.
  • The benefits of 4D imaging radar are becoming evident in its ability to enhance sensor fusion for urban driving. As vehicles evolve, the debate over centralized vs distributed ECU architecture is central to enabling the software-defined vehicle, with zonal architecture in electric vehicles emerging as a dominant trend.
  • This architecture facilitates OTA updates for safety systems but also amplifies the importance of cybersecurity in software-defined vehicles and ensuring GDPR compliance for driver data. Operationally, the cost of ADAS sensor recalibration has become a significant factor for insurers and repair networks, with costs for Level 2 systems rising more than 25% faster than for non-equipped vehicles.
  • This impacts everything from the optimal blind spot detection sensor location to the methods for validating ADAS against edge cases. Persistent issues like phantom braking causes and solutions and poor LiDAR performance in heavy rain continue to drive R&D.
  • Furthermore, the growth of Level 2 highway driving assist and AI in in-cabin sensing systems, especially for driver monitoring for drowsiness detection, underscores the move toward more sophisticated, proactive safety measures, including V2X for collision avoidance and predictive speed assist using maps.

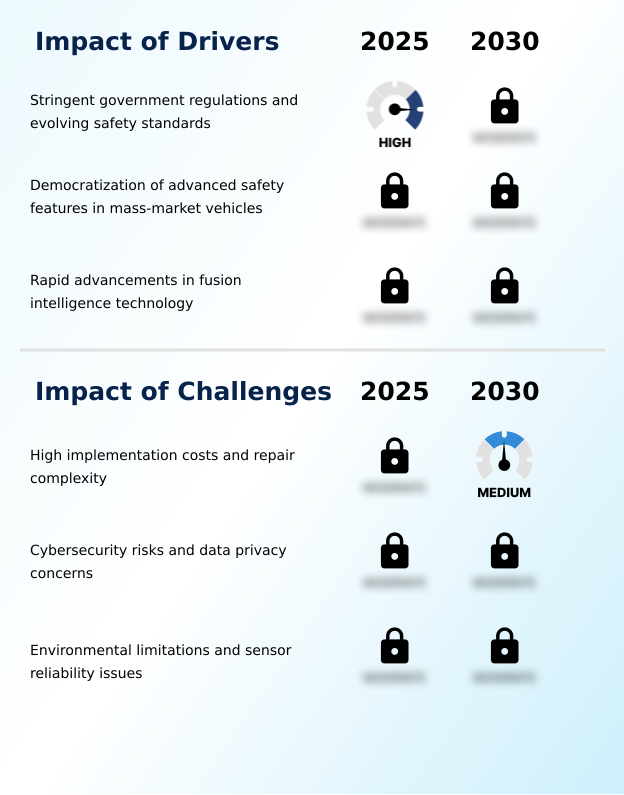
What are the key market drivers leading to the rise in the adoption of Driver Assistance Systems Industry?

  • Stringent government regulations and evolving safety standards are key drivers accelerating market adoption.

  • The democratization of advanced technologies is a primary driver, with features like adaptive cruise control, highway piloting, and surround-view monitoring becoming standard. This widespread adoption of Level 2 autonomy is expanding the market as consumers prioritize intelligent safety.
  • Innovations in deep learning algorithms enable predictive intervention, improving collision avoidance rates by up to 25% in complex scenarios. The relentless pace of innovation supports real-time data processing and future vehicle-to-everything communication.
  • Stringent regulatory compliance mandates, including intelligent speed assistance and pedal misapplication control, solidify market demand.
  • As automated parking features become more common, they help build consumer trust, which is essential for the acceptance of higher levels of automation and new mobility solutions.

What are the market trends shaping the Driver Assistance Systems Industry?

  • A key market trend is the transition toward centralized zonal architectures, which enables the development of software-defined vehicles.

  • The market is experiencing a structural shift toward zonal architectures, which are foundational to the software-defined vehicle. This enables manufacturers to deploy over-the-air updates, continuously improving features like hands-free driving and predictive speed assist. The proliferation of systems offering a hands-off, eyes-on experience leverages crowd-sourced fleet data to enhance navigation, with some platforms improving route efficiency by 15%.
  • Concurrently, the focus is expanding inward with advanced in-cabin sensing and smart cockpit features. Powered by human insight AI, these systems perform cognitive load analysis to ensure safe hand-over procedures from autonomous modes.
  • This evolution prioritizes occupant well-being, transforming the vehicle into a guardian that monitors driver readiness and health, a transition that has improved distraction detection accuracy by over 40%.

What challenges does the Driver Assistance Systems Industry face during its growth?

  • High implementation costs and the complexity of post-collision repairs present a key challenge affecting industry growth.

  • Significant challenges persist despite technological gains. Cybersecurity risks are paramount, as connectivity to the controller area network bus leads to attack surface expansion and data privacy concerns under frameworks like the General Data Protection Regulation.
  • The reliability of systems like pedestrian detection systems and blind spot detection in adverse environmental conditions remains a hurdle, with some reverse automatic emergency braking systems showing a failure rate increase of 60% in simulated winter conditions. Issues such as phantom braking, where sensor fusion misinterprets benign objects, erode consumer confidence.
  • The complexity of edge case validation for features like lane departure warning requires extensive testing to ensure systems perform reliably across all potential driving scenarios.

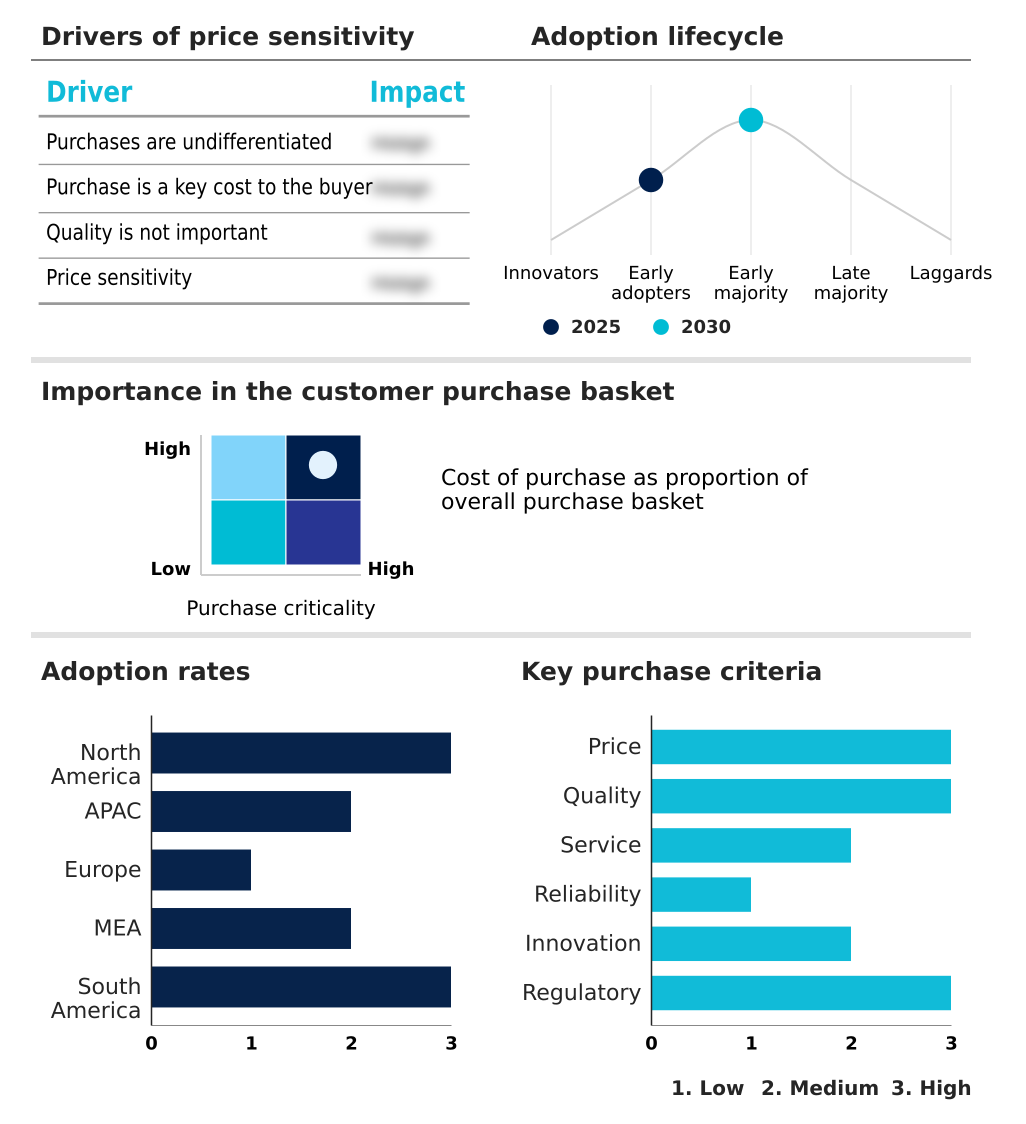
Exclusive Technavio Analysis on Customer Landscape

The driver assistance systems market forecasting report includes the adoption lifecycle of the market, covering from the innovator’s stage to the laggard’s stage. It focuses on adoption rates in different regions based on penetration. Furthermore, the driver assistance systems market report also includes key purchase criteria and drivers of price sensitivity to help companies evaluate and develop their market growth analysis strategies.

Customer Landscape of Driver Assistance Systems Industry

Competitive Landscape

Companies are implementing various strategies, such as strategic alliances, driver assistance systems market forecast, partnerships, mergers and acquisitions, geographical expansion, and product/service launches, to enhance their presence in the industry.

AISIN Corp. - Offerings include integrated systems with surround-view, emergency brake assist via radar/camera fusion, and advanced controllers for enhanced safety and automated driving.

The industry research and growth report includes detailed analyses of the competitive landscape of the market and information about key companies, including:

  • AISIN Corp.
  • Aptiv Plc
  • Autoliv Inc.
  • Continental AG
  • DENSO Corp.
  • Ficosa Internacional SA
  • HELLA GmbH and Co. KGaA
  • Hyundai Mobis Co. Ltd.
  • Infineon Technologies AG
  • Joyson Safety Systems GmbH
  • Magna International Inc.
  • Mobileye Technologies Ltd.
  • NVIDIA Corp.
  • Panasonic Holdings Corp.
  • Renesas Electronics Corp.
  • Robert Bosch GmbH
  • Texas Instruments Inc.
  • Valeo SA
  • Veoneer Inc.
  • ZF Friedrichshafen AG

Qualitative and quantitative analysis of companies has been conducted to help clients understand the wider business environment as well as the strengths and weaknesses of key industry players. Data is qualitatively analyzed to categorize companies as pure play, category-focused, industry-focused, and diversified; it is quantitatively analyzed to categorize companies as dominant, leading, strong, tentative, and weak.

Recent Development and News in Driver assistance systems market

  • In January, 2025, the National Highway Traffic Safety Administration issued a final confirmation on its automatic emergency braking mandate, solidifying the implementation timeline and compelling automakers to accelerate validation of next-generation braking algorithms.
  • In March, 2025, Mobileye launched its Surround ADAS platform, a scalable solution designed to bring hands-free Level 2 capabilities to mass-market vehicles using a cost-optimized camera suite and computing architecture.
  • In April, 2025, Qualcomm Technologies announced the commercial availability of its Snapdragon Digital Chassis solution, which integrates driver assistance and cockpit functions into a single system-on-chip to reduce costs and increase computational power.
  • In May, 2025, General Motors began rolling out its enhanced Ultra Cruise system, powered by a new central compute architecture developed with Qualcomm, capable of handling 95% of driving scenarios by processing data from over twenty sensors.

Dive into Technavio’s robust research methodology, blending expert interviews, extensive data synthesis, and validated models for unparalleled Driver Assistance Systems Market insights. See full methodology.

Market Scope
Page number 306
Base year 2025
Historic period 2020-2024
Forecast period 2026-2030
Growth momentum & CAGR Accelerate at a CAGR of 11.8%
Market growth 2026-2030 USD 45492.1 million
Market structure Fragmented
YoY growth 2025-2026(%) 10.5%
Key countries US, Canada, Mexico, China, Japan, India, South Korea, Australia, Indonesia, Germany, UK, France, Italy, The Netherlands, Spain, Saudi Arabia, UAE, South Africa, Israel, Turkey, Brazil, Argentina and Colombia
Competitive landscape Leading Companies, Market Positioning of Companies, Competitive Strategies, and Industry Risks

Request Free Sample

Research Analyst Overview

  • The driver assistance systems market is defined by a rapid technological churn, where the value proposition is migrating from hardware to intelligent software. The integration of active safety technologies like automatic emergency braking and lane departure warning is now table stakes, with differentiation shifting to the sophistication of sensor fusion and deep learning algorithms.
  • Boardroom decisions now center on the transition to zonal architectures and the software-defined vehicle, a move essential for deploying over-the-air updates and features like highway piloting. This requires mastering high-performance system-on-chips and centralized domain controllers. The adoption of 4D imaging radar, solid-state LiDAR, and high-definition cameras enhances perception, supporting functions from blind spot detection to vulnerable road user protection.
  • A key challenge is managing the controller area network bus to prevent issues like phantom braking. Advanced systems, including driver monitoring systems for in-cabin sensing and Level 3 autonomy, depend on synthetic data training and human insight AI.
  • The deployment of reverse automatic emergency braking and automated parking features showcases how systems utilizing ultrasonic sensors and predictive intervention improve safety, with some achieving a 40% reduction in low-speed incidents. The evolution toward hands-free driving and predictive speed assist marks the next frontier in Level 2 autonomy.

What are the Key Data Covered in this Driver Assistance Systems Market Research and Growth Report?

  • What is the expected growth of the Driver Assistance Systems Market between 2026 and 2030?

    • USD 45.49 billion, at a CAGR of 11.8%

  • What segmentation does the market report cover?

    • The report is segmented by Component (Hardware, and Software), Type (Adaptive cruise control, Automatic emergency braking, Lane departure warning, Blind spot detection, and Others), Vehicle Type (Passenger cars, and Commercial vehicles) and Geography (North America, APAC, Europe, Middle East and Africa, South America)

  • Which regions are analyzed in the report?

    • North America, APAC, Europe, Middle East and Africa and South America

  • What are the key growth drivers and market challenges?

    • Stringent government regulations and evolving safety standards, High implementation costs and repair complexity

  • Who are the major players in the Driver Assistance Systems Market?

    • AISIN Corp., Aptiv Plc, Autoliv Inc., Continental AG, DENSO Corp., Ficosa Internacional SA, HELLA GmbH and Co. KGaA, Hyundai Mobis Co. Ltd., Infineon Technologies AG, Joyson Safety Systems GmbH, Magna International Inc., Mobileye Technologies Ltd., NVIDIA Corp., Panasonic Holdings Corp., Renesas Electronics Corp., Robert Bosch GmbH, Texas Instruments Inc., Valeo SA, Veoneer Inc. and ZF Friedrichshafen AG

Market Research Insights

  • The market's dynamics are shaped by the rapid democratization of advanced features and the push for greater automation. As automakers compete on safety ratings, the adoption of sophisticated systems is accelerating across all vehicle segments, expanding the total addressable market.
  • This trend is supported by achieving economies of scale in sensor manufacturing, which has lowered bill-of-materials costs by over 10% for certain high-volume components. Concurrently, data privacy concerns and cybersecurity risks are shaping development, with platforms now engineered to meet stringent General Data Protection Regulation standards.
  • This focus on security has led to a 25% reduction in identified vulnerabilities in the latest generation of connected modules. Ensuring consumer trust through robust edge case validation and reliable performance in adverse environmental conditions remains a central focus, as functional dependability directly influences purchasing decisions and brand reputation.

We can help! Our analysts can customize this driver assistance systems market research report to meet your requirements.

Get in touch

1. Executive Summary

1.1 Market overview

Executive Summary - Chart on Market Overview
Executive Summary - Data Table on Market Overview
Executive Summary - Chart on Global Market Characteristics
Executive Summary - Chart on Market by Geography
Executive Summary - Chart on Market Segmentation by Component
Executive Summary - Chart on Market Segmentation by Type
Executive Summary - Chart on Market Segmentation by Vehicle Type
Executive Summary - Chart on Incremental Growth
Executive Summary - Data Table on Incremental Growth
Executive Summary - Chart on Company Market Positioning

2. Technavio Analysis

2.1 Analysis of price sensitivity, lifecycle, customer purchase basket, adoption rates, and purchase criteria

2.2 Criticality of inputs and Factors of differentiation

Chart on Overview on criticality of inputs and factors of differentiation

2.3 Factors of disruption

Chart on Overview on factors of disruption

2.4 Impact of drivers and challenges

Chart on Impact of drivers and challenges in 2025 and 2030

3. Market Landscape

3.1 Market ecosystem

Chart on Parent Market
Data Table on - Parent Market

3.2 Market characteristics

Chart on Market characteristics analysis

3.3 Value chain analysis

Chart on Value chain analysis

4. Market Sizing

4.1 Market definition

Data Table on Offerings of companies included in the market definition

4.2 Market segment analysis

Market segments

4.3 Market size 2025

4.4 Market outlook: Forecast for 2025-2030

Chart on Global - Market size and forecast 2025-2030 ($ million)
Data Table on Global - Market size and forecast 2025-2030 ($ million)
Chart on Global Market: Year-over-year growth 2025-2030 (%)
Data Table on Global Market: Year-over-year growth 2025-2030 (%)

5. Historic Market Size

5.1 Global Driver Assistance Systems Market 2020 - 2024

Historic Market Size - Data Table on Global Driver Assistance Systems Market 2020 - 2024 ($ million)

5.2 Component segment analysis 2020 - 2024

Historic Market Size - Component Segment 2020 - 2024 ($ million)

5.3 Type segment analysis 2020 - 2024

Historic Market Size - Type Segment 2020 - 2024 ($ million)

5.4 Vehicle Type segment analysis 2020 - 2024

Historic Market Size - Vehicle Type Segment 2020 - 2024 ($ million)

5.5 Geography segment analysis 2020 - 2024

Historic Market Size - Geography Segment 2020 - 2024 ($ million)

5.6 Country segment analysis 2020 - 2024

Historic Market Size - Country Segment 2020 - 2024 ($ million)

6. Qualitative Analysis

6.1 Impact of AI in global driver assistance systems market

7. Five Forces Analysis

7.1 Five forces summary

Five forces analysis - Comparison between 2025 and 2030

7.2 Bargaining power of buyers

Bargaining power of buyers - Impact of key factors 2025 and 2030

7.3 Bargaining power of suppliers

Bargaining power of suppliers - Impact of key factors in 2025 and 2030

7.4 Threat of new entrants

Threat of new entrants - Impact of key factors in 2025 and 2030

7.5 Threat of substitutes

Threat of substitutes - Impact of key factors in 2025 and 2030

7.6 Threat of rivalry

Threat of rivalry - Impact of key factors in 2025 and 2030

7.7 Market condition

Chart on Market condition - Five forces 2025 and 2030

8. Market Segmentation by Component

8.1 Market segments

Chart on Component - Market share 2025-2030 (%)
Data Table on Component - Market share 2025-2030 (%)

8.2 Comparison by Component

Chart on Comparison by Component
Data Table on Comparison by Component

8.3 Hardware - Market size and forecast 2025-2030

Chart on Hardware - Market size and forecast 2025-2030 ($ million)
Data Table on Hardware - Market size and forecast 2025-2030 ($ million)
Chart on Hardware - Year-over-year growth 2025-2030 (%)
Data Table on Hardware - Year-over-year growth 2025-2030 (%)

8.4 Software - Market size and forecast 2025-2030

Chart on Software - Market size and forecast 2025-2030 ($ million)
Data Table on Software - Market size and forecast 2025-2030 ($ million)
Chart on Software - Year-over-year growth 2025-2030 (%)
Data Table on Software - Year-over-year growth 2025-2030 (%)

8.5 Market opportunity by Component

Market opportunity by Component ($ million)
Data Table on Market opportunity by Component ($ million)

9. Market Segmentation by Type

9.1 Market segments

Chart on Type - Market share 2025-2030 (%)
Data Table on Type - Market share 2025-2030 (%)

9.2 Comparison by Type

Chart on Comparison by Type
Data Table on Comparison by Type

9.3 Adaptive cruise control - Market size and forecast 2025-2030

Chart on Adaptive cruise control - Market size and forecast 2025-2030 ($ million)
Data Table on Adaptive cruise control - Market size and forecast 2025-2030 ($ million)
Chart on Adaptive cruise control - Year-over-year growth 2025-2030 (%)
Data Table on Adaptive cruise control - Year-over-year growth 2025-2030 (%)

9.4 Automatic emergency braking - Market size and forecast 2025-2030

Chart on Automatic emergency braking - Market size and forecast 2025-2030 ($ million)
Data Table on Automatic emergency braking - Market size and forecast 2025-2030 ($ million)
Chart on Automatic emergency braking - Year-over-year growth 2025-2030 (%)
Data Table on Automatic emergency braking - Year-over-year growth 2025-2030 (%)

9.5 Lane departure warning - Market size and forecast 2025-2030

Chart on Lane departure warning - Market size and forecast 2025-2030 ($ million)
Data Table on Lane departure warning - Market size and forecast 2025-2030 ($ million)
Chart on Lane departure warning - Year-over-year growth 2025-2030 (%)
Data Table on Lane departure warning - Year-over-year growth 2025-2030 (%)

9.6 Blind spot detection - Market size and forecast 2025-2030

Chart on Blind spot detection - Market size and forecast 2025-2030 ($ million)
Data Table on Blind spot detection - Market size and forecast 2025-2030 ($ million)
Chart on Blind spot detection - Year-over-year growth 2025-2030 (%)
Data Table on Blind spot detection - Year-over-year growth 2025-2030 (%)

9.7 Others - Market size and forecast 2025-2030

Chart on Others - Market size and forecast 2025-2030 ($ million)
Data Table on Others - Market size and forecast 2025-2030 ($ million)
Chart on Others - Year-over-year growth 2025-2030 (%)
Data Table on Others - Year-over-year growth 2025-2030 (%)

9.8 Market opportunity by Type

Market opportunity by Type ($ million)
Data Table on Market opportunity by Type ($ million)

10. Market Segmentation by Vehicle Type

10.1 Market segments

Chart on Vehicle Type - Market share 2025-2030 (%)
Data Table on Vehicle Type - Market share 2025-2030 (%)

10.2 Comparison by Vehicle Type

Chart on Comparison by Vehicle Type
Data Table on Comparison by Vehicle Type

10.3 Passenger cars - Market size and forecast 2025-2030

Chart on Passenger cars - Market size and forecast 2025-2030 ($ million)
Data Table on Passenger cars - Market size and forecast 2025-2030 ($ million)
Chart on Passenger cars - Year-over-year growth 2025-2030 (%)
Data Table on Passenger cars - Year-over-year growth 2025-2030 (%)

10.4 Commercial vehicles - Market size and forecast 2025-2030

Chart on Commercial vehicles - Market size and forecast 2025-2030 ($ million)
Data Table on Commercial vehicles - Market size and forecast 2025-2030 ($ million)
Chart on Commercial vehicles - Year-over-year growth 2025-2030 (%)
Data Table on Commercial vehicles - Year-over-year growth 2025-2030 (%)

10.5 Market opportunity by Vehicle Type

Market opportunity by Vehicle Type ($ million)
Data Table on Market opportunity by Vehicle Type ($ million)

11. Customer Landscape

11.1 Customer landscape overview

Analysis of price sensitivity, lifecycle, customer purchase basket, adoption rates, and purchase criteria

12. Geographic Landscape

12.1 Geographic segmentation

Chart on Market share by geography 2025-2030 (%)
Data Table on Market share by geography 2025-2030 (%)

12.2 Geographic comparison

Chart on Geographic comparison
Data Table on Geographic comparison

12.3 North America - Market size and forecast 2025-2030

Chart on North America - Market size and forecast 2025-2030 ($ million)
Data Table on North America - Market size and forecast 2025-2030 ($ million)
Chart on North America - Year-over-year growth 2025-2030 (%)
Data Table on North America - Year-over-year growth 2025-2030 (%)
Chart on Regional Comparison - North America
Data Table on Regional Comparison - North America

12.3.1 US - Market size and forecast 2025-2030

Chart on US - Market size and forecast 2025-2030 ($ million)
Data Table on US - Market size and forecast 2025-2030 ($ million)
Chart on US - Year-over-year growth 2025-2030 (%)
Data Table on US - Year-over-year growth 2025-2030 (%)

12.3.2 Canada - Market size and forecast 2025-2030

Chart on Canada - Market size and forecast 2025-2030 ($ million)
Data Table on Canada - Market size and forecast 2025-2030 ($ million)
Chart on Canada - Year-over-year growth 2025-2030 (%)
Data Table on Canada - Year-over-year growth 2025-2030 (%)

12.3.3 Mexico - Market size and forecast 2025-2030

Chart on Mexico - Market size and forecast 2025-2030 ($ million)
Data Table on Mexico - Market size and forecast 2025-2030 ($ million)
Chart on Mexico - Year-over-year growth 2025-2030 (%)
Data Table on Mexico - Year-over-year growth 2025-2030 (%)

12.4 APAC - Market size and forecast 2025-2030

Chart on APAC - Market size and forecast 2025-2030 ($ million)
Data Table on APAC - Market size and forecast 2025-2030 ($ million)
Chart on APAC - Year-over-year growth 2025-2030 (%)
Data Table on APAC - Year-over-year growth 2025-2030 (%)
Chart on Regional Comparison - APAC
Data Table on Regional Comparison - APAC

12.4.1 China - Market size and forecast 2025-2030

Chart on China - Market size and forecast 2025-2030 ($ million)
Data Table on China - Market size and forecast 2025-2030 ($ million)
Chart on China - Year-over-year growth 2025-2030 (%)
Data Table on China - Year-over-year growth 2025-2030 (%)

12.4.2 Japan - Market size and forecast 2025-2030

Chart on Japan - Market size and forecast 2025-2030 ($ million)
Data Table on Japan - Market size and forecast 2025-2030 ($ million)
Chart on Japan - Year-over-year growth 2025-2030 (%)
Data Table on Japan - Year-over-year growth 2025-2030 (%)

12.4.3 India - Market size and forecast 2025-2030

Chart on India - Market size and forecast 2025-2030 ($ million)
Data Table on India - Market size and forecast 2025-2030 ($ million)
Chart on India - Year-over-year growth 2025-2030 (%)
Data Table on India - Year-over-year growth 2025-2030 (%)

12.4.4 South Korea - Market size and forecast 2025-2030

Chart on South Korea - Market size and forecast 2025-2030 ($ million)
Data Table on South Korea - Market size and forecast 2025-2030 ($ million)
Chart on South Korea - Year-over-year growth 2025-2030 (%)
Data Table on South Korea - Year-over-year growth 2025-2030 (%)

12.4.5 Australia - Market size and forecast 2025-2030

Chart on Australia - Market size and forecast 2025-2030 ($ million)
Data Table on Australia - Market size and forecast 2025-2030 ($ million)
Chart on Australia - Year-over-year growth 2025-2030 (%)
Data Table on Australia - Year-over-year growth 2025-2030 (%)

12.4.6 Indonesia - Market size and forecast 2025-2030

Chart on Indonesia - Market size and forecast 2025-2030 ($ million)
Data Table on Indonesia - Market size and forecast 2025-2030 ($ million)
Chart on Indonesia - Year-over-year growth 2025-2030 (%)
Data Table on Indonesia - Year-over-year growth 2025-2030 (%)

12.5 Europe - Market size and forecast 2025-2030

Chart on Europe - Market size and forecast 2025-2030 ($ million)
Data Table on Europe - Market size and forecast 2025-2030 ($ million)
Chart on Europe - Year-over-year growth 2025-2030 (%)
Data Table on Europe - Year-over-year growth 2025-2030 (%)
Chart on Regional Comparison - Europe
Data Table on Regional Comparison - Europe

12.5.1 Germany - Market size and forecast 2025-2030

Chart on Germany - Market size and forecast 2025-2030 ($ million)
Data Table on Germany - Market size and forecast 2025-2030 ($ million)
Chart on Germany - Year-over-year growth 2025-2030 (%)
Data Table on Germany - Year-over-year growth 2025-2030 (%)

12.5.2 UK - Market size and forecast 2025-2030

Chart on UK - Market size and forecast 2025-2030 ($ million)
Data Table on UK - Market size and forecast 2025-2030 ($ million)
Chart on UK - Year-over-year growth 2025-2030 (%)
Data Table on UK - Year-over-year growth 2025-2030 (%)

12.5.3 France - Market size and forecast 2025-2030

Chart on France - Market size and forecast 2025-2030 ($ million)
Data Table on France - Market size and forecast 2025-2030 ($ million)
Chart on France - Year-over-year growth 2025-2030 (%)
Data Table on France - Year-over-year growth 2025-2030 (%)

12.5.4 Italy - Market size and forecast 2025-2030

Chart on Italy - Market size and forecast 2025-2030 ($ million)
Data Table on Italy - Market size and forecast 2025-2030 ($ million)
Chart on Italy - Year-over-year growth 2025-2030 (%)
Data Table on Italy - Year-over-year growth 2025-2030 (%)

12.5.5 The Netherlands - Market size and forecast 2025-2030

Chart on The Netherlands - Market size and forecast 2025-2030 ($ million)
Data Table on The Netherlands - Market size and forecast 2025-2030 ($ million)
Chart on The Netherlands - Year-over-year growth 2025-2030 (%)
Data Table on The Netherlands - Year-over-year growth 2025-2030 (%)

12.5.6 Spain - Market size and forecast 2025-2030

Chart on Spain - Market size and forecast 2025-2030 ($ million)
Data Table on Spain - Market size and forecast 2025-2030 ($ million)
Chart on Spain - Year-over-year growth 2025-2030 (%)
Data Table on Spain - Year-over-year growth 2025-2030 (%)

12.6 Middle East and Africa - Market size and forecast 2025-2030

Chart on Middle East and Africa - Market size and forecast 2025-2030 ($ million)
Data Table on Middle East and Africa - Market size and forecast 2025-2030 ($ million)
Chart on Middle East and Africa - Year-over-year growth 2025-2030 (%)
Data Table on Middle East and Africa - Year-over-year growth 2025-2030 (%)
Chart on Regional Comparison - Middle East and Africa
Data Table on Regional Comparison - Middle East and Africa

12.6.1 Saudi Arabia - Market size and forecast 2025-2030

Chart on Saudi Arabia - Market size and forecast 2025-2030 ($ million)
Data Table on Saudi Arabia - Market size and forecast 2025-2030 ($ million)
Chart on Saudi Arabia - Year-over-year growth 2025-2030 (%)
Data Table on Saudi Arabia - Year-over-year growth 2025-2030 (%)

12.6.2 UAE - Market size and forecast 2025-2030

Chart on UAE - Market size and forecast 2025-2030 ($ million)
Data Table on UAE - Market size and forecast 2025-2030 ($ million)
Chart on UAE - Year-over-year growth 2025-2030 (%)
Data Table on UAE - Year-over-year growth 2025-2030 (%)

12.6.3 South Africa - Market size and forecast 2025-2030

Chart on South Africa - Market size and forecast 2025-2030 ($ million)
Data Table on South Africa - Market size and forecast 2025-2030 ($ million)
Chart on South Africa - Year-over-year growth 2025-2030 (%)
Data Table on South Africa - Year-over-year growth 2025-2030 (%)

12.6.4 Israel - Market size and forecast 2025-2030

Chart on Israel - Market size and forecast 2025-2030 ($ million)
Data Table on Israel - Market size and forecast 2025-2030 ($ million)
Chart on Israel - Year-over-year growth 2025-2030 (%)
Data Table on Israel - Year-over-year growth 2025-2030 (%)

12.6.5 Turkey - Market size and forecast 2025-2030

Chart on Turkey - Market size and forecast 2025-2030 ($ million)
Data Table on Turkey - Market size and forecast 2025-2030 ($ million)
Chart on Turkey - Year-over-year growth 2025-2030 (%)
Data Table on Turkey - Year-over-year growth 2025-2030 (%)

12.7 South America - Market size and forecast 2025-2030

Chart on South America - Market size and forecast 2025-2030 ($ million)
Data Table on South America - Market size and forecast 2025-2030 ($ million)
Chart on South America - Year-over-year growth 2025-2030 (%)
Data Table on South America - Year-over-year growth 2025-2030 (%)
Chart on Regional Comparison - South America
Data Table on Regional Comparison - South America

12.7.1 Brazil - Market size and forecast 2025-2030

Chart on Brazil - Market size and forecast 2025-2030 ($ million)
Data Table on Brazil - Market size and forecast 2025-2030 ($ million)
Chart on Brazil - Year-over-year growth 2025-2030 (%)
Data Table on Brazil - Year-over-year growth 2025-2030 (%)

12.7.2 Argentina - Market size and forecast 2025-2030

Chart on Argentina - Market size and forecast 2025-2030 ($ million)
Data Table on Argentina - Market size and forecast 2025-2030 ($ million)
Chart on Argentina - Year-over-year growth 2025-2030 (%)
Data Table on Argentina - Year-over-year growth 2025-2030 (%)

12.7.3 Colombia - Market size and forecast 2025-2030

Chart on Colombia - Market size and forecast 2025-2030 ($ million)
Data Table on Colombia - Market size and forecast 2025-2030 ($ million)
Chart on Colombia - Year-over-year growth 2025-2030 (%)
Data Table on Colombia - Year-over-year growth 2025-2030 (%)

12.8 Market opportunity by geography

Market opportunity by geography ($ million)
Data Tables on Market opportunity by geography ($ million)

13. Drivers, Challenges, and Opportunity

13.1 Market drivers

Stringent government regulations and evolving safety standards
Democratization of advanced safety features in mass-market vehicles
Rapid advancements in fusion intelligence technology

13.2 Market challenges

High implementation costs and repair complexity
Cybersecurity risks and data privacy concerns
Environmental limitations and sensor reliability issues

13.3 Impact of drivers and challenges

Impact of drivers and challenges in 2025 and 2030

13.4 Market opportunities

Transition toward centralized zonal architectures and software-defined vehicles
Convergence of active safety and comfort via level 2 systems
Integration of artificial intelligence in in-cabin monitoring systems

14. Competitive Landscape

14.1 Overview

14.2

Overview on criticality of inputs and factors of differentiation

14.3 Landscape disruption

Overview on factors of disruption

14.4 Industry risks

Impact of key risks on business

15. Competitive Analysis

15.1 Companies profiled

Companies covered

15.2 Company ranking index

15.3 Market positioning of companies

Matrix on companies position and classification

15.4 Aptiv Plc

Aptiv Plc - Overview
Aptiv Plc - Business segments
Aptiv Plc - Key news
Aptiv Plc - Key offerings
Aptiv Plc - Segment focus
SWOT

15.5 Autoliv Inc.

Autoliv Inc. - Overview
Autoliv Inc. - Product / Service
Autoliv Inc. - Key offerings
SWOT

15.6 Continental AG

Continental AG - Overview
Continental AG - Business segments
Continental AG - Key news
Continental AG - Key offerings
Continental AG - Segment focus
SWOT

15.7 DENSO Corp.

DENSO Corp. - Overview
DENSO Corp. - Business segments
DENSO Corp. - Key news
DENSO Corp. - Key offerings
DENSO Corp. - Segment focus
SWOT

15.8 HELLA GmbH and Co. KGaA

HELLA GmbH and Co. KGaA - Overview
HELLA GmbH and Co. KGaA - Business segments
HELLA GmbH and Co. KGaA - Key news
HELLA GmbH and Co. KGaA - Key offerings
HELLA GmbH and Co. KGaA - Segment focus
SWOT

15.9 Hyundai Mobis Co. Ltd.

Hyundai Mobis Co. Ltd. - Overview
Hyundai Mobis Co. Ltd. - Business segments
Hyundai Mobis Co. Ltd. - Key offerings
Hyundai Mobis Co. Ltd. - Segment focus
SWOT

15.10 Infineon Technologies AG

Infineon Technologies AG - Overview
Infineon Technologies AG - Business segments
Infineon Technologies AG - Key news
Infineon Technologies AG - Key offerings
Infineon Technologies AG - Segment focus
SWOT

15.11 Magna International Inc.

Magna International Inc. - Overview
Magna International Inc. - Business segments
Magna International Inc. - Key news
Magna International Inc. - Key offerings
Magna International Inc. - Segment focus
SWOT

15.12 Mobileye Technologies Ltd.

Mobileye Technologies Ltd. - Overview
Mobileye Technologies Ltd. - Product / Service
Mobileye Technologies Ltd. - Key offerings
SWOT

15.13 NVIDIA Corp.

NVIDIA Corp. - Overview
NVIDIA Corp. - Business segments
NVIDIA Corp. - Key news
NVIDIA Corp. - Key offerings
NVIDIA Corp. - Segment focus
SWOT

15.14 Renesas Electronics Corp.

Renesas Electronics Corp. - Overview
Renesas Electronics Corp. - Business segments
Renesas Electronics Corp. - Key news
Renesas Electronics Corp. - Key offerings
Renesas Electronics Corp. - Segment focus
SWOT

15.15 Robert Bosch GmbH

Robert Bosch GmbH - Overview
Robert Bosch GmbH - Product / Service
Robert Bosch GmbH - Key news
Robert Bosch GmbH - Key offerings
SWOT

15.16 Texas Instruments Inc.

Texas Instruments Inc. - Overview
Texas Instruments Inc. - Business segments
Texas Instruments Inc. - Key offerings
Texas Instruments Inc. - Segment focus
SWOT

15.17 Valeo SA

Valeo SA - Overview
Valeo SA - Business segments
Valeo SA - Key news
Valeo SA - Key offerings
Valeo SA - Segment focus
SWOT

15.18 ZF Friedrichshafen AG

ZF Friedrichshafen AG - Overview
ZF Friedrichshafen AG - Business segments
ZF Friedrichshafen AG - Key news
ZF Friedrichshafen AG - Key offerings
ZF Friedrichshafen AG - Segment focus
SWOT

16. Appendix

16.1 Scope of the report

Market definition
Objectives
Notes and caveats

16.2 Inclusions and exclusions checklist

Inclusions checklist
Exclusions checklist

16.3 Currency conversion rates for US$

16.4 Research methodology

16.5 Data procurement

Information sources

16.6 Data validation

16.7 Validation techniques employed for market sizing

16.8 Data synthesis

16.9 360 degree market analysis

16.10 List of abbreviations

Research Methodology

Technavio presents a detailed picture of the market by way of study, synthesis, and summation of data from multiple sources. The analysts have presented the various facets of the market with a particular focus on identifying the key industry influencers. The data thus presented is comprehensive, reliable, and the result of extensive research, both primary and secondary.

INFORMATION SOURCES

Primary sources

  • Manufacturers and suppliers
  • Channel partners
  • Industry experts
  • Strategic decision makers

Secondary sources

  • Industry journals and periodicals
  • Government data
  • Financial reports of key industry players
  • Historical data
  • Press releases

DATA ANALYSIS

Data Synthesis

  • Collation of data
  • Estimation of key figures
  • Analysis of derived insights

Data Validation

  • Triangulation with data models
  • Reference against proprietary databases
  • Corroboration with industry experts

REPORT WRITING

Qualitative

  • Market drivers
  • Market challenges
  • Market trends
  • Five forces analysis

Quantitative

  • Market size and forecast
  • Market segmentation
  • Geographical insights
  • Competitive landscape

Interested in this report?

Get your sample now to see our research methodology and insights!

Download Now

Frequently Asked Questions

Driver Assistance Systems market growth will increase by USD 45492.1 million during 2026-2030 .

The Driver Assistance Systems market is expected to grow at a CAGR of 11.8% during 2026-2030 .

Driver Assistance Systems market is segmented by Component (Hardware, Software) Type (Adaptive cruise control, Automatic emergency braking, Lane departure warning, Blind spot detection, Others) Vehicle type (Passenger cars, Commercial vehicles)

AISIN Corp., Aptiv Plc, Autoliv Inc., Continental AG, DENSO Corp., Ficosa Internacional SA, HELLA GmbH and Co. KGaA, Hyundai Mobis Co. Ltd., Infineon Technologies AG, Joyson Safety Systems GmbH, Magna International Inc., Mobileye Technologies Ltd., NVIDIA Corp., Panasonic Holdings Corp., Renesas Electronics Corp., Robert Bosch GmbH, Texas Instruments Inc., Valeo SA, Veoneer Inc., ZF Friedrichshafen AG are a few of the key vendors in the Driver Assistance Systems market.

North America will register the highest growth rate of 35.4% among the other regions. Therefore, the Driver Assistance Systems market in North America is expected to garner significant business opportunities for the vendors during the forecast period.

US, Canada, Mexico, China, Japan, India, South Korea, Australia, Indonesia, Germany, UK, France, Italy, The Netherlands, Spain, Saudi Arabia, UAE, South Africa, Israel, Turkey, Brazil, Argentina, Colombia

  • Stringent government regulations and evolving safety standards is the driving factor this market.

The Driver Assistance Systems market vendors should focus on grabbing business opportunities from the Component segment as it accounted for the largest market share in the base year.